


Food-based dietary guidelines (FBDG) are promoted worldwide as an important part of national food and nutrition policies(1). Effective implementation of FBDG is needed to contribute to halting the current non-communicable disease epidemic, such as CVD and obesity(Reference Keller and Lang2). The prevalence of obesity in childhood has increased worldwide in recent decades(3–Reference Johannsson, Arngrimsson, Thorsdottir and Sveinsson6) along with changes in food availability and dietary habits, which also seem to have resulted in diminishing differences in food habits between European countries(Reference Krause and Desjeux7).
The Nordic countries have collaborated for several decades in setting reference values for nutrient intake, which constitute a scientific basis for the FBDG(8). The recommended intake (RI) of vitamin D in Iceland is higher than in the other Nordic countries, which is based on the risk of vitamin D deficiency because of the latitude of the country(8–Reference Steingrimsdottir, Gunnarsson, Indridason, Franzson and Sigurdsson10). Traditionally, vitamin D is supplemented in the form of fish-liver oil, which is also rich in long-chain n-3 fatty acids. Some of the characteristics of the Icelandic diet have changed in recent decades. Studies from the Unit for Nutrition Research on diet in childhood have shown that traditionally high fish consumption has decreased; the intake of vitamin D is low, and dairy consumption has decreased as well(Reference Thórsdóttir and Gunnarsdóttir11, Reference Thorsdottir and Gunnarsdottir12). Fruit and vegetable intake is low in Iceland; the intake was lowest in Iceland of the nine European countries participating in the Pro Children cross-sectional study(Reference Yngve, Wolf and Poortvliet13).
Few studies have focused, at an individual level, on analysing compliance with FBDG, along with evaluation of nutrient intake by comparison with reference values(Reference Royo-Bordonada, Gorgojo, Martín-Moreno, Garcés, Rodríguez-Artalejo, Benavente, Mangas and de Oya14). Dietary habits form during the early school years(Reference Birch and Fisher15), and healthy food habits acquired in childhood tend to continue into adulthood(Reference Lien, Lytle and Klepp16). It is therefore important to know how well the dietary habits of children meet the FBDG and the reference values for nutrient intake. The schools are excellent arenas for reaching a large segment of the population and therefore provide an important opportunity to evaluate children’s food habits. The objective of the present school-based study was to evaluate the diet of 7-year-old children by comparison with FBDG and reference values for nutrient intake.
Methods
Study population
The data were collected from September to the end of November 2006, in six randomly selected schools in Reykjavik. The schools were randomly chosen and represented different social backgrounds (living areas). The sample is representative for the greater Reykjavik area, representing 6 % of all children in the second grade in Iceland in 2006. All children in the second grade (born 1999) were invited to participate in a baseline study prior to a planned school-based intervention for 7–9-year-old children. At each school, data were collected for 2 weeks. Letters to the parents were circulated, with information on the study goal and procedures and securing written consent, of both parent and child. Parents were invited to meetings in the school the week before the data collection period started. In these meetings, instructions on how to record the diet were given. Of the 265 children invited to participate in the present study, 216 returned food records (82 %).
Ethical approval for the study was obtained from the Icelandic Research Ethics Committee.
Dietary assessment
The records were continuous over three days, two weekdays and one weekend day. Parents were provided with accurate electronic scales (PHILIPS HR 2393, Hungary; design and quality of Philips Holland). Parents were advised to record all food and drink as well as vitamin supplements. Parents recorded intake for the weekend day, and on weekdays included what the children brought with them to eat in the morning break at school. The school meal was recorded for each child by a trained nutritionist. All intakes were weighed, except standard portion sizes which were used for the school meals, adjusted for leftovers and refills for each child. The food records were entered, coded and checked by nutritionists. Incomplete records and records of less than three days were excluded, leaving 187 complete records for data analysis (71 %).
Records where energy intake (EI) was less than the estimated BMR times 1·2 were classified as under-reports, as evidence has shown that this indicates gross under-reporting(Reference Bingham17). The equations from the Nordic Nutrition Recommendations (NNR)(8) for calculating the average BMR (MJ/d) = basal energy expenditure (BEE, MJ/d) for 4–10-year-old children, based on body weight (W, kg) and height (H, m), were used: BMRgirls = 0·071W + 0·68H + 1·55 and BMRboys = 0·082W + 0·55H + 1·74. In overweight children the weight was defined to be within the international cut-off points for BMI for overweight(Reference Cole, Bellizzi, Flegal and Dietz18).
Food-based dietary guidelines
The FBDG, for adults and children from 2 years of age, implemented by the Public Health Institute of Iceland are:
• Five portions of fruits and vegetables, corresponding to 500 g/d for adults; children younger than 10 years require smaller portions. In the present study this was defined as 400 g of fruits and vegetables or more per day, 200 g fruits and 200 g vegetables.
• Fish at least twice a week or at least 300 g/week. Because of the young age of the children in the present study, the FBDG for fish was defined as at least 240 g/week.
• Fish-liver oil or another vitamin D supplement, especially during the winter; 5 ml of cod-liver oil gives the RI of vitamin D for children and adults up to 60 years of age. The present study also assessed how many of the children took fish-liver oil some of the days in the 3 d weighed dietary records.
• Two glasses of milk or another milk product, corresponding to 500 g per day; products low in fat and added sugar are advised. Cheese can also be used as a source of calcium: 25 g of cheese corresponding to one glass (one portion) of milk. The recommendation of moderate milk intake was defined as
 portions.
Reference values for evaluation of nutrient intake
The Nordic reference values (NRV) for macronutrient intake for adults and children (from 2 years of age) were used for evaluating the macronutrient intake. The NRV for micronutrient intake for 6–9-year-olds(8) served as a base for the evaluation of micronutrient intake. The average requirement (AR) is used to assess the risk of inadequate intake of micronutrients. AR is established for adults in the NNR 2004, but not for children. The AR for the children in the present study were therefore estimated from the Nordic values (as Icelandic children are Nordic) to assess how many children were below the AR. The estimated AR (EAR) were extrapolated from the adult AR, using the approach for extrapolation suggested by the US/Canada Food and Nutrition Board, which is based on a separate consideration of maintenance needs and growth needs(20–22). The formula for extrapolation is EARchild = EARadult × F, where F = (Wchild/Wadult)0·75 × (1 + growth factor). The average weight (W, kg) of the children in the present study, 26·3 kg, was used together with the weight of an average healthy adult according to NNR(8). The growth factor, 0·15, for children aged 3 years and older is a value obtained from the proportional increase in protein requirements(Reference Prentice, Branca, Decsi, Michaelsen, Fletcher, Guesry, Manz, Vidailhet, Pannemans and Samartín19–21). The reference values for micronutrient intake were compared with the US reference values for 4–8-year-olds(22).
Data analysis
Nutrient calculations were performed on ICEFOOD (program of the Icelandic Nutrition Council), using the Icelandic Nutrient Database (revised), as well as the Icelandic Nutrition Council Recipe Database 2002. All foods and drinks were included in the data analysis; cod-liver oil was included in the data analysis but not other vitamin supplements. Vitamin supplements (other than fish-liver oil) were used some of the days in the 3 d dietary record by 22 % of the children (36 of the 165); approximately 11 % took a vitamin supplement, including vitamin D.
All statistical analyses were carried out using SPSS (Statistical Package for the Social Sciences) for Windows, version 11·0. The level of significance used was P < 0·05. Food and nutrient intakes were checked for normality by inspection and by using the Kolmogorov–Smirnov test. The intake distribution of some nutrients was skewed and was transformed to a natural logarithm prior to statistical analysis. A non-parametric test (Mann–Whitney U) was used to identify gender differences for food intake, as there were some zero values. An independent samples t-test was used to identify gender differences for nutrient intake. A one-sided t-test was used to assess whether a difference between the intake of nutrient and the reference value was significant. An independent samples t-test was used to compare the macronutrient intake on weekend days, Saturday and Sunday, against weekdays. An independent samples t-test was used to compare nutrient intake for the children reaching the FBDG v. those not reaching the FBDG; ANOVA for the FBDG on milk (in Figs 1–4).

Fig. 1 The mean intake of n-3 fatty acids (percentage of total energy intake, E%) for the children who took fish-liver oil some of the recording days (1) v. those who did not take it (0), and the Nordic reference value (NRV) for n-3 fatty acids. The mean intake of n-3 fatty acids for those taking fish-liver oil was 1·0E%, similar to the NRV (about 1E%), but the intake was lower for those not taking fish-liver oil (0·7E%)
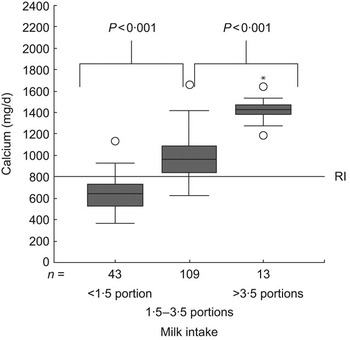
Fig. 2 Mean intake of calcium for the children reaching the food-based dietary guidelines (FBDG) on milk, i.e. had intake around two portions/d (1·5–3·5 portions/d) v. those who had lower or higher intake and the Icelandic recommended intake (RI) for calcium. One portion corresponds to 250 g of milk and other milk products, including cheese, 25 g of cheese corresponding to one portion. The mean calcium intake for the children reaching the FBDG on milk intake was 974 mg/d, which is above the Icelandic RI (800 mg/d). The mean intake was lower among those consuming less than ![]() portions (658 mg/d)
portions (658 mg/d)
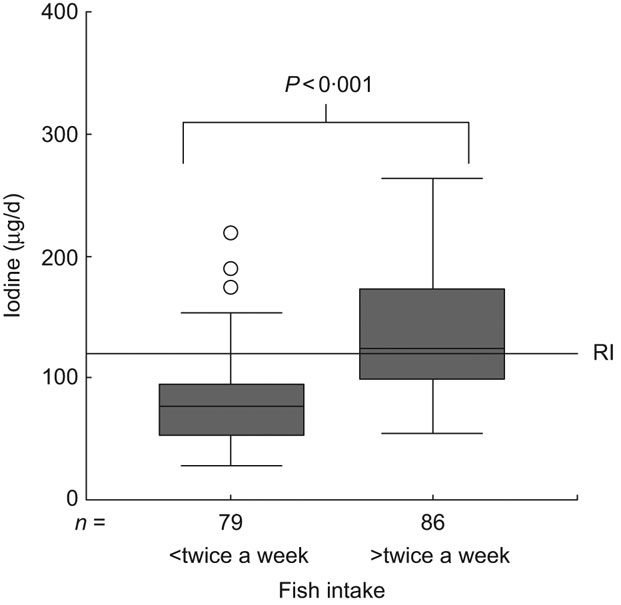
Fig. 3 Mean intake of iodine for those reaching the food-based dietary guidelines (FBDG) on fish, i.e. to eat fish twice a week or more often v. those who did not reach the FBDG and the Nordic recommended intake (RI) for iodine. The mean iodine intake among the children reaching the FBDG on fish was 135 μg/d, which is above the Nordic RI (120 μg/d). It was lower for those not reaching the FBDG (80 μg/d)

Fig. 4 Mean intake of iodine for the children reaching the food-based dietary guidelines (FBDG) on milk, i.e. with intake around two portions/d (1·5–3·5 portions/d) v. those with lower or higher intake and the Nordic recommended intake (RI) for iodine. One portion corresponds to 250 g of milk and other milk products, including cheese, 25 g of cheese corresponding to one portion. The mean intake of iodine for children reaching the FBDG on milk was 119 μg/d, which is similar to the Nordic RI (120 μg/d). Intake was lower for those consuming less than ![]() portions and higher for those consuming more than
portions and higher for those consuming more than ![]() portions
portions
Results
Height and weight were measured in 265 children. The 187 children included in the analysis did not differ from the seventy-eight children not included with regard to BMI (P = 0·795). Under-reporters (eleven girls and eleven boys) were excluded in the data analysis, leaving eighty-nine girls and seventy-six boys for the evaluation of intake. The under-reporters had higher BMI than those not under-reporting, 17·5 kg/m2v. 16·1 kg/m2 (P = 0·016).
Table 1 shows the mean food intake (g/d), separately for girls and boys. The mean intake of fruit and vegetables was lower than recommended, especially the vegetable intake. The most consumed fruits were apples, bananas and oranges. The most consumed vegetables were raw cucumbers, carrots and tomatoes, and less was consumed of other raw and cooked vegetables. Fish intake as well as fish-liver oil intake were lower than recommended. The most consumed fish was lean fish, such as haddock and cod. The mean intakes of processed fish and processed meat were about 3 g/d and less than 10 g/d, respectively; processed fish and meat are not included in the table as the proportion of fish and meat in processed products is relatively low. The intake of fish and fish-liver oil was significantly higher for boys than girls. There was no significant difference between genders in the intake of other food groups. Table 2 shows the percentage of children meeting the FBDG. In total, 16 % reached the FBDG to eat at least 200 g of fruit/d and 1 % to eat at least 200 g of vegetables/d. Further, 52 % reached the FBDG to eat fish twice a week and 41 % took fish-liver oil some of the recording days or reached the FBDG for intake of 5 ml of fish-liver oil/d. In total, 66 % of the children reached the FBDG on dairy intake, ![]() portions of milk or other milk products per day, 26 % consumed less than
portions of milk or other milk products per day, 26 % consumed less than ![]() portions and 8 % more than
portions and 8 % more than ![]() portions.
portions.
Table 1 Mean intake (g/d) of 7-year-old girls (n 89) and boys (n 76)

P-values shown for difference, significant differences in bold.
*Potatoes are not included in ‘vegetables’.
†Processed fish (fish fingers and fish cakes) and meat (forcemeat, hot dogs, etc.) are not included in these values.
‡Not including milk products in other food items.
§Including sweetened fruit drinks.
∥Including chocolate and other sweets.
Table 2 Percentage of children reaching the food-based dietary guidelines (in bold), and the distribution of intake for some of the food groups, analysed for girls (n 89) and boys (n 76), separately
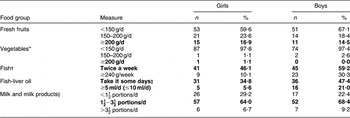
*Potatoes are not included in ‘vegetables’.
†Processed fish (fish fingers and fish cakes) are not included in these values.
‡‘Take it some days’ means that the children took fish-liver oil some of the recording days.
§Milk and other milk products, including cheese, 25 g of cheese corresponding to one portion of milk (250 g, one glass), not including milk products in other food items.
Table 3 shows the mean macronutrient intake per day, the 25th and the 75th percentiles and the NRV. The mean energy from SFA was higher than the NRV. The mean energy intake from the unsaturated fatty acids, MUFA and PUFA, was lower than the NRV. Mean energy intake from added sugar was higher than the upper level of intake. Added sugar included only sugars eaten separately at the table and sugars used as an ingredient in processed or prepared foods, but not naturally occurring sucrose in fruits and berries. The intake of fibre was lower than the NRV. Other macronutrients were within recommendations.
Table 3 Mean intake of macronutrients per day (sd), 25th and 75th percentiles and the Nordic reference values for adults and children from 2 years of age(8) (n 165)

E%, percentage of total energy intake.
Added sugar includes only sugars eaten separately at the table and sugars used as an ingredient in processed or prepared foods, but not naturally occurring sucrose in fruits and berries.
Mean energy intake was higher on weekends, Saturday and Sunday, than on weekdays (P = 0·049). Mean protein intake was higher on weekdays than on weekends (P < 0·001). Mean fat intake was similar on weekends and weekdays (P = 0·486). Mean carbohydrate and added sugar intakes were higher on weekends than on weekdays (P = 0·001 and P < 0·001, respectively).
The mean intake was above the Nordic RI for most of the micronutrients, except for vitamin D and iodine (Table 4). To assess the risk of inadequate intake of micronutrients, the intake was compared with AR for the children, which in the present study were estimated from the Nordic AR for adults. Table 4 shows the estimated AR for the present study and the percentage of children with micronutrient intake below the estimated AR. The percentage of children with micronutrient intake below the US EAR (Estimated Average Requirement) is also shown for comparison.
Table 4 The mean intake of micronutrients per day (sd) of 7-year-old children, 25th, 50th and 75th percentiles, from food sources (including fish-liver oil), percentage of children below the estimated AR extrapolated from the Nordic AR for adults for the children in the present study, and the US EAR for 4–8-year-olds for comparison (n 165)

AR, average requirements; EAR, estimated average requirements; RI, recommended intake; RDA, recommended dietary allowances; RE, retinol equivalents; α-TE, α-tocopherol equivalents; NA, no RI or EAR value for these nutrients.
Reference values: Icelandic/Nordic RI for 6–9-year-old children and estimated AR extrapolated from the Nordic AR for adults for the children in present study, US RDA for 4–8-year-old children and US EAR for 4–8-year-olds.
*The Icelandic recommended intake is the same as the Nordic recommended intake except for calcium, phosphorus and vitamin D. RI for these micronutrients is higher in Iceland.
Figure 1 shows the mean intake of n-3 fatty acids for the children taking fish-liver oil some of the days in the 3 d dietary record v. those who did not. Figure 2 shows the mean calcium intake for the children reaching the FBDG on milk v. those not reaching the FBDG. The main source of calcium in the children’s diet was milk and milk products. The main iodine source in the children’s diet was fish, milk and milk products. Figure 3 shows the mean iodine intake among the children reaching the FBDG on fish v. those not reaching the FBDG. Figure 4 shows the mean intake of iodine for children reaching the FBDG, ![]() portions, on milk v. those consuming less or more.
portions, on milk v. those consuming less or more.
Table 5 shows the mean intake of macro- and micronutrients separately for girls and boys. Boys had significantly higher intake of proteins, n-3 fatty acids, calcium, phosphorus, selenium, iodine, vitamin D, vitamin E and niacin equivalents. When nutrient density was compared, fewer differences were apparent; boys still had significantly higher intake of n-3 fatty acids, calcium, phosphorus and vitamin D than girls. The percentage of energy from carbohydrates was higher for girls than boys.
Table 5 Mean nutrient intake per day (sd) and the percentage contributed to energy intake from macronutrients (n 165)

RE, retinol equivalents; α-TE, α-tocopherol equivalents.
P-values shown for the difference before and after adjustment for energy, significant differences in bold.
Added sugar includes only sugars eaten separately at the table and sugars used as an ingredient in processed or prepared foods, but not naturally occurring sucrose in fruits and berries.
*Transformed to natural logarithm prior to statistical analysis.
†β-Carotene intake was still skewed after transformation and therefore non-parametric tests were used (Mann–Whitney U-test).
‡Retinol equivalents = retinol + β-carotene/12.
§Niacin equivalents = niacin + tryptophan/60.
Discussion
The results of the present study indicate that the diet of a large group of 7-year-old children was, late in 2006, far from the FBDG set for the Icelandic population. Few children met the recommendation to eat at least 200 g of fruit/d and fewer still to eat at least 200 g of vegetables/d. About half of the children reached the recommendation to eat fish at least twice a week. Fewer reached the recommendation to use fish-liver oil. Two-thirds of the children reached the milk recommendation.
The method selected in the present study was 3 d weighed dietary records; it was completed by the parents because of the young age of the children, and the school meal recorded by the researchers at school. The method selected has a relatively high respondent burden, which may have affected the participation rate. However, 82 % of the sample returned the 3 d dietary records, and 71 % of the sample completed the records. Three-day dietary records give an accurate estimate of usual intake for most frequently used foods; for intake of occasionally used foods more days are required, but the respondent burden would then have been higher. Validation studies of energy intake have led to the widespread recognition that dietary data on children and adolescents are prone to reporting error, mostly through under-reporting(Reference Livingstone, Robson and Wallace23). Evaluating the validity of reported energy intake provides a valuable check on the general quality of the dietary data(Reference Livingstone and Black24). Reported energy intakes were evaluated using the estimated BEE of the children. Under-reporters were excluded from the analysis. The mean energy intake in the present study was similar to the mean energy intake of children of the same age range in other studies(Reference Glynn, Emmett and Rogers25, Reference Lambert, Agostoni, Elmadfa, Hulshof, Krause, Livingstone, Socha, Pannemans and Samartín26).
The low consumption of fruits and vegetables is in line with other studies of the diet of Icelandic children(Reference Thorsdottir and Gunnarsdottir12, Reference Kristjansdottir, Thorsdottir, De Bourdeaudhuij, Due, Wind and Klepp27, Reference Thorsdottir, Gunnarsdottir, Ingolfsdottir and Palsson28). The low fruit and vegetable consumption and low intake of whole-grain products results in dietary fibre intake below the NRV (3 g/MJ). To increase the intake of fibre, the intake of whole-grain products, such as wholemeal breads, fruits and vegetables, needs to be increased. The fibre content of most of the breads available in Iceland is below the recommendation (>6 g fibre/100 g). Economic factors may also affect the consumption of wholemeal breads as they are usually more expensive, and studies in the UK and the USA have found that greater consumption of whole grains tends to be associated with higher socio-economical status of the household(Reference Thane, Jones, Stephen, Seal and Jebb29–Reference Cleveland, Moshfegh, Albertson and Goldman31). Increasing fruit and vegetable intake might also have the effect of decreasing sugar intake, which was higher than the upper level for intake (<10 % of the energy from added sugars). A Norwegian study found a negative association between fruit and vegetable intake and sugar intake among children(Reference Øverby, Lillegaard, Johansson and Andersen32). The intake of added sugar was higher on weekends than on weekdays. Weekends may have less structured food choices and mealtimes, compared with weekdays. There are few studies on the possible difference in intake between weekend and weekdays, especially for children. A study from the USA found a difference in energy intake between the weekdays and weekends(Reference Haines, Hama, Guilkey and Popkin33), as was found in the present study. Elementary schools’ food policy may contribute to the lower intake of added sugar during the weekdays, as children are not allowed to bring sweets or soft drinks to school. Many shops offer a 50 % reduction on the price of candy bars on Saturdays, sometimes called ‘candy day’, which may affect the sugar intake on weekends. The mean intake of biscuits and cakes was 50 g/d in the present study. In a study in 9-year-olds, where the diet was assessed with repeated 24 h recalls, the mean intake of biscuits and cakes was 80 g/d(Reference Thorsdottir and Gunnarsdottir12). In a study in 3–5-year-olds, where the diet was assessed with 3 d estimated dietary records, the intake of biscuits and cakes was 20 g/d in 3-year-olds, and 35 g/d in 5-year-olds(Reference Eysteinsdottir, Gunnarsdottir and Thorsdottir36). The intake of biscuits and cakes seems, therefore, to increase with age.
The energy intake from SFA was higher than the NRV, and the intake of unsaturated fatty acids, MUFA and PUFA, was lower than the NRV. This is similar to what has been found in the other Nordic countries: quite high levels of SFA, with relatively lower levels of both MUFA and PUFA(Reference Lambert, Agostoni, Elmadfa, Hulshof, Krause, Livingstone, Socha, Pannemans and Samartín26). The ratio between the essential n-6 and n-3 fatty acids was within the NRV. The children who did not take fish-liver oil, however, had intake of n-3 fatty acids below the NRV for n-3 fatty acids. The ratio has been relatively low in Iceland, compared to the other Nordic countries(8), because of the high fish consumption and the use of fish-liver oil, and the low intake of n-6 fatty acids.
To identify how many children were at risk for inadequate intake of micronutrients, their intake was compared with estimated AR for the children in the present study, estimated from the Nordic adult AR. For many nutrients, extrapolation from infant and adult data is used, resulting in considerable disparities in the perceived nutritional requirements of European children(Reference Prentice, Branca, Decsi, Michaelsen, Fletcher, Guesry, Manz, Vidailhet, Pannemans and Samartín19); therefore, the US EAR were used for comparison. The largest difference between the estimated AR for the present study and US EAR was for vitamin E. This difference may be related to a difference in PUFA intake, as the Nordic adult AR for vitamin E is partly based on the average PUFA intake in the Nordic countries(8).
More than 10 % of the children did not reach the estimated AR for iodine intake, indicating that 10 % of the children may be at risk of inadequate intake. Iodine deficiency has not been common in Iceland as fish and milk consumption has been high; this, however, seems to be changing. Children reaching the FBDG on fish or milk had a mean intake of iodine above or close to the Nordic RI. A significant step to equalise children’s opportunity for a nutritious meal during the school day was undertaken when it was decided in the autumn of 2005 that all elementary schools in Reykjavik should serve a warm meal at lunch time, although facilities and other factors affecting the quality of the meals may still be improved. The Public Health Institute has implemented FBDG for the school canteens(34), e.g. fish should be served at least twice a week, and fruits or vegetables should be part of the meal every day. Water is served with the meal in all schools, but children can have milk with the meal in some schools (in two of the six schools in the present study). Most of the children in the present study participated in the school meals.
The recommendations for vitamin D intake in Iceland are among the highest in Europe(Reference Doets, de Wit and Dhonukshe-Rutten35). The most commonly used vitamin D supplement in Iceland is fish-liver oil. The mean vitamin D intake of the children reaching the FBDG, taking fish-liver oil, was close to the Icelandic RI. In the present study, 41 % of the children fulfilled the recommendation to use fish-liver oil, which is similar to what was found in a recent study of diet among 6-year-old children in Iceland, assessed by weighed food records, where the frequency of fish-liver oil consumption or use of another vitamin D supplement was 40 %(Reference Thórsdóttir and Gunnarsdóttir11). Values for average vitamin D requirements have not been established, but the median is less than two-thirds of the RI, indicating that there is a large group of 7-year-old children with a potential risk of deficient intake. Boys had higher intake of fish-liver oil than girls, therefore more girls are potentially at risk of deficient intake of vitamin D than boys. A similar gender difference in the intake of vitamin D was seen in a study of the diet of 9-year-olds; the mean intake for boys was 4·7 μg and for girls, 2·8 μg(Reference Thorsdottir and Gunnarsdottir12). The percentage of children taking fish-liver oil is higher among preschool children(Reference Eysteinsdottir, Gunnarsdottir and Thorsdottir36), which may at least partly be explained by the tradition of serving fish-liver oil with the breakfast in kindergartens. Vitamin D deficiency has not been detected among Icelandic children in recent decades, but the use of vitamin D supplements in schoolchildren needs to be increased, especially in girls as they seem to have lower intake. To increase intake among children, it is important to give their parents detailed recommendations on vitamin D intake for children and ensure compliance with the RI.
The purpose of FBDG is to educate the population and guide national food and nutrition policies as well as the food industry(1, Reference Keller and Lang2). Thus the FBDG should help the population reach the nutrient recommendations. Changes in FBDG have been shown to affect the diet of Icelandic children. A study on infant nutrition, performed in 1995–1997, revealed low iron status and high protein intake, and showed that iron-status indices were negatively associated with cow’s milk consumption(Reference Thorsdottir, Gunnarsson, Atladottir, Michaelsen and Palsson37, Reference Gunnarsson, Thorsdottir and Palsson38). The Icelandic recommendations for diet in infancy were consequently revised. A study on infant nutrition, performed in 2005–2007, to investigate the effects of the new recommendations showed that the diet in infancy and infants’ iron status had improved (I Thorsdottir, AV Thorisdottir and GI Palsson, unpublished results). As changes in recommendations had an effect on the diet in infancy, effective implementation of the FBDG for schoolchildren might affect their diet. Some of these changes may have to involve the food industry, e.g. to increase consumption of wholemeal breads as most of the breads on the market use more refined meal than recommended. School-based interventions may be used to implement the FBDG. An intervention should aim at both environmental factors, like availability, and personal factors. Personal factors that have been to found to be related to fruit and vegetable intake among children, e.g. preferences, liking, self-efficacy and knowledge(Reference Kristjansdottir, Thorsdottir, De Bourdeaudhuij, Due, Wind and Klepp27), may also be related to the intake of other foods.
Conclusion
Fruit, vegetable, fish and dairy products, as well as vitamin D supplements, need to be increased in 7-year-old children’s diet to reach the FBDG and the reference values for nutrient intake. Dietary changes to increase the quality of fat and carbohydrate are needed as well.
Acknowledgements
The study was supported by research grants from the Eimskip Fund of the University of Iceland, Rannís–The Icelandic Centre for Research and Brim Seafood. There is no conflict of interest. A.G.K. worked on the data collection, calculations and statistical analysis and writing of the paper. I.T. designed the study, and worked on the interpretation of the results and writing of the paper. The authors thank the children and their parents for their participation and the nutritionists Svandis Erna Jonsdottir and Bryndis Elfa Gunnarsdottir for their work on data entering and coding the dietary data.


