


Several studies have identified a rising prevalence of overweight and obesity in British schoolchildren(Reference Chinn and Rona1–Reference Rudolf, Greenwood and Cole3), with particular concern given to the high levels among children in London(4). As diet and physical activity both play a significant role in the onset and development of obesity(Reference Zapata, Bryant, McDermott and Hefelfinger5) and in the maintenance of health of young people(Reference Duncan, Al-Nakeeb, Woodfield and Lyons6, Reference Gibson and Neate7), it is surprising that research combining dietary intake and objectively measured physical activity in children and adolescents from the UK remains inadequate.
British adolescents are recognised as having some of the worst eating habits in Europe(Reference Vereecken, De Henauw and Maes8). Yet, since evidence suggests energy intake to have declined in this age group(Reference Sweeting9), rising obesity levels may be partly explained by a decrease in physical activity, resulting in a positive energy balance. Because of the lack of population-based objective data describing levels of children’s activity, in the UK(Reference Riddoch, Mattocks, Deere, Saunders, Kirkby, Tilling, Leary, Blair and Ness10), it is difficult to establish whether such a decline is actually taking place. Furthermore, although not all children with poor dietary and physical activity habits may currently be overweight or obese, these young people may be putting themselves at risk for other adverse health conditions(11).
Lack of research in this area also constitutes a cause for concern for future health status, as diet and activity patterns established during childhood and adolescence have been recognised as playing a significant role in the onset of chronic disease occurrences in later life(Reference Berkey, Rockett, Field, Gillman, Frazier, Camargo and Colditz12, Reference Baranowski13). With food and activity habits adopted during this life stage also found to track into adulthood(Reference Lien, Lytle and Klepp14, Reference Harro and Riddoch15), the importance of investigating such lifestyle behaviours during the childhood years is crucial, in order to ascertain the most effective ages at which to intervene. A better understanding of the factors determining health behaviours in children and adolescents is, therefore, mandatory not only for better health in youth but also for the prevention of ill-health in adulthood.
Research(Reference Wake16) has shown the family to be a strong determinant of dietary behaviours, but as children grow older they spend increasing amounts of time with friends and the influence of peers may play a more important role in their lifestyle choices. However, the role of the peer group in influencing food choice(Reference Story, Neumark-Sztainer and French17) and physical activity(Reference Springer, Kelder and Hoelscher18) among school children has rarely been examined in the UK. The aim of the present study was therefore to investigate levels of physical activity and dietary intake of boys and girls and to explore any effects of peers on these behaviours.
Methods
Setting and participants
The findings of the present survey are part of an ongoing longitudinal study. Consequently, the power calculation for subject numbers was based on change of physical activity at 9 years, compared with 14 years, from Berkey et al.’s(Reference Berkey, Rockett, Field, Gillman, Frazier, Camargo and Colditz12) longitudinal research. A minimum of 100 volunteers within each age group were initially required and recruited.
Four hundred and three children (216 boys and 187 girls) between the ages of 10 and 13 years (mean 11·4 (sd 1·1) years), who were in full-time education in three primary schools and six secondary schools that ranged from mid to high socio-economic backgrounds in south-west London, were recruited. Due to absenteeism, drop-out and apparatus-related issues such as loss of pedometers or incomplete diary completion, 315 (162 boys, 153 girls) completed all aspects of the study.
To select schools, a one-stage cluster sampling method was used to overcome the constraints of time and costs associated with a dispersed population. The predetermined clusters included: (i) type of school; (ii) school geographic location; (iii) gender make-up of the school; (iv) secondary school feeding system (due to an associated longitudinal study that was also taking place); and (v) school classification. The study was approved by the Ethics Committee of Roehampton University and permission of the head teacher was received from each participating school. Each child gave informed consent and parental consent was obtained prior to the child’s participation in the study.
Measurements
All data were collected by trained researchers and all participants were given clear instructions regarding their involvement. In case any questions arose throughout the duration of data collection, the contact details of the lead researcher were also given. Questionnaires were all completed confidentially under supervision in classrooms or in designated areas; to ensure anonymity throughout the study, each participant was given an ID number.
Dietary intake
Dietary intake was measured with a 3 d diary. This included measurements taken over one weekday and two weekend days. These days were chosen in order to obtain an accurate insight into the children’s food intake. Work by de Castro(Reference De Castro19) has recognised that there is often greater variation in food intake over the weekend compared with weekdays and this chosen method had the added benefit of limiting interference with the school day as much as possible. Participants were instructed to record all food, drink and portion sizes with as much detail as possible. The diary also contained prompts, e.g. ‘What did you have for breakfast?’ and ‘Did you have any snacks today?’, in order to make the process as clear as possible. The 3 d food diary has been recognised as a valid nutritional tool to measure dietary intake in 10- to 13-year-olds(Reference Rockett and Colditz20) and children as young as 8 years of age are recognised to reliably report food intake(Reference Sobo, Rock, Neuhouser, Maciel and Neumark-Stzainer21).
Physical activity
At the same time as completing the food diary, participants were asked to complete (either on their own or with the assistance of an adult) a 3 d activity diary, detailing all activities undertaken and their duration. Participants were asked to carry these diaries with them at all times, so that they could input any physical activity undertaken as soon as possible after the event. Explanations and examples of how to complete the diary correctly were given by the lead researcher at the time of diary distribution. Subjects were also asked to wear a sealed pedometer (Yamax Digiwalker SW-200; Yamasa, Tokyo, Japan), only to be removed during bathing, swimming and sleeping. Participants were asked to go about their everyday activities as normal and not to tamper with the pedometer throughout the 3 d monitoring period. Researchers sealed the pedometers on site and placed them on participants on day 1 of the monitoring period and removed them on day 3. The Yamax Digiwalker SW series has consistently been found among the most accurate of pedometers(Reference Bassett, Ainsworth, Leggett, Mathien, Main, Hunter and Duncan22–Reference Schneider, Crouter and Bassett26), and the Yamax SW-200 is recommended as a reliable monitor for use in children(Reference Kilanowski, Consalvi and Epstein27, Reference Barfield, Rowe and Michael28).
Instructions were given on how to wear the sealed pedometer correctly and record any times in which it was taken on or off. In line with other researchers in the field(Reference Duncan, Al-Nakeeb, Woodfield and Lyons6, Reference Tudor-Locke, Pangrazi, Corbin, Rutherford and Vincent29), if a pedometer was removed for more than 1 h in any one day, those results were omitted from analysis.
Height and weight
Weight and height measurements were taken to the nearest 0·1 kg and 0·1 cm respectively, using the Omron M5-1 Intellisense (Kyoto, Japan) weighing scales and a Leicester (Crawlea Medical, Birmingham, UK) free-standing stadiometer. All participants were instructed to remove their shoes and any other heavy outer garments before measurement. BMI (kg/m2) and BMI Z-score were then calculated using equations based on UK reference data(Reference Cole, Freeman and Preece30).
Peer influence
Peer influence was measured with a questionnaire adapted from Sallis et al.’s(Reference Sallis, Grossman, Pinski, Patterson and Nader31) validated Social Support and Eating Habits/Exercise Survey, and contained questions relating to both physical activity and dietary intake and the effect of peers on these behaviours. Typical questions included: ‘During the past three months, my friends’: (i) ‘encouraged me not to eat “unhealthy foods” (cake, crisps, sweets, chocolate) when I was tempted to do so’; (ii) ‘ate “unhealthy foods” (cake, crisps, sweets, chocolate) in front of me’; (iii) ‘got angry when I encouraged them not to eat “unhealthy foods” (cake, crisps, sweets, chocolate)’; (iv) ‘participated in physical activity or exercise with me’; (v) ‘gave me helpful reminders to be physically active or exercise’; and (v) ‘criticised me or made fun of me for being physically active or exercising’. The questionnaires, which were administered on day 1 of the survey, were piloted to ensure relevance and comprehension with schoolchildren aged at least 10 years, who were not involved in the study.
Data analysis
Since the data were not normally distributed, non-parametric data analyses were undertaken. Food diary analysis was conducted using DietPlan 6 (Forestfield Software, Horsham, UK) and non-parametric data analyses using the SPSS statistical software package version 15·0 (SPSS Inc., Chicago, IL, USA). Spearman’s correlation was used to investigate bivariate relationships between the variables and Mann–Whitney tests were used to investigate differences between genders for all variables. Kruskal–Wallis tests were used to investigate differences between the three age groups (age group 1 = 9–10 years; age group 2 = 11–12 years; age group 3 = 13–14 years) for each dependent variable; both of these tests are for independent levels within a single factor.
Standardised BMI scores (Z-scores) were calculated using Pan and Cole’s(Reference Pan and Cole32) Microsoft® Excel add-in ‘ImsGrowth’ package. These scores represent the degree to which each child deviates from their age- and gender-specific median(Reference Gibson, Lambert and Neate33), using equations based on UK reference data(Reference Cole, Freeman and Preece30). The ‘ImsGrowth’ package also enables graded levels of thinness, normal weight, overweight and obesity of participants to be calculated, based on pooled international data for BMI (UK data included)(Reference Cole, Flegal and Jackson34), and is linked to the WHO recommended adult cut-off points. This allows for direct comparisons of body composition in children and adolescents worldwide.
Results
Physical activity
Boys took significantly more steps per day than girls (P ≤ 0·05; Table 1) but depending on the recommended health cut-offs used(Reference Tudor-Locke, Pangrazi, Corbin, Rutherford and Vincent29, Reference Duncan, Schofield and Duncan35), only 23 %(Reference Tudor-Locke, Pangrazi, Corbin, Rutherford and Vincent29) (or 19 %(Reference Duncan, Schofield and Duncan35)) of boys reached the recommended health cut-offs of 15 000(Reference Tudor-Locke, Pangrazi, Corbin, Rutherford and Vincent29) (or 16 000(Reference Duncan, Schofield and Duncan35)) steps per day and only 29 %(Reference Tudor-Locke, Pangrazi, Corbin, Rutherford and Vincent29) (or 21 %(Reference Duncan, Schofield and Duncan35)) of girls reached their recommended 12 000(Reference Tudor-Locke, Pangrazi, Corbin, Rutherford and Vincent29) (or 13 000(Reference Duncan, Schofield and Duncan35)) steps per day. There were significant positive correlations between the number of steps taken per day and: (i) friends taking part in physical activity or exercise with the participant (r = 0·121; P ≤ 0·05); and (ii) friends discussing physical activity or exercise with the participant (r = 0·116; P ≤ 0·05).
Table 1 Descriptive characteristics of mean pedometer-measured steps per day, daily energy intake, BMI and BMI Z-scores by gender: boys and girls aged 9 to 13 years, south-west London, UK

Dietary intake
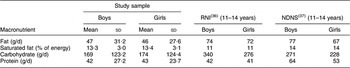
Boys had a significantly higher daily energy intake than girls (P ≤ 0·05; Table 1) but self-reported energy intake for both genders was substantially less than the Reference Nutrient Intake (RNI)(36) and the most recent national food survey of children and adolescents aged 11–14 years (National Diet and Nutrition Survey)(Reference Gregory and Lowe37). Fat and carbohydrate intakes for both boys and girls were below recommendations (RNI; Table 2)(36), with protein being the only macronutrient in both genders that met or exceeded the recommended intake (RNI = 42 g for boys; RNI = 41 g for girls)(36). All macronutrients were also below values for age-comparable UK children (Table 2)(Reference Gregory and Lowe37). However, when analysing saturated fat intake as a percentage of total energy, values for both boys and girls were above those recommended (11 %; Table 2)(36) but below those found for age-comparable UK children (Table 2)(Reference Gregory and Lowe37). There was no association between peer influence and dietary intake.
Table 2 Mean daily macronutrient intake in the study sample compared with the Reference Nutrient Intake (RNI) and the National Diet and Nutrition Survey (NDNS): boys and girls aged 9 to 13 years, south-west London, UK
To assess for reporting error as a result of self-report measures, fruit and vegetable intake recorded in diaries was cross-validated with a Fruit and Vegetables Screening Measure(Reference Prochaska and Sallis38) and a positive correlation (r = 0·43) was revealed(Reference Margetts and Nelson39).
BMI Z-score
According to BMI international grades(Reference Pan and Cole32, Reference Cole, Bellizzi, Flegal and Dietz40), male and female obese individuals had the lowest energy intakes (Table 3) and lowest total step counts per day (Table 4). Boys had significantly higher BMI Z-scores than girls (P ≤ 0·05; Table 1) and according to UK reference data(Reference Cole, Freeman and Preece30), both genders’ mean BMI Z-scores were within the ‘normal’ weight category. Using international grades(Reference Pan and Cole32, Reference Cole, Bellizzi, Flegal and Dietz40), the prevalence of overweight and obesity in the present sample was 13 % and 5 %. Although 80 % of boys and 72 % of girls were classified ‘normal’ weight, 9 % of girls were classified as ‘thin’.
Table 3 Mean daily total energy intake according to BMI international grade and gender: boys and girls aged 9 to 13 years, south-west London, UK
Table 4 Mean total number of steps per day according to BMI international grade and gender: boys and girls aged 9 to 13 years, south-west London, UK

Peer acceptance
There were significant positive correlations between perceived peer acceptance and: (i) total number of steps per day (r = 0·111; P ≤ 0·05); (ii) friends taking part in physical activity or exercise with the participant (r = 0·283; P ≤ 0·01); (iii) friends offering to take part in physical activity or exercise with the participant (r = 0·186; P ≤ 0·01); (iv) friends walking to school with the participant (r = 0·158; P ≤ 0·01); (v) friends discussing physical activity with the participant (r = 0·140; P ≤ 0·01); (vi) friends changing their schedule so that they could be physically active together (r = 0·117; P ≤ 0·05); (vii) friends giving them helpful reminders to be active (r = 0·189; P ≤ 0·01); (viii) friends talking about how much they like to be physically active or exercising (r = 0·242; P ≤ 0·01); and (ix) friends planning physical activity on day trips together (r = 0·227; P ≤ 0·01).
There were significant negative correlations between BMI Z-score and: (i) perceived peer acceptance (r = –0·134; P ≤ 0·05); and (ii) daily portions of fruit and vegetables consumed (r = –0·123; P ≤ 0·05).
Age group
Table 5 shows descriptive characteristics of the present sample by age group. Overall, there were no significant differences in daily energy intake or saturated fat intake between age groups, but a significant difference was found in number of steps per day (P ≤ 0·05) and BMI Z-score (P ≤ 0·01), with the youngest age group having the highest number of steps per day and the lowest BMI Z-scores. In boys only, daily energy intake was also significantly higher in the youngest age group (P ≤ 0·05). Additionally, although boys had significantly higher daily energy intakes than girls (P ≤ 0·05), they were further away from their RNI than girls in age groups 1 (9–10 years) and 2 (11–12 years).
Table 5 Descriptive characteristics of mean pedometer-measured steps per day, daily energy intake, daily saturated fat intake, BMI and BMI Z-score by age group and gender: boys and girls aged 9 to 13 years, south-west London, UK
Gender differences
In girls but not boys, there was a significant positive correlation between number of steps per day and: (i) peer acceptance (r = 0·165; P ≤ 0·05); and (ii) daily portions of fruit and vegetables (r = 0·168; P ≤ 0·05). There was also a significant negative correlation between BMI Z-scores and number of steps per day (r = −0·193; P ≤ 0·05).
In boys, BMI Z-scores and peer acceptance showed an inverse association (r = −0·200; P ≤ 0·01), whereas there was a significant positive correlation between peer acceptance and daily portions of fruit and vegetables (r = 0·308; P ≤ 0·01).
Discussion
The present study investigated levels of physical activity and dietary intake in boys and girls aged 10–13 years, and the influence of peers on these behaviours. The results show low energy intake and physical activity levels but high intakes of saturated fat in boys and girls across all age groups. There were significant associations between peer influence and physical activity levels but not between peer influence and dietary intake.
Up to one-third of English children are already overweight and obese(4) and if no action is taken, researchers believe that one child in five aged 2–15 years in England will be obese by 2010(41). Such a condition results in a higher risk of premature illness and death later in life(Reference Sweeting9), with one study finding overweight in childhood to double the risk of developing CHD in adulthood(Reference Gunnell, Frankel, Nanchahal, Peters and Smith42). Although the majority of participants involved in the present study had BMI Z-scores that were recognised as ‘normal’ (80 %), the prevalence of overweight was disconcerting at 13 % and obesity at 5 %. Consequently, public health concerns have resulted in interventions and recommendations being introduced to curb such levels, with many focusing primarily on a reduction in energy intake(Reference James, Thomas, Cavan and Kerr43, Reference Paineau, Beaufils, Boulier, Cassuto, Chwalow, Combris, Couet, Jouret, Lafay and Laville44).
In line with similar research in English schoolchildren(Reference Duncan, Al-Nakeeb, Woodfield and Lyons6), both boys and girls in the present sample did not engage in recommended physical activity levels. Previously, across many Westernised countries, there has been warranted concern regarding girls’ physical activity levels(Reference Paineau, Beaufils, Boulier, Cassuto, Chwalow, Combris, Couet, Jouret, Lafay and Laville44–Reference Tudor-Locke, Lee, Morgan, Beighle and Pangrazi47). Yet, the current study has produced an interesting new finding regarding boys’ participation levels, with girls’ mean daily step counts being far closer to their gender-specific cut-off for health. This potentially creates an important new angle for the design of gender-specific interventions in the future.
The low levels of energy intake in girls in all age groups and the fact that 9 % of girls were classified as ‘thin’ constitute a cause for concern, as these girls may be putting themselves at risk by undertaking unhealthy weight-management strategies. Such dietary behaviour has been identified as a risk factor for eating disorders(Reference Jacobi, Hayward, de Zwaan, Kraemer and Agras48). Furthermore, the observed decline in energy intake across age groups in boys only is an interesting new finding, which has previously been reported only for girls(Reference Bertheke Post, De Vente, Kemper and Twisk49, Reference Lytle, Himes, Feldman, Zive, Dwyer, Hoelscher, Webber and Yang50) during this life stage. If it can be established that this decline continues throughout adolescence, gender-specific health promotion strategies will be needed.
Low energy intake was evident across all study participants, which may indicate undernutrition. This, however, is unlikely, since the majority of participants were within the ‘normal’ range for BMI Z-scores. Under-reporting may therefore be an issue, recognised elsewhere as a prevalent problem in nutritional research involving school children(Reference Livingstone, Robson and Wallace51). Until more practical, cost-effective methods to assess child and adolescent total energy intake over time are made available, it may be more useful to investigate the types of food they are consuming, as the higher than recommended intakes of saturated fat among both boys and girls across all age groups suggest that food type rather than total energy intake may be playing a more significant role in young people’s health status.
The negative correlations between BMI Z-score and peer acceptance and daily portions of fruit and vegetables, indicate that those children with greater BMI (Z-scores), perhaps as a result of a less healthy diet, feel less accepted by their peers. Negative feelings by peers towards overweight and obese children have been reported previously(Reference Hill and Silver52, Reference Latner and Stunkard53), and contribute to low self-esteem, depression and body dissatisfaction(Reference Sweeting9), which may further contribute to the consumption of a poor diet with fewer healthy foods (fruit and vegetables). Using the school environment to promote self-esteem at the same time as educating children from a young age on the importance of physical activity, could be an effective way to address these issues. It would be also interesting to ascertain whether these correlations continue as children grow older, which may consequently introduce a new angle of approach for lifestyle interventions.
Since adolescence is recognised as a time when young people seek peer approval and social identity, it has been hypothesised that the influence of peers plays a significant role in food acceptability and selection, and there is evidence in support of this notion(Reference Woodward, Ball, Cumming, Williams, Hornsby and Boon54–Reference Cullen, Rittenberry, Olvera and Baranowski56). However, this could not be replicated in the current study, and this is corroborated by findings by French and colleagues(Reference French, Story, Hannan, Breitlow, Jefferey, Baxter and Snyder57), who found friend’s influence to be the least important motivator for snack choice among American adolescents. Furthermore, the finding that peers do not play a role in dietary behaviour in younger childhood (from 10 years onwards) is an important finding for researchers who are interested in examining potential social influences on dietary behaviour in young people. Additional research investigating whether other forms of social support (siblings, teachers, parents) play an interchangeable role in food choice selection as children grow older is, therefore, warranted.
Peers did, however, influence physical activity behaviour in the current study. This is in line with previous research(Reference Springer, Kelder and Hoelscher18, Reference Taylor, Baranowski and Sallis58) and highlights the notion that in order to prevent an obesogenic environment, it is important not only to promote physical activity among young people but also to involve their wider network of peers in this process. At the same time, educating children from a young age on the importance of healthy food choices may help promote healthy lifestyle behaviours that not only prevent weight gain but also prevent unhealthy weight-loss strategies that may also be playing a significant role in the well-being of our nation’s youth.
Limitations
The limitations of the present study include its cross-sectional design and the risk of measurement bias for self-report measures of dietary intake, physical activity and peer influence. In particular, considering that under-reporting was likely, the true results for saturated fat intake may actually be higher, which constitutes a cause for concern. Yet, a number of measures were taken to try and reduce these bias and included: (i) the use of sealed pedometers; (ii) the use of a validated Fruit and Vegetable Screening Measure for Adolescents(Reference Prochaska and Sallis38); and (iii) the use of a reliable and valid questionnaire(Reference Sallis, Grossman, Pinski, Patterson and Nader31) to source all questions related to peer influence. By undertaking longitudinal research, the interactive relationships that have been revealed will also be examined further over time, which may provide a new dimension with which to design more effective interventions to promote healthy lifestyle behaviours in school children.
Conclusions
The present results indicate that the majority of participants were within the normal body composition range but had low energy intakes and physical activity levels and high intakes of saturated fat. In order to try and tackle these poor lifestyle behaviours, education regarding healthy food choices is necessary. Improved techniques that identify under-reporting in the young should also be made available. New physical activity interventions are warranted for boys and girls younger than 9 years of age and should incorporate child and adolescent peer groups. Such designs may be particularly beneficial for obese youth, since the low physical activity levels found could be a major contributing factor to the maintenance of the condition(Reference Purslow, Hill, Saxton, Corder and Wardle59).
Acknowledgements
The authors were supported by a grant from the Human and Life Sciences Research Fund at Roehampton University. No conflicts of interest are declared. T.F. is the corresponding author and S.R., J.D., Y.M.J. and C.V. offered additional contributions to the manuscript. The authors acknowledge Dr Andrew Head for his statistical assistance.


