


Abstract
This study assessed the association between longitudinal patterns of illicit drug use and clinical progression of human immunodeficiency virus (HIV) disease. Confidential computer-based interviews, which addressed illicit drug use and other factors, were completed by HIV-infected participants in Baltimore, Maryland, at 6-month intervals from 1998 onward. To assess this association, the authors used a random-effects model in which clinically defined opportunistic conditions were linked to self-reported periods of drug use, enabling four categories of drug use to be distinguished: nonusers, intermittent users during abstinent periods, intermittent users during active periods, and persistent users. Included in the analysis were 1,851 participants who completed ≥1 survey. For participants who used drugs intermittently over time, the risk of developing new opportunistic conditions during periods of abstinence was similar to that for those who never used drugs (odds ratio = 1.2, 95% confidence interval: 0.9, 1.7). In contrast, compared with that for nonusers, the risk of opportunistic infection was significantly higher for intermittent drug users during periods of active use (odds ratio = 2.2, 95% confidence interval: 1.4, 2.9) and for persistent drug users (odds ratio = 1.9, 95% confidence interval: 1.2, 2.8). Active drug use is temporally linked to HIV disease progression and mortality. Effectively targeting and treating active substance abuse in HIV treatment settings may provide a mechanism to improve clinical outcomes.
Illicit drug use is an important cofactor in the human immunodeficiency virus (HIV)-1 pandemic. In the United States, injection drug use was an acquisition risk factor in 31 percent of the cases of acquired immunodeficiency syndrome reported to the Centers for Disease Control and Prevention through 2002 (1), and, in eastern Europe and Russia, injection drug use is fueling the most rapidly growing epidemic in the world (2).
A history of injection drug use has been associated with delayed use of highly active antiretroviral therapy (HAART) in developed countries (3–5). In the HAART era, a history of injection drug use has been variably reported to be associated with (6, 7) and not associated with (8, 9) clinical disease progression and death in HIV-1-infected individuals. However, such studies have two limitations. First, drug use was assessed as a fixed covariate, based on HIV-1 acquisition risk behavior recorded at cohort enrollment. However, drug use is a dynamic and chronic process. For example, a recent report from a cohort of injection drug users in Baltimore, Maryland, found that approximately only 30 percent of individuals persistently used drugs during an average follow-up of 8 years; the remainder had more complex patterns of drug use (10). Second, noninjection use of heroin and cocaine is common, and individuals using drugs via other routes are misclassified when only injection use is considered.
Active drug use has been reported to be associated with nonadherence to HAART and poorer virologic response to therapy (11–13). Others have found that changes in drug use activity were temporally associated with use of and adherence to HAART and with changes in CD4 cell counts and HIV-1 RNA levels (14). The goal of our study was to assess the longitudinal association of drug use with HIV-1 clinical disease progression in a university-associated clinical cohort.
MATERIALS AND METHODS
Setting and data collection
An observational cohort was established in an urban HIV-1 clinic in 1990, and data from over 5,000 HIV-1-infected patients have been gathered (15). Trained technicians review and abstract information from clinical records onto structured data collection forms; the information is then entered into an automated database. Clinic medical records, the main hospital medical record, and various institutional automated databases (e.g., laboratory, radiology, pathology, discharge summaries) are abstracted. Comprehensive demographic, clinical, laboratory, pharmaceutical, and psychosocial data are collected when patients enroll in the clinic and at 6-month intervals thereafter. Nonexclusive risk factors for HIV-1 acquisition (history of injection drug use, men who have sex with men, known heterosexual exposure, etc.) are identified by clinicians when patients enroll in the cohort. Clinical diagnoses of opportunistic conditions associated with acquired immunodeficiency syndrome (16), other selected conditions, and dates for these events are routinely abstracted. Information on death is obtained from a death registry maintained by the clinic. In addition, death records of the Maryland Bureau of Vital Records and the national Social Security death index are searched regularly.
An ongoing series of patient surveys was initiated in the clinic in November 1998. Surveys were offered longitudinally to participants at 6-month intervals. Each day, the clinic schedule was reviewed, and patients attending appointments were approached and asked to participate in the survey if they had not participated previously or if 6 months had elapsed since their last survey. The 15-minute surveys were integrated into normal clinic wait time, participants were reimbursed for their time, and the participation rate was more than 98 percent among those approached. The surveys were administered by audio, computer-assisted self-interview. This survey method has been found to enhance the reporting of potentially stigmatizing behaviors (17, 18). Participants were informed that their responses to questions were confidential and would be unavailable to clinicians and staff in the clinic. Participants were asked in detail about their use of alcohol, marijuana, heroin, and cocaine and of other drugs in the 6 months preceding the survey by using questions adapted from an instrument developed and validated for the AIDS Link to Johns Hopkins Intravenous Experience (ALIVE) cohort study (19, 20). The University Institutional Review Board approved this study, and study participants provided written informed consent.
Definitions and outcomes
All participants who completed at least one survey were included in the analysis. The explanatory variable of interest was heroin or cocaine use (taken by any route), which we previously found to be associated with underuse of HAART, nonadherence, and poorer HIV-1 RNA and CD4 cell count responses to treatment (11, 14). At-risk alcohol use was defined as a report of 14 or more drinks per week for men or seven or more drinks per week for women (21). Peak HIV-1 RNA was defined as the highest HIV-1 RNA measured prior to the first interview, and nadir CD4 cell count was defined as the lowest CD4 count measured prior to the first interview. Antiretroviral use and adherence was categorized into three groups at each survey, according to self-report: 1) using HAART without any missed doses in the previous 2 weeks, 2) using HAART with one or more missed doses in the previous 2 weeks, and 3) and not using HAART.
The primary outcome for this analysis was the development of new HIV-1–associated opportunistic conditions (16). This outcome was selected because drug users are at higher risk of death from non-HIV-1–related causes (e.g., overdose, homicide, and suicide) than nonusers (10), whereas development of opportunistic conditions is a specific indication of HIV-1 disease progression. In the analysis, recurrent episodes of Pneumocystis jiroveci (formerly P. carinii) pneumonia, candidal esophagitis, and bacterial pneumonia were counted as separate and distinct clinical events as long as there was clinical, microbiologic, or radiologic evidence of resolution of the primary episode prior to a secondary episode. In contrast, other opportunistic conditions were coded as events at their initial manifestation only, because secondary events were thought to represent recurrence of a primary condition in most cases: cytomegalovirus retinitis, cytomegalovirus involvement of the gastrointestinal tract, toxoplasmosis, Cryptosporidium parvum diarrhea, cryptococcal meningitis, disseminated Mycobacterium avium complex, Mycobacterium tuberculosis, progressive multifocal leukoencephalopathy, non-Hodgkin's lymphoma, Kaposi's sarcoma, cervical cancer, HIV-1 dementia/myelopathy complex, and HIV-1–associated wasting (loss of >10 percent of baseline weight, without other identified etiology).
Statistical analysis
We assessed the relation between drug use and outcomes by using both patient-level and observation-level data. For the patient-level analysis, participants were categorized as nonusers, intermittent users, or persistent users according to their longitudinal pattern of heroin or cocaine use over the entire duration of their follow-up. Subjects who completed only a single survey were categorized on the basis of both self-reported drug use in the survey and their history of injection drug use, which was recorded by clinicians at enrollment in the cohort (enrollment preceded the first survey by a median of 2 years). For example, a patient who completed only a single survey in which he or she denied heroin or cocaine use in the prior 6 months, but for whom injection drug use had been recorded as an HIV-1 risk factor at cohort enrollment, was categorized as an intermittent user. Follow-up for each participant was closed at death or was censored at the date of last data abstraction or the date of last contact if lost to follow-up. Baseline differences between nonusers, intermittent drug users, and persistent drug users were assessed with the chi-square and Wilcoxon rank-sum tests for discrete and continuous variables, respectively. Time to death from the first survey was compared in the three groups with the Kaplan-Meier method. Cox proportional hazards modeling was used to adjust for baseline covariates.
We used observation-level data to assess the association between drug use and development of new opportunistic conditions, using longitudinal data analysis techniques to account for repeated observations. Participants were queried about heroin or cocaine use in the 6 months preceding each survey. The 6-month period prior to the first survey was the first observation period for all subjects. When fewer than 6 months separated two consecutive surveys, only that time segment between the surveys was considered for the observation period of the latter survey. When more than 6 months separated consecutive surveys, the observation period for the latter survey was permitted to extend up to 12 months. When consecutive surveys were separated by more than 12 months, the time segment that extended from the first survey in the pair to the date 12 months before the second survey in the pair was excluded from the analysis because it was thought that drug use activity could not be reliably inferred. Opportunistic conditions that met the criteria described above were assigned to individual observation periods based on the occurrence date. On the rare occasions when participants developed more than one opportunistic condition in a single observation period, the binary outcome was coded the same as if a single event had occurred.
For each observation for intermittent drug users, a time-dependent variable was used to distinguish whether drugs were being used actively. Doing so created four categories of drug-use activity for the observation-level analysis: 1) nonusers; 2) intermittent users, abstinent; 3) intermittent users, active; and 4) persistent users. We next fit a random-effects model, which models intrasubject associations as a latent Gaussian process that represents a particular subject's underlying propensity to develop an opportunistic condition. We found that both drug use and opportunistic infections were strongly associated with survival. Thus, survival was likely to be a confounder in the analysis because self-reported drug-use data for a given observation period could be obtained only if the study participant survived long enough to complete the survey corresponding to that time period.
To address this issue, we used a parametric joint longitudinal-survival model (20, 22) that linked the random-effects model and a parametric survival model via the latent Gaussian variable. A Weibull function fit the survival data well and was selected for the parametric survival model. Associations between variables of interest and opportunistic conditions are represented by odds ratios from the joint longitudinal-survival model, which adjusts both for other covariates included in the model and for survival differences associated with those variables.
RESULTS
A total of 1,851 participants met the inclusion criteria and were included in the analysis: 1,028 (56 percent) were categorized as nonusers, 588 (32 percent) as intermittent users, and 235 (13 percent) as persistent users (table 1). Participants contributed a total of 4,719 person-years of follow-up to the study: 2,725 (58 percent) by nonusers, 1,497 (32 percent) by intermittent users, and 497 (10 percent) by persistent users. There were no significant differences among the groups according to sex or nadir CD4 cell count. Peak HIV-1 RNA levels were slightly lower in the intermittent users than in the nonusers. As anticipated from the categorization scheme, there were significant differences among the groups regarding HIV-1 acquisition risk factors. At-risk alcohol use was significantly more frequent in persistent and intermittent drug users than in nonusers. Compared with nonusers, intermittent users and persistent users were slightly older, had been diagnosed with HIV-1 for slightly longer, were less likely to be White, had lower CD4 cell counts at the first survey, had higher HIV-1 RNA levels at the first survey, and were less likely to have used HAART prior to the first survey. Additionally, persistent users were significantly less likely than intermittent users to have used HAART prior to the first survey. Persistent drug users completed significantly fewer surveys, had a later first interview date, and had less follow-up time than either nonusers or intermittent users.
Factor | Nonusers (n = 1,028) | Intermittent users (n = 588) | Persistent users (n = 235) |
|---|---|---|---|
| Age (years) | 40 (35–46) | 41 (37–46)‡ | 41 (37–46)‡ |
| Sex | |||
| Male | 671 (65) | 363 (62) | 156 (66) |
| Female | 357 (35) | 225 (38) | 79 (34) |
| Race/ethnicity | |||
| African American | 793 (77) | 507 (86) | 205 (87) |
| White/other | 235 (23) | 81 (14)§ | 30 (13)§ |
| HIV-1 risk factors (not mutually exclusive) | |||
| Injection drug use | 255 (25) | 427 (73)§ | 207 (88)§,¶ |
| Men having sex with men | 329 (32) | 98 (17)§ | 43 (18)§ |
| Heterosexual exposure or high-risk behavior | 495 (48) | 322 (55)‡ | 108 (46)¶ |
| Time (years) since first testing HIV positive at the first survey | 5 (3–9) | 7 (4–10)§ | 6 (4–10)‡ |
| CD4 count (cells/mm3) | |||
| Nadir prior to the first survey | 146 (26–301) | 167 (35–313) | 165 (61–322) |
| At the first survey | 300 (141–489) | 275 (119–463)‡ | 260 (106–435)‡ |
| HIV-1 RNA level (log10 copies/ml) | |||
| Peak prior to the first survey | 5.0 (4.3–5.6) | 4.9 (4.2–5.5)‡ | 4.9 (4.2–5.5) |
| At the first survey | 3.0 (2.1–4.6) | 3.9 (2.5–4.8)§ | 4.2 (2.6–4.9)§ |
| CDC* category C HIV-1 disease (16) at baseline | |||
| No | 376 (37) | 248 (42) | 95 (40) |
| Yes | 652 (63) | 340 (58)‡ | 140 (60) |
| Antiretroviral exposure at baseline (mutually exclusive) | |||
| None | 125 (12) | 103 (18) | 60 (26) |
| Nucleoside reverse transcription inhibitors | 86 (8) | 100 (17) | 42 (18) |
| Highly active antiretroviral therapy | 817 (80) | 385 (65)§ | 133 (56)§,# |
| At-risk alcohol use** reported in any survey | 124 (12) | 119 (20)§ | 68 (29)§,¶ |
| No. of surveys completed | 2 (1–4) | 3 (1–5) | 2 (1–3)§,# |
| Date of the first survey†† | 3/00 (3/99–5/01) | 1/00 (3/99–5/01) | 8/00 (6/99–5/01)‡,¶ |
| Follow-up time (months) | 32 (18–46) | 30 (13–46) | 23 (12–37)§ |
HIV, human immunodeficiency virus; CDC, Centers for Disease Control and Prevention.
Values are expressed as frequency (%) for discrete variables and as median (interquartile range) for continuous variables.
p < 0.05 compared with never users.
p < 0.001 compared with never users.
p < 0.05 compared with intermittent users.
p < 0.001 compared with intermittent users.
≥14 drinks per week for men or ≥7 drinks per week for women (21).
Dates are formatted as follows, for example: 3/00 = March 2000.
Factor | Nonusers (n = 1,028) | Intermittent users (n = 588) | Persistent users (n = 235) |
|---|---|---|---|
| Age (years) | 40 (35–46) | 41 (37–46)‡ | 41 (37–46)‡ |
| Sex | |||
| Male | 671 (65) | 363 (62) | 156 (66) |
| Female | 357 (35) | 225 (38) | 79 (34) |
| Race/ethnicity | |||
| African American | 793 (77) | 507 (86) | 205 (87) |
| White/other | 235 (23) | 81 (14)§ | 30 (13)§ |
| HIV-1 risk factors (not mutually exclusive) | |||
| Injection drug use | 255 (25) | 427 (73)§ | 207 (88)§,¶ |
| Men having sex with men | 329 (32) | 98 (17)§ | 43 (18)§ |
| Heterosexual exposure or high-risk behavior | 495 (48) | 322 (55)‡ | 108 (46)¶ |
| Time (years) since first testing HIV positive at the first survey | 5 (3–9) | 7 (4–10)§ | 6 (4–10)‡ |
| CD4 count (cells/mm3) | |||
| Nadir prior to the first survey | 146 (26–301) | 167 (35–313) | 165 (61–322) |
| At the first survey | 300 (141–489) | 275 (119–463)‡ | 260 (106–435)‡ |
| HIV-1 RNA level (log10 copies/ml) | |||
| Peak prior to the first survey | 5.0 (4.3–5.6) | 4.9 (4.2–5.5)‡ | 4.9 (4.2–5.5) |
| At the first survey | 3.0 (2.1–4.6) | 3.9 (2.5–4.8)§ | 4.2 (2.6–4.9)§ |
| CDC* category C HIV-1 disease (16) at baseline | |||
| No | 376 (37) | 248 (42) | 95 (40) |
| Yes | 652 (63) | 340 (58)‡ | 140 (60) |
| Antiretroviral exposure at baseline (mutually exclusive) | |||
| None | 125 (12) | 103 (18) | 60 (26) |
| Nucleoside reverse transcription inhibitors | 86 (8) | 100 (17) | 42 (18) |
| Highly active antiretroviral therapy | 817 (80) | 385 (65)§ | 133 (56)§,# |
| At-risk alcohol use** reported in any survey | 124 (12) | 119 (20)§ | 68 (29)§,¶ |
| No. of surveys completed | 2 (1–4) | 3 (1–5) | 2 (1–3)§,# |
| Date of the first survey†† | 3/00 (3/99–5/01) | 1/00 (3/99–5/01) | 8/00 (6/99–5/01)‡,¶ |
| Follow-up time (months) | 32 (18–46) | 30 (13–46) | 23 (12–37)§ |
HIV, human immunodeficiency virus; CDC, Centers for Disease Control and Prevention.
Values are expressed as frequency (%) for discrete variables and as median (interquartile range) for continuous variables.
p < 0.05 compared with never users.
p < 0.001 compared with never users.
p < 0.05 compared with intermittent users.
p < 0.001 compared with intermittent users.
≥14 drinks per week for men or ≥7 drinks per week for women (21).
Dates are formatted as follows, for example: 3/00 = March 2000.
A total of 5,486 surveys, or individual observations, were included in the longitudinal analysis of drug use and development of opportunistic conditions: 3,099 (56 percent) for nonusers, 1,093 (20 percent) for intermittent users during abstinent periods, 789 (14 percent) for intermittent users during periods of active use, and 508 (9 percent) for persistent users. Of the 1,851 participants who completed surveys, 645 (35 percent) completed one, 356 (19 percent) completed two, 246 (13 percent) completed three, 192 (10 percent) completed four, 130 (7 percent) completed five, 106 (6 percent) completed six, 94 (5 percent) completed seven, 54 (3 percent) completed eight, 24 (1 percent) completed nine, and three (<1 percent) completed 10. Persistent users reported using drugs a median of 27 days in the prior 6 months (interquartile range, 6–150), and intermittent users (when active) reported using drugs a median of 14 days in the prior 6 months (interquartile range, 3–90) (p < 0.001).
There were 278 deaths during follow-up (15 percent): 118 (11 percent) among nonusers, 109 (19 percent) among intermittent users, and 51 (22 percent) among persistent users. Time to death was assessed in the three groups with a Kaplan-Meier function (figure 1). The estimated survival rates at 36 months were 87 percent for nonusers, 80 percent for intermittent users (log-rank test p < 0.0001), and 68 percent for persistent users (log-rank test p < 0.0001 compared with nonusers, and p = 0.015 compared with intermittent users). Compared with that for nonusers, the risk of death was higher for intermittent users (hazard ratio = 1.9, 95 percent confidence interval (CI): 1.4, 2.4) and for persistent users (hazard ratio = 2.9, 95 percent CI: 2.1, 4.1), adjusting for age, race, sex, nadir CD4 cell count, and peak HIV-1 RNA level in a Cox proportional hazards model.
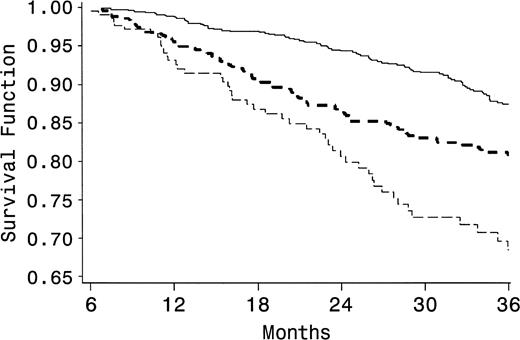
Survival according to the pattern of heroin and cocaine use in a Baltimore, Maryland–based cohort of individuals infected with human immunodeficiency virus-1, 1998–2003. Compared with that for nonusers (solid line), time to death (in months) for intermittent users (dark dashed line, p < 0.001) and persistent users (light dashed line, p < 0.001 compared with nonusers, p = 0.015 compared with intermittent users) was significantly shorter.
Of 5,486 discrete observations for study participants, a new opportunistic condition was recorded in 537 (9 percent): 9 percent of surveys of nonusers, 9 percent of surveys of intermittent users during abstinent periods, 13 percent of surveys of intermittent users during active periods, and 13 percent of surveys of persistent users (table 2). Table 3 shows bivariate and multivariate associations between selected factors and development of new opportunistic conditions when the joint longitudinal-survival modeling technique described above was used. During periods of abstinence, intermittent drug users had a risk of developing new opportunistic conditions that was similar to that for nonusers (odds ratio (OR) = 1.4, 95 percent CI: 1.0, 1.9). In contrast, compared with that for nonusers, the risk of opportunistic infection was statistically significantly higher for intermittent drug users during periods of active drug use (OR = 2.3, 95 percent CI: 1.5, 3.0) and for persistent drug users (OR = 2.1, 95 percent CI: 1.4, 3.1). In the multivariate model, higher peak HIV-1 RNA and lower nadir CD4 cell counts were significantly associated with clinical disease progression, whereas sex, race, and at-risk alcohol use were not.
Opportunistic conditions acquired by participants in a Baltimore, Maryland–based cohort of HIV*-1–infected individuals according to heroin or cocaine use at the time of survey, 1998–2003
Factor | Nonusers (n = 3,099) | Intermittent users, abstinent (n = 1,093) | Intermittent users, active (n = 786) | Persistent users (n = 508) | ||||||||
|---|---|---|---|---|---|---|---|---|---|---|---|---|
| No. | % | No. | % | No. | % | No. | % | |||||
| Surveys that included an opportunistic condition | 268 | 9 | 103 | 9 | 100 | 13 | 66 | 13 | ||||
| Specific conditions† | ||||||||||||
| Bacterial pneumonia | 86 | 32 | 55 | 53 | 47 | 47 | 38 | 58 | ||||
| Candidal esophagitis | 71 | 26 | 30 | 29 | 25 | 25 | 13 | 18 | ||||
| Pneumocystis jiroveci pneumonia | 30 | 11 | 8 | 8 | 8 | 8 | 5 | 8 | ||||
| HIV-1 dementia/myelopathy complex | 26 | 10 | 6 | 6 | 9 | 9 | 4 | 6 | ||||
| Disseminated Mycobacterium avium complex | 12 | 4 | 1 | 1 | 3 | 3 | 0 | 0 | ||||
| Cytomegalovirus retinitis | 14 | 5 | 0 | 0 | 1 | 1 | 1 | 2 | ||||
| Other | 29 | 11 | 3 | 3 | 7 | 7 | 5 | 8 | ||||
HIV, human immunodeficiency virus.
Percentages may not sum to 100 because of rounding.
Bivariate and multivariate associations of selected factors with development of new opportunistic conditions in a Baltimore, Maryland–based cohort of HIV*-1-infected individuals, 1998–2003
Factor | Bivariate | Multivariate | ||||
|---|---|---|---|---|---|---|
| OR*,† | 95% CI† | OR† | 95% CI | |||
| Heroin or cocaine use | ||||||
| Nonuser | 1.0 | 1.0 | ||||
| Intermittent user, abstinent (time dependent) | 1.2 | 0.9, 1.7 | 1.4 | 1.0, 1.9 | ||
| Intermittent user, active (time dependent) | 2.2 | 1.4, 2.9 | 2.3 | 1.5, 3.0 | ||
| Persistent user | 1.9 | 1.2, 2.8 | 2.1 | 1.4, 3.1 | ||
| Sex | ||||||
| Female | 1.0 | 1.0 | ||||
| Male | 0.9 | 0.7, 1.1 | 0.8 | 0.6, 1.0 | ||
| Race | ||||||
| White/other | 1.0 | 1.0 | ||||
| African American | 1.7 | 1.1, 2.5 | 1.4 | 1.0, 2.1 | ||
| Age‡ | 1.0 | 0.9, 1.0 | 1.0 | 1.0, 1.0 | ||
| Peak HIV-1 RNA prior to the first survey§ | 2.3 | 2.0, 2.8 | 1.8 | 1.5, 2.1 | ||
| Nadir CD4 cell count prior to the first survey (tertiles of cells/mm3) | ||||||
| <60 | 1.0 | 1.0 | ||||
| 61–250 | 0.4 | 0.3, 0.5 | 0.5 | 0.4, 0.7 | ||
| >250 | 0.2 | 0.1, 0.3 | 0.3 | 0.2, 0.5 | ||
| At-risk alcohol use¶ | 1.2 | 0.8, 1.8 | 1.0 | 0.6, 1.5 | ||
HIV, human immunodeficiency virus; OR, odds ratio; CI, confidence interval.
Odds ratios represent the association between identified factors and the development of opportunistic conditions during observation using a parametric joint longitudinal-survival model, which adjusts estimates for survival differences in the variables.
Odds ratio represents a 1-year increase.
Odds ratio represents a log10 increase in the variable.
≥14 drinks per week for men or ≥7 drinks per week for women (21).
To assess the effect of a potential mediating factor on the association between drug use and disease progression, we added the antiretroviral use and adherence time-dependent variable to the final adjusted model. Compared with those not using HAART, those using HAART and who missed one or more doses in the prior 2 weeks (OR = 0.8, 95 percent CI: 0.6, 0.1), and those using HAART and who missed no doses (OR = 0.7, 95 percent CI: 0.6, 1.0), were at decreased risk of disease progression. After adjustment for HAART use and adherence, the associations between drug use and HIV-1 disease progression changed only slightly. Compared with that for nonusers, the risk of disease progression was similar for intermittent drug users during abstinent periods (OR = 1.3, 95 percent CI: 0.9, 1.8) and was higher for intermittent users during active periods (OR = 1.6, 95 percent CI: 1.2, 2.3) and for persistent users (OR = 1.9, 95 percent CI: 1.2, 2.8). No statistically significant interactions were detected among the covariates. Similar results were obtained when information for participants who completed fewer than two surveys (n = 1,205; 35 percent) was excluded from the analysis (data not shown).
To address whether the frequency of drug use was associated with HIV-1 disease progression in users, we conducted a supplementary analysis in which self-reported drug use at each survey was categorized as none, use for 20 or fewer days in the past 6 months, or use for more than 20 days in the past 6 months (20 days was the median reported frequency of use among active users). We constructed a random-effects model to assess the risk of opportunistic infection according to the frequency of self-reported drug use. Compared with nonusers of drugs, those who reported drug use for 20 or fewer days in the prior 6 months were at increased risk of opportunistic infection (OR = 1.8, 95 percent CI: 1.3, 2.4), adjusting for sex, race, age, nadir CD4 count, and peak HIV RNA level. This risk was similar in magnitude to that experienced by those reporting use for more than 20 days (OR = 1.9, 95 percent CI: 1.3, 2.6).
DISCUSSION
Injection drug use is a major risk factor for HIV-1 acquisition, and substance abuse disorders are highly prevalent in HIV-1–infected individuals in the United States (23). Previous reports from our cohort demonstrated that active drug use was associated with underuse of and nonadherence with HAART (11) and that transitions in drug use, either achieving abstinence or relapsing, during follow-up were temporally associated with concordant changes in viral load and CD4 cell count, indicators of treatment effectiveness (14). In the current study, we found that, compared with nonusers, intermittent drug users had a twofold increased risk of death and persistent drug users had a threefold increased risk of death. However, active heroin use and cocaine use confer an increased risk of death irrespective of HIV-1 infection (10), and our primary interest was to assess the association between drug use and HIV-1 disease progression. In an adjusted analysis, we found that persistent drug use, compared with nonuse, was associated with a twofold risk of developing new opportunistic conditions. Remarkably, during periods of abstinence, intermittent drug users had a risk of HIV-1 disease progression similar to that for nonusers. However, during periods of active use, intermittent users had a risk of disease progression that was similar to that for persistent users.
Two hypotheses may explain the association we observed between drug use and HIV-1 disease progression. First, drug use may have direct or indirect biologic effects that hasten the progression of HIV-1 infection. Studies have found opioid exposure in vitro to be associated with increased replication of HIV-1 (24) and impaired lymphocyte function (25). However, in pre-HAART natural history cohorts, HIV-infected injection drug users were not found to experience more rapid lymphocyte decline or progression to acquired immunodeficiency syndrome than HIV-infected men who have sex with men (26, 27). Hepatitis C virus coinfection, which is highly prevalent in HIV-infected injection drug users, has been reported by one group to be associated with an impaired CD4 cell response to HAART compared with individuals not infected with hepatitis C virus, despite a similar HIV-1 RNA response (28). However, another group found no evidence that hepatitis C coinfection was associated with immunologic response to HAART or with HIV-1 disease progression (29).
The second hypothesis is that the association between active drug use and HIV-1 disease progression is mediated primarily through detrimental effects of the former on access to care and adherence to therapy. In support of this hypothesis, Moore et al. (30) reported that HIV-1–infected drug users had a risk of disease progression similar to that for non–drug users in the pre-HAART era but experienced disease progression at a significantly higher rate than non–drug users did during the HAART era. Relative to other HIV-1 acquisition risk groups, injection drug users have poorer access to care (31, 32) and underuse HAART (3–5, 32, 33).
In several studies (12, 34–36), drug and alcohol abuse have been linked to poor adherence to HAART. For example, Arnsten et al. (12) measured adherence to HAART in 85 HIV-infected former and active drug users by using electronic bottle-cap recorders, and they found that average adherence was 68 percent among those not using cocaine compared with just 27 percent among those using cocaine. A constellation of factors is likely to contribute to the association between drug use and use of HIV care (37), including subjugation of health concerns to the needs of addiction, competing medical conditions (38), unstable living conditions, alienation from family and social support structures, mistrust of the medical system (39), and clinician discomfort with treating drug abusers (40).
In our study, we attempted to adjust for the potential confounding effects of HAART use and adherence by adding a time-dependent variable to our multivariate model. The estimates for the associations between drug use and HIV-1 disease progression changed only slightly in this model. This finding may support the hypothesis of a direct biologic effect of drug use on disease progression. However, self-reported adherence is a relatively poor surrogate of actual adherence; therefore, substantial residual confounding may remain.
Notably, most of the studies assessing disease progression or mortality have categorized drug users on the basis of HIV-1 risk behaviors identified at enrollment to the cohort and not according to drug-use activity over time (7, 30, 41), which is likely to underestimate the impact of ongoing drug use on HIV-1 treatment outcomes and disease progression. In our study, we found that persistent drug users were at significantly increased risk of developing new opportunistic conditions and had the highest risk of death, while nonusers had the lowest risk of death. In contrast, the risk of intermittent drug users developing new opportunistic conditions was temporally tied to drug-use activity, and, as a group, their mortality rate was midway between that of persistent drug users and that of non–drug users. Drug abuse is a dynamic behavior. A recent report from a longitudinal cohort of injection drug users in Baltimore, in which participants were followed up for an average of nearly 8 years, identified three broad patterns of drug use: persistent use in approximately 30 percent, long-term cessation in approximately 20 percent, and more complicated relapsing and remitting patterns in the remaining 50 percent (10).
Our study has several limitations. First, it was conducted in a single university-associated HIV-1 clinic, and our findings may not generalize to centers where demographic and behavioral factors are dissimilar to those of our cohort. Data were collected from a convenience sample, which may be a biased subset of the clinic population if individuals who were more ill were more likely to attend clinic appointments than those who felt well. Second, our assessment of drug-use activity relied on participant self-report. To maximize participant candor, surveys were conducted by using an audio, computer-assisted self-interview, a technique that has been found to increase reporting of potentially stigmatizing behaviors (17, 18). Additionally, subjects were informed that interview procedures were separate from clinical care and that their responses to interview items would not be available to clinicians, nurses, or other members of the clinical care team. HIV-1 disease progression outcomes were abstracted from clinical records in a prospective data collection process that was separate from participant interviews. Of note, the misclassification that would occur if individuals who were actively using drugs tended to minimize or deny drug use would be expected to bias the observed association between drug use and HIV-1 disease progression toward the null. Thus, the magnitude of association between drug use and disease progression that we observed is likely to be an underestimate.
Third, depression, which has been associated with adherence and HIV treatment outcomes (42), was not assessed in participant surveys. Fourth, reverse causality, where subjects relapsed to drug use because they had become ill with opportunistic conditions, cannot be excluded in our study design. Fifth, cause of death was not available in our cohort database, which precluded analyzing mortality according to causes related and unrelated to HIV-1.
The results of this study and earlier reports from our cohort (11, 14, 31) have implications for the treatment of HIV-1–infected drug users. Periods of active drug use in HIV-1–infected individuals pose dual risks. First, persistent or relapsed drug use directly affects adherence to both HAART (12) and clinic appointments (31), which contributes to the clinical disease progression and higher mortality that we observed in this study. Second, active drug use is an efficient vehicle for HIV-1 transmission to other individuals, through shared injecting paraphernalia and other associated behaviors (43). The risk of transmitting drug-resistant HIV-1 strains may be greater when relapsed drug use in HAART-treated individuals is accompanied by waning adherence and a rebounding viral load. The Centers for Disease Control and Prevention has advocated that clinicians who treat HIV-1–infected individuals identify and address transmission risk behaviors in their patients as a routine part of clinical care (44).
HIV-1 infection and drug abuse are chronic conditions that interact with one another over time. Treatment paradigms that integrate HIV-1 treatment, substance abuse treatment, and psychiatric care should be emphasized (45, 46). In the case of opioid dependence, highly effective pharmacologic treatment modalities exist (47, 48), and strategies that link such treatment with HIV-1 primary care should be strongly encouraged (49). Recent legislation and the US Food and Drug Administration's approval of sublingual buprenorphine for the management of opioid dependence in primary-care settings (47) are particularly apt for HIV-1 treatment clinics.
In conclusion, compared with mortality in HIV-1-infected non–drug users in this longitudinal study, mortality was approximately twofold higher in intermittent drug users and threefold higher in persistent users. The risk of developing new opportunistic conditions was significantly higher for persistent users than for nonusers. For intermittent users, periods of active drug use posed a risk of HIV-1 disease progression that was similar to that for persistent users, while abstinent periods were associated with a risk of disease progression similar to that for non–drug users. Effectively targeting and treating active drug use may lead to improved HIV-1 clinical outcomes.
This work was supported by the National Institute on Drug Abuse (grants DA15616, DA11602, and DA00432).
Dr. Chaisson is a consultant to Bristol-Myers Squibb Company (New York, New York) and Tibotec, Inc. (Yardley, Pennsylvania).
References
Centers for Disease Control and Prevention. HIV/AIDS surveillance report, 2002 ed, vol 14, table 16. (Available at http://www.cdc.gov/hiv/stats/hasrlink.htm). (Last accessed December
UNAIDS. AIDS epidemic update: December 2005. (Available at http://www.unaids.org/Epi2005/doc/report_pdf.html). (Last accessed December
Celentano DD, Galai N, Sethi AK, et al. Time to initiating highly active antiretroviral therapy among HIV-infected injection drug users.
Strathdee SA, Palepu A, Cornelisse PG, et al. Barriers to use of free antiretroviral therapy in injection drug users.
Murri R, Fantoni M, Del Borgo C, et al. Intravenous drug use, relationship with providers, and stage of HIV disease influence the prescription rates of protease inhibitors.
Poundstone KE, Chaisson RE, Moore RD. Differences in HIV disease progression by injection drug use and by sex in the era of highly active antiretroviral therapy.
Perez-Hoyos S, Del Amo J, Muga R, et al. Effectiveness of highly active antiretroviral therapy in Spanish cohorts of HIV seroconverters: differences by transmission category.
Junghans C, Low N, Chan P, et al. Uniform risk of clinical progression despite differences in utilization of highly active antiretroviral therapy: Swiss HIV Cohort Study.
Mocroft A, Madge S, Johnson AM, et al. A comparison of exposure groups in the EuroSIDA study: starting highly active antiretroviral therapy (HAART), response to HAART, and survival.
Galai N, Safaeian M, Vlahov D, et al. Longitudinal patterns of drug injection behavior in the ALIVE Study cohort,1988–2000: description and determinants.
Lucas GM, Cheever LW, Chaisson RE, et al. Detrimental effects of continued illicit drug use on the treatment of HIV-1 infection.
Arnsten JH, Demas PA, Grant RW, et al. Impact of active drug use on antiretroviral therapy adherence and viral suppression in HIV-infected drug users.
Palepu A, Tyndall M, Yip B, et al. Impaired virologic response to highly active antiretroviral therapy associated with ongoing injection drug use.
Lucas GM, Gebo KA, Chaisson RE, et al. Longitudinal assessment of the effects of drug and alcohol abuse on HIV-1 treatment outcomes in an urban clinic.
Moore RD. Understanding the clinical and economic outcomes of HIV therapy: The Johns Hopkins HIV clinical practice cohort.
Locke SE, Kowaloff HB, Hoff RG, et al. Computer-based interview for screening blood donors for risk of HIV transmission.
Turner CF, Ku L, Rogers SM, et al. Adolescent sexual behavior, drug use, and violence: increased reporting with computer survey technology.
Vlahov D, Anthony JC, Munoz A, et al. The ALIVE study, a longitudinal study of HIV-1 infection in intravenous drug users: description of methods and characteristics of participants.
Guo X, Carlin BP. Separate and joint modeling of longitudinal and event time data using standard computer packages.
Alcohol consumption levels by sex, age, and education: NHIS, 1987 and 1992. Bethesda, MD: National Institute on Alcohol Abuse and Alcoholism,
Henderson R, Diggle P, Dobson A. Joint modelling of longitudinal measurements and event time data.
Bing EG, Burnam MA, Longshore D, et al. Psychiatric disorders and drug use among human immunodeficiency virus-infected adults in the United States.
Peterson PK, Sharp BM, Gekker G, et al. Morphine promotes the growth of HIV-1 in human peripheral blood mononuclear cell cocultures.
Mientjes GH, Miedema F, van Ameijden EJ, et al. Frequent injecting impairs lymphocyte reactivity in HIV-positive and HIV-negative drug users.
Lyles CM, Margolick JB, Astemborski J, et al. The influence of drug use patterns on the rate of CD4+ lymphocyte decline among HIV-1-infected injecting drug users.
Spijkerman IJ, Langendam MW, Veugelers PJ, et al. Differences in progression to AIDS between injection drug users and homosexual men with documented dates of seroconversion.
Greub G, Ledergerber B, Battegay M, et al. Clinical progression, survival, and immune recovery during antiretroviral therapy in patients with HIV-1 and hepatitis C virus coinfection: the Swiss HIV Cohort Study.
Sulkowski MS, Moore RD, Mehta SH, et al. Hepatitis C and progression of HIV disease.
Moore RD, Keruly JC, Chaisson RE. Differences in HIV disease progression by injecting drug use in HIV-infected persons in care.
Lucas GM, Chaisson RE, Moore RD. Highly active antiretroviral therapy in a large urban clinic: risk factors for virologic failure and adverse drug reactions.
Shapiro MF, Morton SC, McCaffrey DF, et al. Variations in the care of HIV-infected adults in the United States: results from the HIV Cost and Services Utilization Study.
Bassetti S, Battegay M, Furrer H, et al. Why is highly active antiretroviral therapy (HAART) not prescribed or discontinued? Swiss HIV Cohort Study.
Golin CE, Liu H, Hays RD, et al. A prospective study of predictors of adherence to combination antiretroviral medication.
Cook RL, Sereika SM, Hunt SC, et al. Problem drinking and medication adherence among persons with HIV infection.
Haubrich RH, Little SJ, Currier JS, et al. The value of patient-reported adherence to antiretroviral therapy in predicting virologic and immunologic response. California Collaborative Treatment Group.
O'Connor PG, Selwyn PA, Schottenfeld RS. Medical care for injection-drug users with human immunodeficiency virus infection.
Altice FL, Mostashari F, Friedland GH. Trust and the acceptance of and adherence to antiretroviral therapy.
Gerbert B, Maguire BT, Bleecker T, et al. Primary care physicians and AIDS. Attitudinal and structural barriers to care.
Egger M, May M, Chene G, et al. Prognosis of HIV-1-infected patients starting highly active antiretroviral therapy: a collaborative analysis of prospective studies.
Ickovics JR, Hamburger ME, Vlahov D, et al. Mortality, CD4 cell count decline, and depressive symptoms among HIV-seropositive women: longitudinal analysis from the HIV Epidemiology Research Study.
Nelson KE, Galai N, Safaeian M, et al. Temporal trends in the incidence of human immunodeficiency virus infection and risk behavior among injection drug users in Baltimore, Maryland, 1988–1998.
Recommendations for incorporating human immunodeficiency virus (HIV) prevention into the medical care of persons living with HIV.
Umbricht-Schneiter A, Ginn DH, Pabst KM, et al. Providing medical care to methadone clinic patients: referral vs on-site care.
Selwyn PA, Feingold AR, Iezza A, et al. Primary care for patients with human immunodeficiency virus (HIV) infection in a methadone maintenance treatment program.
Fiellin DA, O'Connor PG. Office-based treatment of opioid-dependent patients.
Effective medical treatment of opiate addiction. National Consensus Development Panel on Effective Medical Treatment of Opiate Addiction.

