


Abstract
Few studies have compared associations of blood lead and tibia lead with blood pressure and hypertension, and associations have differed in samples with occupational exposure compared with those with mainly environmental lead exposure. African Americans have been underrepresented in prior studies. The authors performed a cross-sectional analysis of 2001–2002 data from a community-based cohort in Baltimore, Maryland, of 964 men and women aged 50–70 years (40% African American, 55% White, 5% other race/ethnicity) to evaluate associations of blood lead and tibia lead with systolic and diastolic blood pressure and hypertension while adjusting for a large set of potential confounding variables. Blood lead was a strong and consistent predictor of both systolic and diastolic blood pressure in models adjusted and not adjusted for race/ethnicity and socioeconomic status. Tibia lead was associated with hypertension status before adjustment for race/ethnicity and socioeconomic status (p = 0.01); after such adjustment, the association was borderline significant (p = 0.09). Propensity score analysis suggested that standard regression analysis may have exaggerated the attenuation. These findings are discussed in the context of complex causal pathways. The data suggest that lead has an acute effect on blood pressure via recent dose and a chronic effect on hypertension risk via cumulative dose.
Comparison of associations between blood lead and tibia bone lead with health outcomes allows inferences to be made about the acute and chronic effects of recent and cumulative lead dose (1–3). Studies have compared associations of blood lead and bone lead with blood pressure and/or hypertension in two populations with current or former occupational lead exposure (2, 4, 5) and three populations whose lead exposure was mainly from nonoccupational sources (6–9) (table 1). In the latter studies, only bone lead was associated with blood pressure or hypertension status, despite a large number of studies that have reported strong and consistent relations of blood lead and blood pressure when blood lead was the only lead biomarker measured (10–16). In the occupational studies, blood lead has more often been associated with systolic blood pressure in cross-sectional analysis (2), while tibia lead has been associated with longitudinal increases in blood pressure (5) or hypertension status at cross-section (4). Associations are not entirely consistent across studies.
Epidemiologic studies that have compared associations of blood lead and bone lead with blood pressure and hypertension
Study (reference no.) | Population | Mean lead biomarker (SD*) | Covariates not included† | Summary of findings | ||||||||||||||||||||
|---|---|---|---|---|---|---|---|---|---|---|---|---|---|---|---|---|---|---|---|---|---|---|---|---|
| Sample size‡ | Study design | % Male | Race/ ethnicity (%) | Mean age in years (SD) | Outcomes | Blood (μg/dl) | Tibia (μg/g) | Patella (μg/g) | Calcaneus (μg/g) | |||||||||||||||
| Occupational lead exposure | ||||||||||||||||||||||||
| Lee et al. (4) | 798 | XS* | 79.4 | Korean (100) | 40.5 (10.1) | SBP,* DBP,* HTN* (SBP >160 or DBP >96 or use of HTN medication) | 32 (15) | 37.2 (40.4) | N/A* | N/A | Dietary sodium, dietary potassium | Tibia OR* = 1.005 (95% CI*: 1.000, 1.001) for HTN; blood and tibia lead not associated with SBP or DBP | ||||||||||||
| Schwartz and Stewart (2) | 543 | XS | 100 | White (93) | 57.6 (7.5) | SBP, DBP, HTN (SBP >160 or DBP >96 or use of HTN medication) | 4.6 (2.6) | 14.4 (9.3) | N/A | N/A | Dietary sodium, dietary potassium | 1 μg/dl increase in blood lead associated with a 0.50 mmHg increase in SBP (p = 0.04) and a 0.31 mmHg increase in DBP (p = 0.03); blood lead associated with HTN among workers younger than age 58 years; tibia lead not associated with SBP, DBP, HTN | ||||||||||||
| Glenn et al. (5) | 496 | L* | 100 | NR*,§ | 55.8 (7.4) | SBP, DBP | 4.6 (2.6) | 14.7 (9.4) | N/A | N/A | Dietary sodium, dietary potassium | SBP increased at an average annual rate of 0.64 mmHg and 0.73 mmHg for each 1 SD increase in blood lead and tibia lead, respectively | ||||||||||||
| Nonoccupational lead exposure | ||||||||||||||||||||||||
| Hu et al. (7) | 590 | XS | 100 | White (98) | 66.6 (7.2) | HTN (SBP >160 or DBP >96 or use of HTN medication) | 6.3 (4.1) | 21.6 (12.1) | 32.1 (18.7) | N/A | Age, dietary sodium, dietary potassium | Tibia OR = 1.019 (95% CI: 1.004, 1.035) for HTN; blood or patella lead not associated with HTN | ||||||||||||
| Cheng et al. (6) | 519 | XS | 100 | White (97) | NR¶ | SBP, DBP | NR¶ | NR¶ | NR¶ | N/A | Antihyper tensive medication, dietary sodium, dietary potassium | 1 SD (13.7 μg/g) increase in tibia lead associated with a 1.37 mmHg increase in SBP; blood or patella lead not associated with SBP; no associations reported for DBP | ||||||||||||
| Cheng et al. (6) | 474 | L | 100 | NR¶ | NR¶ | HTN (SBP >160 or DBP >95 or use of HTN medication) | NR¶ | NR¶ | NR¶ | NR¶ | Dietary sodium, dietary potassium | 1 SD (19.6 μg/g) increase in patella lead associated with a rate ratio of 1.29 (95% CI: 1.04, 1.61) for HTN; blood and patella lead not associated with incident HTN | ||||||||||||
| Korrick et al. (8) | 284 | CC* | 0 | White (99) | 58.7 (7.2) | HTN (SBP >140 or DBP >90 or physician diagnosis) | 3.0 (2.0) | 13.3 (9.0) | 17.3 (11.1) | N/A | Dietary potassium | Patella lead odds ratio for HTN = 1.03 (95% CI: 1.00, 1.05) | ||||||||||||
| Rothenberg et al. (9) | 667 | XS | 0 | Latina (81); Black (17.5); White (1.1); Asian (0.4)# | 31.0 (7.7)# | SBP, DBP, HTN (SBP >140 or DBP >90) assessed at the third trimester and postpartum | 2.3 (+4.3/−1.2)#,** | 8.0 (11.4)# | N/A | 10.7 (11.9)# | N/A | Third trimester: a 10 μg/g increase in calcaneus lead associated with an odds ratio of 1.86 (95% CI: 1.04, 3.32) for HTN and a 0.7 mmHg (95% CI: 0.04, 1.36) SBP increase and 0.5 mmHg (95% CI: 0.01, 1.08) DBP increase; postpartum: blood lead associated with decreased SBP and DBP | ||||||||||||
SD, standard deviation; XS, cross-sectional; SBP, systolic blood pressure (mmHg); DBP, diastolic blood pressure (mmHg); HTN, hypertension; N/A, not applicable; OR, odds ratio; CI, confidence interval; L, longitudinal; NR, not reported; CC, case-control.
Studies of associations of lead with blood pressure or hypertension have generally included a core set of covariates: age, sex, body mass index, dietary sodium, dietary potassium, and antihypertensive medication use (for blood pressure analyses only). Covariates from this set are listed here if they were not used in an investigator's analysis. If adjustment for one of these covariates was not applicable because of minimal sample variability, then it is not listed.
No. of subjects for whom data were included in multivariate analyses leading to reported associations.
The same cohort that was studied by Schwartz and Stewart.
Cheng et al. provided separate demographic and biomarker data for normotensives (n = 337) and “borderline” hypertensives (n = 182) used in the cross-sectional analysis. Demographic and biomarker data were similar to those reported by Hu et al. in the same cohort. No demographic and biomarker data were provided for the 474 subjects in the longitudinal analysis.
Demographic and biomarker data were reported (except when missing) for 720 eligible subjects rather than the 667 used in the analysis.
Geometric mean and geometric standard deviation.
These studies have several limitations. First, study populations have generally been homogeneous with regard to race/ethnicity, sex, and socioeconomic status (table 1). Among nonoccupational studies, data on predominantly White male veterans (6, 7), White female nurses (8), and Latina mothers (9) have been examined. Occupational investigations have been conducted of Korean workers (4) and White retired workers in the United States (2, 5). The majority of subjects studied have been male, and African Americans have rarely been assessed. Second, five studies examined associations with hypertension status, but only two (8, 9) defined hypertension by using current guidelines from the Seventh Report of the Joint National Committee on the Prevention, Detection, Evaluation, and Treatment of High Blood Pressure (17). Finally, some studies have not adjusted for potential confounders of this association such as age (7) and antihypertensive medications (6). The roles of race/ethnicity and socioeconomic status have not been fully investigated; because these two factors could be causally related to cumulative lead dose, it is particularly important to carefully consider them in studies of community-dwelling urban residents.
Herein we report associations of blood lead and tibia lead with blood pressure and hypertension in a large, population-based sample of older, community-dwelling adults aged 50–70 years. Subjects represent the full range of socioeconomic status in the population and include large numbers of African Americans and Whites as well as men and women.
MATERIALS AND METHODS
Study design
The Baltimore Memory Study is a longitudinal study of the multilevel determinants of cognitive decline in urban residents. Details on the study design, study subjects, and data collection methods have been published previously (18). In this paper, we present a cross-sectional analysis of data from the first study visit, completed from May 2001 to September 2002, with the exception that tibia lead concentrations were measured at the second study visit, from October 2002 to March 2004. Because of a clearance half-time of approximately three decades for lead in tibia (19), the measured tibia lead levels are a valid estimate of levels at the time of blood pressure measurement.
Subject selection and recruitment
Subject selection and recruitment methods have been described previously (18). In brief, the source population comprised residents of 65 named contiguous neighborhoods in central and northern Baltimore City, Maryland, aged 50–70 years who had lived in the greater Baltimore area for at least the previous 5 years. Households were randomly selected from the source neighborhoods. Among the 2,351 subjects for whom eligibility could be determined, 1,140 (48.5 percent) were enrolled in the study (18). Of the 1,013 subjects who completed tibia lead measurement, three lacked height or weight data (body mass index could not be calculated), six were missing information on socioeconomic status, and 40 had either an insufficient quantity of blood or an unsuccessful venipuncture. As a result, the analysis included data on 964 study subjects. The study was approved by the Committee for Human Research of the Johns Hopkins Bloomberg School of Public Health, and all study participants were paid $50 for their time and effort.
Data collection
All data collection was performed by trained research assistants at the study clinic in north-central Baltimore (18). Study participants first provided written, informed consent. Data were then collected in the following order: neurobehavioral testing, blood pressure, height, weight, spot urine collection, structured interview, and venipuncture. Of the available study data, the analysis presented herein utilized the variables and metrics described in the three paragraphs below.
Blood pressure measurement.
Three blood pressure (systolic and fifth Korotkoff diastolic) measurements, with the subject sitting, were taken by a trained technician using a Hawksley random zero sphygmomanometer (Hawksley, Sussex, United Kingdom) and a protocol consistent with the recommendations of the American Society of Hypertension (20). The mean of the three readings was used for statistical analyses.
Structured interview.
Subjects provided self-reported race/ethnicity (using the 2000 US Census method), detailed current medication use, and history of alcohol consumption and tobacco use. Socioeconomic status was assessed in four dimensions—educational status, occupational status, household income, and household assets (the latter two comprise household wealth when summed)—using methods previously reported (18). In older populations, failure to measure assets, such as the value of homes, businesses, and retirement accounts (21), can lead to misclassification of socioeconomic position, especially for African Americans, because racial/ethnic disparities regarding assets are substantially greater than those for income (22).
Laboratory methods.
A 10-ml blood specimen was obtained by venipuncture by a trained phlebotomist and was initially stored at −20°C. Lead was measured in whole blood by anodic stripping voltammetry in the laboratories of the Kennedy Krieger Institute in Baltimore (23). The limit of detection was 1 μg/dl, and the intra- and interday coefficients of variation (for 5.9 μg/dl) were 11 percent and 7 percent, respectively. Tibia lead was measured in micrograms of lead per gram of bone mineral (μg/g) after a 30-minute assessment at the mid-tibia shaft with 109Cd-based K-shell induced x-ray fluorescence by using previously published methods (24, 25). The statistical analysis retained all point estimates to minimize bias (26). Methods for measuring serum lipids, cholesterol, and homocysteine have been reported previously (27).
Statistical analysis
There were three objectives. First, we compared associations of blood lead and tibia lead with blood pressure and hypertension after controlling for a base set of covariates. Second, we assessed these relations before and after controlling for socioeconomic status and race/ethnicity. Third, we evaluated whether associations differed by race/ethnicity. All analyses were performed with Stata version 8.2 software (Stata Corporation, College Station, Texas), all significance testing was two sided, and 95 percent confidence intervals are reported herein.
Multiple linear regression was used to examine the relations of blood lead and tibia lead with systolic blood pressure and diastolic blood pressure (in mmHg) as continuous dependent variables. Covariates entered into every model based on a priori knowledge and biology included age (years), sex, body mass index (weight (kg)/height (m)2), antihypertensive medication use, dietary sodium intake (mg/day), dietary potassium intake (mg/day), time of day, and testing technician. Dietary intake was estimated by using the Block 98.2 food frequency questionnaire, as described previously (28).
Other covariates were added to this model one at a time and were retained if they were associated with both systolic and diastolic blood pressure or if they changed blood lead or tibia lead coefficients by more than 20 percent. Serum total cholesterol was retained under these criteria, and it joined the a priori covariates in the “base” model (model 1). Three more blood pressure models were constructed. Model 2 included three measures of socioeconomic status: household wealth (ln-transformed sum of household income and household assets), educational status (nine levels), and occupational status (four levels) (18). Model 3 included three indicator variables for race/ethnicity (African American, African-American/mixed race, and other race/ethnicity), with Whites as the reference group. Model 4 included both race/ethnicity and socioeconomic status. Linear regression models included blood lead values (μg/dl), tibia lead point estimate values (μg/g), or both together to assess the independent influence of each. To evaluate effect modification by race/ethnicity on the relations of lead dose with blood pressure, cross-product terms with African-American race/ethnicity and each lead biomarker were entered into model 4. All regression models were evaluated for normality of residuals, linearity, homoscedasticity, independence, and influential points. Data for one subject with a blood lead level of 27.3 μg/dl (approximately 10 standard deviations above the mean) were found to be highly influential in regression diagnostics and were removed from all regression models.
Multiple logistic regression was next used to examine associations of blood lead and tibia lead with hypertension status. Consistent with current clinical guidelines, subjects were considered hypertensive if they were taking antihypertensive medication, if their mean systolic blood pressure exceeded 140 mmHg, or if their mean diastolic blood pressure exceeded 90 mmHg at the clinic visit. When we used the same criteria as were used to develop multiple linear regression models, serum homocysteine joined the base model, whereas cholesterol did not merit inclusion. Socioeconomic status and race/ethnicity were then added to the base model to form models 2, 3, and 4, as described previously.
As a final method to evaluate, and potentially improve, the quality of adjustment that our analyses achieved, we applied propensity scoring. Under certain conditions, propensity scoring estimates the causal effects of exposures on health (29) in the potential-outcomes sense of Rubin (30). It may also identify risk factor groups for which regression extrapolates, rather than adequately adjusts, for covariate-controlled associations of exposures with outcomes (31) (e.g., if affluent Whites have exclusively low tibia lead values). To implement propensity scoring, we regressed blood lead or tibia lead on covariates and used predicted values of those regressions to stratify the primary regressions of blood pressure and hypertension by risk for having elevated lead biomarkers (32). Simple regressions then estimated mean differences (for blood pressure measures) or ln-odds ratios (for hypertension) comparing outcomes by lead levels per propensity strata. The estimates were averaged over strata to obtain an overall effect. Because there were many covariates, we used stepwise regression to build propensity score models and stratified in 20 groups of approximately 50 persons to ensure that potential confounders did not strongly associate with lead levels per group (or “bin”). In sensitivity analyses designed to minimize extrapolation, we compared findings averaging estimates over all 20 bins versus averaging over a subset of bins where there was good overlap in the ranges of the lead distributions. A difference between our analysis and most analyses published previously is that our exposure is continuously, rather than dichotomously, scaled. Recent work indicates that the advantages of propensity scoring are retained in this case (33).
RESULTS
Description of study subjects
The overall mean age of subjects was 59.4 (standard deviation, 5.9) years, and 65.5 percent were women. Mean blood lead and tibia lead levels were 3.5 (standard deviation, 2.3) μg/dl and 18.8 (12.4) μg/g, respectively. Crude blood lead levels did not differ by race/ethnicity, but tibia lead was significantly higher in African Americans, suggesting higher lifetime cumulative lead dose (table 2). We found differences in hypertension prevalence, homocysteine and cholesterol levels, body mass index, and socioeconomic status by race/ethnicity (table 3) but none in the proportion of those taking antihypertensive medications.
Variable | African American (n = 388) | 95% CI‡ | White (n = 531) | 95% CI | p value§ |
|---|---|---|---|---|---|
| Age (years) | 59.7 (6.2) | 59.1, 60.3 | 59.1 (5.7) | 58.6, 59.6 | 0.17 |
| Systolic blood pressure (mmHg) | 137.1 (18.9) | 135.3, 139.0 | 127.0 (17.9) | 125.4, 128.5 | <0.001 |
| Diastolic blood pressure (mmHg) | 74.2 (9.7) | 73.2, 75.2 | 71.6 (9.8) | 70.8, 72.5 | <0.001 |
| No. hypertensive (%) | 275 (70.8) | 248 (46.7) | <0.001 | ||
| No. taking antihypertensive medication if hypertensive (%) | 204 (74.1) | 186 (75.0) | 0.046 | ||
| Tibia lead (μg/g) | 21.5 (12.6) | 20.3, 22.8 | 16.7 (11.9) | 15.7, 17.7 | <0.001 |
| Blood lead (μg/dl) | 3.4 (2.3) | 3.2, 3.7 | 3.5 (2.4) | 3.3, 3.7 | 0.54 |
| Body mass index¶ | 31.7 (7.1) | 31.0, 32.4 | 28.3 (6.1) | 27.7, 28.8 | <0.001 |
| Total cholesterol (mg/dl) | 204.7 (40.8) | 200.6, 208.8 | 209.7 (41.2) | 206.2, 213.2 | 0.06 |
| Homocysteine (μmol/liter) | 10.3 (4.5) | 9.9, 10.8 | 9.6 (3.3) | 9.3, 9.9 | 0.01 |
Of the 964 subjects in this analysis, 26 reported mixed African-American race/ethnicity and 19 reported other races/ethnicities: nine Native Americans, six Asians, two Hawaiians, and two who refused.
Unless otherwise noted, all values in columns 2 and 4 are expressed as mean (standard deviation).
CI, confidence interval.
Two-sample t-test with unequal variances for continuous variables and χ2 for categorical variables.
Weight (kg)/height (m)2.
Variable | African American (n = 388) | 95% CI‡ | White (n = 531) | 95% CI | p value§ |
|---|---|---|---|---|---|
| Age (years) | 59.7 (6.2) | 59.1, 60.3 | 59.1 (5.7) | 58.6, 59.6 | 0.17 |
| Systolic blood pressure (mmHg) | 137.1 (18.9) | 135.3, 139.0 | 127.0 (17.9) | 125.4, 128.5 | <0.001 |
| Diastolic blood pressure (mmHg) | 74.2 (9.7) | 73.2, 75.2 | 71.6 (9.8) | 70.8, 72.5 | <0.001 |
| No. hypertensive (%) | 275 (70.8) | 248 (46.7) | <0.001 | ||
| No. taking antihypertensive medication if hypertensive (%) | 204 (74.1) | 186 (75.0) | 0.046 | ||
| Tibia lead (μg/g) | 21.5 (12.6) | 20.3, 22.8 | 16.7 (11.9) | 15.7, 17.7 | <0.001 |
| Blood lead (μg/dl) | 3.4 (2.3) | 3.2, 3.7 | 3.5 (2.4) | 3.3, 3.7 | 0.54 |
| Body mass index¶ | 31.7 (7.1) | 31.0, 32.4 | 28.3 (6.1) | 27.7, 28.8 | <0.001 |
| Total cholesterol (mg/dl) | 204.7 (40.8) | 200.6, 208.8 | 209.7 (41.2) | 206.2, 213.2 | 0.06 |
| Homocysteine (μmol/liter) | 10.3 (4.5) | 9.9, 10.8 | 9.6 (3.3) | 9.3, 9.9 | 0.01 |
Of the 964 subjects in this analysis, 26 reported mixed African-American race/ethnicity and 19 reported other races/ethnicities: nine Native Americans, six Asians, two Hawaiians, and two who refused.
Unless otherwise noted, all values in columns 2 and 4 are expressed as mean (standard deviation).
CI, confidence interval.
Two-sample t-test with unequal variances for continuous variables and χ2 for categorical variables.
Weight (kg)/height (m)2.
Socioeconomic status of African Americans and Whites in the blood pressure and hypertension analysis,* Baltimore Memory Study, Maryland, 2001–2002
African American (n = 389) | White (n = 534) | |
|---|---|---|
| Education/training (no. (%)) | ||
| <10th grade | 19 (4.9) | 16 (3.0) |
| ≥10th grade | 28 (7.2) | 28 (5.2) |
| High school diploma | 84 (21.6) | 67 (12.6) |
| Trade school with no high school diploma | 17 (4.3) | 6 (1.1) |
| Trade school and high school diploma | 130 (33.5) | 71 (13.3) |
| Some college | 32 (8.2) | 23 (4.3) |
| Baccalaureate degree | 28 (7.2) | 82 (15.4) |
| Some postbaccalaureate education | 18 (4.6) | 74 (13.9) |
| Postbaccalaureate degree | 32 (8.2) | 164 (30.8) |
| Job status (no. (%)) | ||
| Supervisor decides what to do and how to do it | 59 (15.2) | 23 (4.3) |
| Supervisor decides what to do; I decide how to do it | 87 (22.4) | 85 (16.0) |
| Some freedom in deciding what I do and how I do it | 191 (49.2) | 281 (53.0) |
| I am my own boss | 50 (12.8) | 141 (26.6) |
| Household wealth (US dollars) | ||
| Median household income | 34,000 | 60,000 |
| Median household assets | 44,000 | 160,000 |
Of the 964 subjects in this analysis, information for only Whites and African Americans is presented in this table; 26 subjects who reported mixed African-American race/ethnicity and 19 who reported other race/ethnicity are not included.
Systolic and diastolic blood pressure
Blood lead was significantly associated with both systolic blood pressure and diastolic blood pressure in all models, without or with adjustment for socioeconomic status and race/ethnicity (table 4). The adjusted R2 values for these final models ranged from 0.14 to 0.21. In model 4, when we adjusted for race/ethnicity and socioeconomic status, a 1 μg/dl increase in blood lead was associated with a 0.99 mmHg increase in systolic blood pressure (figure 1) and a 0.51 mmHg increase in diastolic blood pressure. Compared with that for model 1, adjustment for socioeconomic status and race/ethnicity had a modest impact on the magnitude of the blood lead associations for both outcomes. Associations of blood lead with systolic and diastolic blood pressure did not differ by race/ethnicity. Tibia lead was not associated with systolic or diastolic blood pressure in any of the models, and addition of tibia lead to the blood lead models did not appreciably alter the blood lead associations.
Associations of blood lead and tibia lead with systolic blood pressure and diastolic blood pressure (coefficients from linear regression*) and hypertension (odds ratios from logistic regression), Baltimore Memory Study, Maryland, 2001–2002
Model 1: Base† | Model 2: Base + socioeconomic status‡ | |||||||||||||||||||||||
|---|---|---|---|---|---|---|---|---|---|---|---|---|---|---|---|---|---|---|---|---|---|---|---|---|
| Blood lead (mmHg per μg/dl) | Tibia lead (mmHg per μg/g) | Blood lead (mmHg per μg/dl) | Tibia lead (mmHg per μg/g) | |||||||||||||||||||||
| β Coefficient | 95% CI§ | p value | β Coefficient | 95% CI | p value | β Coefficient | 95% CI | p value | β Coefficient | 95% CI | p value | |||||||||||||
| Linear regression | ||||||||||||||||||||||||
| Systolic blood pressure | 1.06 | 0.54, 1.59 | <0.01 | 0.07 | −0.03, 0.16 | NS§ | 1.05 | 0.53, 1.58 | <0.01 | 0.05 | −0.05, 0.14 | NS | ||||||||||||
| Diastolic blood pressure | 0.53 | 0.25, 0.81 | <0.01 | 0.03 | −0.02, 0.08 | NS | 0.53 | 0.25, 0.81 | <0.01 | 0.03 | −0.02, 0.08 | NS | ||||||||||||
| OR¶ | 95% CI | p value | OR¶ | 95% CI | p value | OR¶ | 95% CI | p value | OR¶ | 95% CI | p value | |||||||||||||
| Logistic regression | ||||||||||||||||||||||||
| Hypertension# | 1.02 | 0.87, 1.19 | NS | 1.24 | 1.05, 1.47 | 0.01 | 1.03 | 0.88, 1.21 | NS | 1.21 | 1.02, 1.43 | 0.03 | ||||||||||||
| Model 3: Base + race/ethnicity** | Model 4: Base + socioeconomic status + race/ethnicity | |||||||||||||||||||||||
| Blood lead (mmHg per μg/dl) | Tibia lead (mmHg per μg/g) | Blood lead (mmHg per μg/dl) | Tibia lead (mmHg per μg/g) | |||||||||||||||||||||
| β Coefficient | 95% CI | p value | β Coefficient | 95% CI | p value | β Coefficient | 95% CI | p value | β Coefficient | 95% CI | p value | |||||||||||||
| Linear regression | ||||||||||||||||||||||||
| Systolic blood pressure | 0.96 | 0.44, 1.48 | <0.01 | 0.02 | −0.07, 0.11 | NS | 0.99 | 0.47, 1.51 | <0.01 | 0.02 | −0.08, 0.11 | NS | ||||||||||||
| Diastolic blood pressure | 0.51 | 0.23, 0.78 | <0.01 | 0.02 | −0.03, 0.07 | NS | 0.51 | 0.24, 0.79 | <0.01 | 0.02 | −0.03, 0.07 | NS | ||||||||||||
| OR¶ | 95% CI | p value | OR¶ | 95% CI | p value | OR¶ | 95% CI | p value | OR¶ | 95% CI | p value | |||||||||||||
| Logistic regression | ||||||||||||||||||||||||
| Hypertension# | 0.99 | 0.85, 1.17 | NS | 1.17 | 0.98, 1.38 | 0.08 | 1.01 | 0.86, 1.19 | NS | 1.16 | 0.98, 1.37 | 0.09 | ||||||||||||
Tibia lead (μg/g) and blood lead (μg/dl) were included in separate linear regression models. Data for one outlier with a blood lead value of 27.3 μg/dl were removed from the linear regression models.
Base covariates for systolic blood pressure and diastolic blood pressure models included age (years), sex, body mass index (weight (kg)/height (m)2), sodium intake (mg/day), potassium intake (mg/day), total cholesterol (mg/dl), time of day, testing technician, and antihypertensive medication use. Base covariates for the hypertension models included age (years), sex, body mass index (kg/m2), sodium intake (mg/day), potassium intake (mg/day), homocysteine (μmol/liter), time of day, and testing technician.
Socioeconomic status covariates included household wealth (ln-transformed), educational status (nine categories), and occupational status (four categories).
CI, confidence interval; NS, not significant.
OR, odds ratio associated with an interquartile-range increase in blood or tibia lead; the interquartile range for blood lead was 2.5 μg/dl and for tibia lead was 12.9 μg/g.
Defined as systolic blood pressure >140 mmHg or diastolic blood pressure >90 mmHg (mean of three measurements at the study clinic) or current use of antihypertensive medication.
Race/ethnicity compared African Americans, African-American/mixed race, and other race/ethnicity with Whites as the reference group.
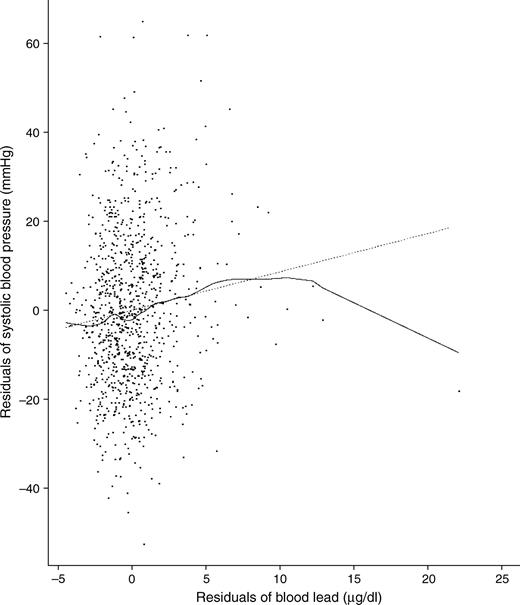
Association (added variable plot) of blood lead with systolic blood pressure from the final model (model 4) showing one influential point with a blood lead level of 27.3 μg/dl that was removed from the final regression models (the beta coefficient for blood lead increased approximately 25% after its removal, but the associations achieved statistical significance in all models with or without this point), Baltimore Memory Study, Maryland, 2001–2002. The dotted line was derived from the final regression model with the influential point included. The solid line is from a locally weighted smoothing method.
Hypertension
In no model was blood lead associated with hypertension status (table 4). In contrast, tibia lead was associated with hypertension status, but the magnitude and statistical significance of this association was influenced by adjustment for race/ethnicity and socioeconomic status. In the base model, tibia lead was a statistically significant predictor of hypertension status; the odds ratio for hypertension associated with an increase in tibia lead from 11.9 μg/g to 24.8 μg/g (the interquartile range for tibia lead) was 1.24. This odds ratio from the base plus socioeconomic status model was 1.21 (lower limit of the confidence interval = 1.02) and from the base plus race/ethnicity model was 1.17 (lower limit of the confidence interval = 0.98). When both race/ethnicity and socioeconomic status were included, the magnitude and statistical significance of this association were reduced further.
Propensity score analysis
For most associations we studied, propensity scoring yielded estimates and inferences very similar to those obtained by using standard regression adjustment, whether averaging estimates over all propensity score strata or over a middle-range subset where overlap in lead distributions was greatest. For diastolic blood pressure, the blood lead association was attenuated by approximately 20 percent when estimated over only the middle-range propensity strata, reflecting a slight tendency for it to weaken with increasing risk of high blood lead levels. Propensity score analyses most strongly illuminated the association between hypertension and tibia lead, so the following paragraphs focus on the results of that analysis.
In developing propensity strata, we found that African-American race/ethnicity was very strongly associated with tibia lead levels. Age, education, job status, and wealth were also significant predictors. Examination of the 20 bins of approximately 50 subjects each revealed that African-American representation in the seven bins with the lowest predicted mean tibia lead levels was less than 4 percent versus 93 percent in the four bins with the highest predicted mean tibia lead levels. The remaining bins had greater than 20 percent representation of both African Americans and Whites.
The mean association between a one interquartile range difference in tibia lead and hypertension over bins corresponded to an odds ratio of 1.13; however, the median odds ratio was 1.24. These estimates were very similar to those obtained from standard regression modeling (table 4) after (model 4) and before (model 1) inclusion of race/ethnicity and socioeconomic status in the models, respectively. In the nine bins with intermediate predicted tibia lead levels as well as mixed race/ethnicity, the mean ln-odds ratio (0.238) was almost double the overall estimate, corresponding to an odds ratio of 1.27. Finally, there was a largely negative (protective) and extremely outlying effect of tibia lead on hypertension in one bin. This bin consisted mainly of subjects who were White, were of high socioeconomic status, and had low tibia lead levels, but there were no other readily identifiable distinguishing features. Its removal yielded an overall odds ratio of 1.21 (95 percent confidence interval: 1.01, 1.46) over the other 19 bins.
DISCUSSION
To our knowledge, this study is the first to compare associations of blood and tibia lead with blood pressure and hypertension in a large, community-based cohort of older adults consisting of large numbers of Whites and African Americans. Multiple important causal factors and potential confounders were assessed and controlled for, utilizing methods such as propensity score analysis that allowed careful consideration of the role of race/ethnicity and socioeconomic status. This procedure allowed us to address concerns that associations observed in prior studies were due to confounding by socioeconomic status (34). The data revealed that recent circulating dose, as estimated by blood lead, was associated with systolic and diastolic blood pressure, while cumulative lead dose, as estimated by tibia lead, was associated with clinically evaluated hypertension status. These contrasting associations suggest that lead likely has a short-latency, acute effect on blood pressure as well as a longer-latency, chronic effect resulting in an increased risk of hypertension.
There were a number of interesting contrasts in associations of blood lead and tibia lead with these outcomes across the various models. Blood lead, but not tibia lead, was associated with systolic and diastolic blood pressure, and this association was independent of tibia lead. Associations were larger with systolic, rather than diastolic, blood pressure (10, 35). In contrast, tibia lead was associated with increased odds of hypertension, but blood lead was not, and its inclusion in the models did not alter tibia lead associations. Mean blood lead levels did not differ by race/ethnicity, and the relations of blood lead with blood pressure were not altered appreciably after inclusion of race/ethnicity and socioeconomic status. In contrast, mean tibia lead levels were significantly higher in African Americans, and, following standard regression adjustment for race/ethnicity, the magnitude and significance of the association of tibia lead with hypertension status decreased.
Beyond standard regression modeling, we evaluated and considered the possible roles of race/ethnicity and socioeconomic status in two ways: in propensity score analysis and in terms of four causal structures (discussed below). Propensity score analysis revealed that standard regression methods may not have provided appropriate race/ethnicity control in estimating the association between tibia lead and hypertension. That is, in providing covariate-controlled estimates of the associations of tibia lead with hypertension, standard logistic regression may have extrapolated, rather than adjusted, the estimates because of lack of representation of African Americans in the seven lowest, and of Whites in the four highest, tibia lead bins. There was also one bin for which the estimate of the tibia lead and hypertension association was enormously outlying. When an overall estimate was derived from either the nine bins with both African Americans and Whites or an analysis in which the outlying value was deleted, it was most similar to our standard regression model 1, which did not control for race/ethnicity and socioeconomic status, revealing a statistically significant association of tibia lead with hypertension. These analyses involve considerable exploration but are supportive of a positive association between tibia lead and hypertension independent of race/ethnicity and socioeconomic status. Without this analysis, we would have substantially less confidence in our ability to argue that tibia lead is independently associated with hypertension.
We also considered four causal structures (directed acyclic graphs, figure 2) that illustrate potential problems in causal inference that may arise through misspecification. Model A (naïve) assumes a direct association between lead and hypertension, independent of race/ethnicity and socioeconomic status. Our regression model 4 estimates the magnitude of such a direct effect, if any. However, at least three causal structures are also plausible (models B to D, figure 2) and explain how focus on a direct effect of tibia lead, after adjustment for race/ethnicity and socioeconomic status, could lead to underestimation of the overall effect of lead exposure on hypertension. The first is represented by model B (reciprocal effects) and suggests that socioeconomic status can both influence and be influenced by cumulative lead dose, a role of socioeconomic status that is especially complex. Lower educational level, income, and occupational status are associated with elevated risk of hypertension (36–39) as well as greater exposure to lead (40). In addition, greater exposure to environmental lead early during brain development can dampen educational achievement, resulting in lowered socioeconomic status in adulthood (41, 42). Under this structure, “controlling” for socioeconomic status would lead to underestimates of the total tibia lead effect as partially mediated through lowered socioeconomic status.
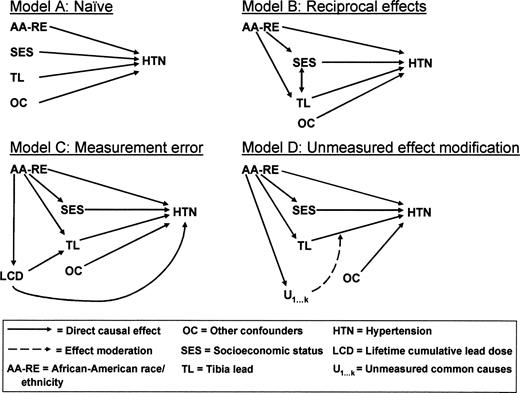
Directed acyclic graphs depicting four possible causal structures for relations of lead, blood pressure or hypertension, race/ethnicity, and socioeconomic status. Refer to the Discussion section of the text for further information.
A third causal structure (model C, figure 2) addresses whether current tibia lead level is an adequate surrogate for cumulative lead dose when the majority of the lifetime dose was received decades ago. It is known that ambient exposures to lead in the air and soil were much higher prior to 1975, and clearance of lead from bone could differ by race/ethnicity because race/ethnicity is a known risk factor for bone mineral loss with aging (43). Remote exposures, bone demineralization, and individual variation in rates of clearance of lead from bone could all result in measurement error in current tibia lead with respect to estimating lifetime dose. To the extent that race/ethnicity may be a better surrogate for underlying lifetime cumulative lead dose than current tibia lead measurement—and a large body of literature documents that African Americans have received higher lead doses, as measured by blood lead surveys and incidence of lead poisoning, for decades in the United States—we would perceive an underestimation of the association of tibia lead with hypertension when race/ethnicity is included in these models. To the extent that measurement errors are differential by race/ethnicity, the problem could be exacerbated. A final causal structure (model D, figure 2) indicates that there are likely unmeasured common causes causally related to race/ethnicity that modify the relation of tibia lead with hypertension status. Such unmeasured factors could include other environmental exposures, diet and nutrition, cardiovascular health, vascular reactivity, and stress biology, whose cumulative effects swamp any incremental effect of lead exposure on health that may exist.
Associations of bone and blood lead with blood pressure and/or hypertension have not been consistent in prior studies. In cross-sectional analysis in a study of 543 former organolead workers (averaging 18 years since last occupational exposure) (2, 5), blood lead was associated with systolic and diastolic blood pressure and hypertension status (the latter in only those subjects <58 years of age), but tibia lead was not associated with any of these measures. In longitudinal analysis in this same population, blood lead and tibia lead were both associated with increases in systolic, but not diastolic, blood pressure over time (5). Consistent with the findings from the current study, tibia lead was associated with hypertension status in a cross-sectional analysis of 798 Korean lead workers and in a cohort of 590 veterans (4, 7). In these two studies, mean tibia lead levels were the highest among the studies that compared blood lead and tibia lead in relation to blood pressure. The magnitude of the associations was similar to that reported in the current study. This body of evidence is generally consistent in demonstrating an association of tibia lead with hypertension in studies of different designs and populations.
Among the four published studies in populations without occupational lead exposure, trabecular bone lead has been most consistently associated with blood pressure outcomes (6, 8, 9). Trabecular bone lead was associated with hypertension in older men (6), women in the Nurses' Health Study (8), and younger pregnant women (9). Notably, Cheng et al. (6) studied incident hypertension, strengthening the quality of the causal inference; neither blood lead nor tibia lead was associated with hypertension. Among the pregnant women, the association of calcaneus lead was present only in the third trimester; blood, tibia, and calcaneus lead were not associated with hypertension status postpartum (9).
Some investigators (44, 45), but not others (46, 47), have reported that African Americans may be more susceptible to the effect of lead on blood pressure. To our knowledge, ours is the first study to assess effect modification of the lead and blood pressure relation by race/ethnicity in a community sample with both bone and blood lead biomarkers; we found no evidence for such effect modification.
Our study had several limitations. Given its cross-sectional design, we cannot demonstrate that lead exposure preceded blood pressure and hypertension outcomes, nor can we distinguish the causal mechanisms we discussed. Under models B and C, none of our analyses estimate causal effects of lead in the potential outcomes sense. However, tibia lead levels reflect cumulative dose rather than a simple current dose estimate. Finally, the age of our study subjects was 50–70 years, limiting inferences in younger or older subjects.
In this community-based cohort of randomly sampled urban adults, blood lead was associated with systolic and diastolic blood pressure, and tibia lead was associated with hypertension. The average blood levels are similar to those documented in the general US population, and our average tibia lead levels would also be expected to represent average population values. These contrasting associations suggest that lead has an acute effect on blood pressure as a function of recent dose and a chronic effect on hypertension risk as a function of cumulative dose.
This work was supported by National Institutes of Health grant AG 19604.
Conflict of interest: none declared.
References
Glenn BS, Stewart WF, Schwartz BS, et al. Relation of alleles of the sodium-potassium adenosine triphosphatase α2 gene with blood pressure and lead exposure.
Schwartz BS, Stewart WF. Different associations of blood lead, meso 2,3-dimercaptosuccinic acid (DMSA)-chelatable lead, and tibial lead levels with blood pressure in 543 former organolead manufacturing workers.
Schwartz BS, Stewart WF, Bolla KI, et al. Past adult lead exposure is associated with longitudinal decline in cognitive function.
Lee BK, Lee GS, Stewart WF, et al. Associations of blood pressure and hypertension with lead dose measures and polymorphisms in the vitamin D receptor and delta-aminolevulinic acid dehydratase genes.
Glenn BS, Stewart WF, Links JM, et al. The longitudinal association of lead with blood pressure.
Cheng Y, Schwartz J, Sparrow D, et al. Bone lead and blood lead levels in relation to baseline blood pressure and the prospective development of hypertension: the Normative Aging Study.
Hu H, Aro A, Payton M, et al. The relationship of bone and blood lead to hypertension. The Normative Aging Study.
Korrick SA, Hunter DJ, Rotnitzky A, et al. Lead and hypertension in a sample of middle-aged women.
Rothenberg SJ, Kondrashov V, Manalo M, et al. Increases in hypertension and blood pressure during pregnancy with increased bone lead levels.
Nawrot TS, Thijs L, Den Hond EM, et al. An epidemiological re-appraisal of the association between blood pressure and blood lead: a meta-analysis.
Kromhout D, Wibowo AA, Herber RF, et al. Trace metals and coronary heart disease risk indicators in 152 elderly men (the Zutphen Study).
de Kort WL, Verschoor MA, Wibowo AA, et al. Occupational exposure to lead and blood pressure: a study in 105 workers.
Menditto A, Morisi G, Spagnolo A, et al. Association of blood lead to blood pressure in men aged 55 to 75 years: effect of selected social and biochemical confounders. NFR Study Group.
Morris C, McCarron DA, Bennett WM. Low-level lead exposure, blood pressure, and calcium metabolism.
Orssaud G, Claude JR, Moreau T, et al. Blood lead concentration and blood pressure. (Letter).
Weiss ST, Munoz A, Stein A, et al. The relationship of blood lead to blood pressure in a longitudinal study of working men.
Seventh Report of the Joint National Committee on the Prevention, Detection, Evaluation, and Treatment of High Blood Pressure. Bethesda, MD: National Heart, Lung, and Blood Institute, US Department of Health and Human Services,
Schwartz BS, Glass TA, Bolla KI, et al. Disparities in cognitive functioning by race/ethnicity in the Baltimore Memory Study.
Gerhardsson L, Attewell R, Chettle DR, et al. In vivo measurements of lead in bone in long-term exposed lead smelter workers.
Recommendations for routine blood pressure measurement by indirect cuff sphygmomanometry. American Society of Hypertension.
Liberatos P, Link BG, Kelsey JL. The measurement of social class in epidemiology.
Juster FT, Smith JP, Stafford F. The measurement and structure of household wealth.
Bannon DI, Chisolm JJ. Anodic stripping voltammetry compared with graphite furnace atomic absorption spectrophotometry for blood lead analysis.
Todd AC, Parsons PJ, Carroll S, et al. Measurements of lead in human tibiae. A comparison between K-shell x-ray fluorescence and electrothermal atomic absorption spectrometry.
Todd AC, McNeill FE. In vivo measurements of lead in bone using a 109Cd “spot” source. In: Ellis KJ, Eastman JD, eds. Human body composition studies. New York, NY: Plenum Press,
Kim R, Aro A, Rotnitzky A, et al. K x-ray fluorescence measurements of bone lead concentration: the analysis of low-level data.
Schafer JH, Glass TA, Bolla KI, et al. Homocysteine and cognitive function in a population-based study of older adults.
Weil M, Bressler J, Parsons P, et al. Blood mercury levels and neurobehavioral function.
Rosenbaum PR, Rubin DB. The central role of the propensity score in observational studies for causal effects.
Rubin DB. Estimating causal effects of treatments in randomized and nonrandomized studies.
Rubin DB. Using propensity scores to help design observational studies: application to the tobacco litigation.
Rosenbaum PR, Rubin DB. Reducing bias in observational studies using subclassification on the propensity score.
Imai K, van Dyk DA. Causal inference with general treatment regimes: generalizing the propensity score.
Hertz-Picciotto I, Croft J. Review of the relation between blood lead and blood pressure.
Albright CL, Winkleby MA, Ragland DR, et al. Job strain and prevalence of hypertension in a biracial population of urban bus drivers.
Dressler WW. Social class, skin color, and arterial blood pressure in two societies.
Schnall PL, Schwartz JE, Landsbergis PA, et al. Relation between job strain, alcohol, and ambulatory blood pressure.
Winkleby MA, Fortmann SP, Barrett DC. Social class disparities in risk factors for disease: eight-year prevalence patterns by level of education.
Elreedy S, Krieger N, Ryan PB, et al. Relations between individual and neighborhood-based measures of socioeconomic position and bone lead concentrations among community-exposed men: the Normative Aging Study.
Coplan J. Lead levels and children's psychologic performance. (Letter).
Needleman HL, Schell A, Bellinger D, et al. The long-term effects of exposure to low doses of lead in childhood. An 11-year follow-up report.
Bohannon AD. Osteoporosis and African American women.
Vupputuri S, He J, Muntner P, et al. Blood lead level is associated with elevated blood pressure in blacks.
Sharp DS, Benowitz NL, Osterloh JD, et al. Influence of race, tobacco use, and caffeine use on the relation between blood pressure and blood lead concentration.
Nash D, Magder L, Lustberg M, et al. Blood lead, blood pressure, and hypertension in perimenopausal and postmenopausal women.

