


Abstract
• Background and Aims Previous studies have shown that transgenic rice plants overexpressing YK1, which possesses dihydroflavonol-4-reductase (DFR) activity, showed biotic and abiotic stress tolerance. High throughput profiles of metabolites have also been shown in such transgenic plants by Fourier transform ion cyclotron mass spectrometry. In this study, capillary electrophoresis mass spectrometry analysis (CE/MS) was employed to identify precise metabolites such as organic acids, amino acids and sugars.
• Methods Using CE/MS, we analysed several metabolites of glycolysis, the tricarboxylic acid (TCA) cycle and the pentose phosphate pathway. In addition, the concentrations of sugars and ion were quantified.
• Key Results In YK1 (DFR)-overexpressing plants, the concentrations of cis-aconitate, isocitrate and 2-oxoglutarate were higher in leaves, whereas those of fructose-1,6-bisphosphate and glyceraldehyde-3-phosphate were lower in roots. In seeds, the amounts of free amino acids and metals were altered, whereas sugars in seeds were kept constant. In YK1 calli, an approx. 3-fold increase in glutathione was observed, whereas the activities of glutathione peroxidase and glutathione reductase were concomitantly increased.
• Conclusions The overexpression of YK1 (DFR) was associated with slight changes in the amounts of several metabolites analysed in whole plants, whilst glutathione derivatives were substantially increased in suspension-cultured cells.
INTRODUCTION
Metabolome analysis (Fiehn et al., 2000) has emerged in recent years as a promising technology to identify metabolic networks in living cells (Oliver et al., 2002). This approach can reveal metabolic profiles derived from information on various metabolites such as inorganic ions, organic ions, sugars, flavonoids, lipids and amino acids, which may have wide application in the field of metabolic engineering of higher plants (Choi et al., 2004; Trethewey, 2004; Yanagisawa et al., 2004). Metabolome analysis in plants has been performed using different types of mass spectrometers. Non-target metabolome analysis of strawberry using a Fourier transform ion cyclotron mass spectrometer (FT-MS) allowed the detection of thousands of metabolites (Aharoni et al., 2002). Mungur et al. (2005) showed alterations of metabolites such as amino acids, sugars, lipids, nucleic acids and other organic acids in transgenic tobacco plants exhibiting higher glutamate dehydrogenase activity. Furthermore, fingerprints obtained from FT-MS analysis provided a tremendous amount of information by matching gene expression profiles (Hirai et al., 2004). Nuclear magnetic resonance (NMR) spectroscopy was used to reveal the composition of metabolites in Arabidopsis (Ward et al., 2003). Gas chromatography/mass spectrometry (GC/MS) was used for analysis of leaves of Arabidopsis (Fiehn et al., 2000; Rohloff and Bones, 2005), squash (Fiehn, 2003), Acacia (Adams et al., 1999) and potato tuber (Roessner et al., 2000). Such analyses provided evidence of effective quantification of plant metabolites. Fiehn et al. (2000) quantified 326 metabolites in Arabidopsis leaves by GC/MS, where changes of metabolite profiling were caused by genetic alterations such as mutation (Dörmann et al., 1995).
In recent years, capillary electrophoresis electrospray ionization mass spectrometry (CE/MS) has opened a way to detect charged compounds such as carboxylic acids, amino acids and nucleotides (Soga et al., 2000, 2002a, b). Sato et al. (2004) quantified 88 primary metabolites in rice leaves by CE/MS, where the time-dependent alterations of metabolites were noted. Additionally, CE/MS revealed that the amount of metabolites engaged in the tricarboxylic acid (TCA) cycle was altered in transgenic rice expressing the antisense methylmalonate-semialdehyde dehydrogenase gene (Tanaka et al., 2005).
Previously, it was demonstrated that rice overexpressing the YK1gene, the homologue of the HC-toxin reductase (HCTR) gene, in rice showed enhancement of tolerance to ultraviolet irradiation, salt, submergence, hydrogen peroxide (H2O2) and blast disease (Uchimiya et al., 2002). Besides HCTR activity, YK1 also possessed dihydroflavonol-4-reductase (DFR; EC 1·1·1·219) activity (Hayashi et al., 2005). Furthermore, the overexpression of YK1 induced the activation of enzymes in the NAD synthetic pathway, which resulted in an increase in the amounts of NAD(P)(H). These results implied that the coupled increase of DFR activity and amounts of NAD(P)(H) may contribute to biotic and abiotic stress tolerance. Furthermore, non-target metabolite analysis of YK1 plants was investigated by FT-MS (Takahashi et al., 2005).
Rice is an important cereal for the human diet. Although a number of transgenic rice plants have been generated so far, no reports on systematic comparison of major metabolites have been published. Thus a quantitative comparison is presented of the concentrations of known metabolites, sugars and ions in hygromycin-resistant transgenic rice overexpressing the DFR gene, and transgenic rice with the hygromycin-resistant gene alone.
MATERIALS AND METHODS
Materials
Transgenic rice plants (Oryza sativa L. ‘Nipponbare’) expressing the YK1 gene under the control of the maize ubiquitous promoter were used (Uchimiya et al., 2002). As a control, the same rice variety containing the hygromycin-resistant gene (vector alone) was used. Plants were grown on hormone-free Murashige–Skoog (MS) medium (Murashige and Skoog, 1962) containing 3 % (w/v) sucrose at 27 °C under constant light of 60 µmol photons m−2 s−1. Calli derived from the control and transgenic plants were cultured on MS medium containing 3 % (w/v) sucrose, 1 mg L−1 2,4-dichlorophenoxyacetic acid, vitamin B1 and 50 µg mL−1 hygromycin at 27 °C in the dark. Seven-day-old plants, and calli cultured for 5 d were thoroughly washed with Milli-Q water, frozen in liquid nitrogen and stored at −80 °C. Mature seeds were collected from plants grown in soil under greenhouse conditions.
Measurement of anthocyanin content
Measurement of anthocyanin was performed as described by Suneetha et al. (2002). Plant samples were extracted with acidified methanol (1 % HCl, v/v) for 24 h in darkness at 4 °C. The cuvette was placed in a spectrophotometer for measurement at 530 nm (anthocyanin and chlorophyll) and 657 nm (chlorophyll). The content of anthocyanin, A530nm − 0·25A657nm, was expressed as anthocyanin per gram fresh weight (g f. wt).
CE/MS
The amounts of metabolites were quantified by the method described by Sato et al. (2004) with minor modification. Frozen samples were ground in liquid nitrogen, followed by addition of ice-cooled methanol to deactivate the enzymes. After the addition of an internal standard [piperazine-N,N′-bis(2-ethanesulfonate) (PIPES) and methionine sulfone (MeS)] for the correct quantification, the sample solution was centrifuged. The supernatant was transferred to a 5 kDa cut-off filter (Millipore, Bedford, MA, USA) and then centrifuged at 15 000 rpm for 30 min and the filtrate was analysed by CE/MS. The method used for CE/MS was based on that described by Soga et al. (2002a). Mass spectra were acquired using the CE/MS system controlled by ChemStation software (Agilent Technologies, Waldbronn, Germany). For the determination of anionic compounds, separations were carried out at −20 kV on a polyethylene glycol-coated capillary (DB-WAX, J&W Scientific, Folsom, CA, USA, 100 cm × 50 µm i.d.) using a running buffer containing 20 mm ammonium acetate (pH 6·8) at 20 °C. The sheath liquid was composed of 2 mm ammonium acetate in 50 % (v/v) methanol and was applied around the capillary at 6 μL min−1 using an Agilent 1100 series isocratic HPLC pump equipped with a 1 : 100 splitter for the stabilization of MS analysis. When amino acids were analysed, the samples were injected into the uncoated fused silica capillary (70 cm × 50 µm i.d.) with 1 m formic acid (pH 1·9) as running buffer and 0·1 % formic acid in 50 % (v/v) methanol as a sheath liquid. The applied voltage was set at 20 V. MS analysis for anionic compounds was carried out in negative ion mode, and amino acids were determined in positive ion mode. The capillary voltage was set at ±3500 V and the drying nitrogen gas (adjusted at 320 °C) flow was maintained at 8 L min−1. The accuracy was determined by the measurement of known concentrations of selected compounds.
Reference reagents
Fructose-1,6-bisphosphate (FBP), glyceraldehyde-3-phosphate (GA3P), 3-phosphoglycerate (3PGA), pyruvate, citrate, cis-aconitate, isocitrate, 2-oxoglutarate, succinate, fumarate, malate, glucose-6-phosphate (G6P), 6-phosphogluconate (6PG), ribose-5-phosphate (R5P), nicotinate and PIPES were purchased from Nacalai Tesque Inc. (Kyoto, Japan). MeS was purchased from Sigma-Aldrich Japan (Tokyo, Japan). All chemicals used were analytical grade.
Quantification of sugar contents
Purification of starch from rice seeds was based on the method of Echt and Schwarts (1981). Total sugars and amylose were quantified as described by Itoh et al. (2004). A 10 mg aliquot of powdered seed was mixed with a solution containing 10 % (v/v) ethanol and 400 mm NaOH. After boiling at 100 °C for 10 min, the solution was centrifuged at 15 000 rpm for 5 min. The supernatant was collected and Milli-Q water was added. After the adjustment to pH 6·0, the total sugar content was determined by the phenol sulfate method (Dubois et al., 1956). For determination of amylose contents, the starch solution was diluted to 0·05 % (w/v) with Milli-Q water. After the addition of iodide solution [final 0·003 % (w/v) iodine and 0·03 % (w/v) potassium iodide] to the starch solution, absorbance was measured at 620 nm.
Analysis of metals
Quantification of the metal concentration was according to Goto et al. (1999). Leaves and roots from 7-day-old seedlings were harvested and freeze-dried. Seeds were dried at 65 °C. Samples were ground and wet-ashed with 2 ml of HNO3 and H2O2 overnight at 110 °C. These samples were then dissolved in 15 ml of 1 n HCl and the concentrations of Mg, P, K, Ca, Mn and Fe were measured using inductively coupled plasma atomic emission spectrometry (ICP; type P-4000, Hitachi, Japan).
Preparation of enzyme extract
A 300 mg aliquot of frozen calli was homogenized with liquid nitrogen and mixed with 3 ml of extraction buffer [50 mm potassium phosphate, pH 7·0, 10 % (w/v) sucrose, 1 mm dithiothreitol (DTT) and 5 mm sodium ascorbate). The homogenate was then centrifuged at 15 000 rpm for 10 min, and the resulting supernatant was used for enzyme assay.
Enzyme assay
Enzymatic activities were measured spectrophotometrically using Ultrospec 3000 (Pharmacia Biotech). The assays for catalase (CAT; EC 1·11·1·6), ascorbate peroxidase (APX; EC 1·11·1·11) and glutathione reductase (GR; EC 1·8·1·7) were conducted according to Saruyama and Tanida (1995) with a minor modification. CAT activity was quantified by the loss of H2O2 as measured at 240 nm. The reaction was started by the addition of 500 mm H2O2 to the reaction mixture containing 50 mm potassium phosphate, pH 7·0, and enzyme extract. The activity was calculated from decomposition of µmol H2O2 min−1 mg protein−1. APX activity was measured by monitoring the decrease of absorbance at 290 nm. The reaction mixture was composed of 50 mm potassium phosphate, pH 7·0, 5 μm ascorbate, and enzyme extract, and the reaction was started by the addition of 10 mm H2O2. The activity was calculated from oxidation of nmol ascorbate min−1 mg protein−1. Glutathione peroxidase (GPX; EC 1·11·1·9) activity was measured by following the rate of NADPH oxidation at 340 nm using the procedure previously described (Mittova et al., 2003). The reaction mixture contained 50 mm potassium phosphate, 1 mm EDTA, 0·2 mm NADPH, 1 mm glutathione (GSH), 0·1 mm H2O2, 2 U of GR and enzyme extract at pH 7·0. GR activity was followed by the decrease of absorbance at 340 nm, resulting from the NADPH oxidation. The reaction mixture was composed of 50 mm potassium phosphate, 0·8 mm EDTA, 0·5 mm GSSG (oxidized glutathione), 0·2 mm NADPH and enzyme extract at pH 7·0. GPX and GR activities were calculated from oxidation of nmol NADPH min−1 mg protein−1.
Protein concentration was measured by the method of Bradford (1976) with a protein assay kit (Bio-Rad Laboratories, Hercules, CA, USA).
RESULTS AND DISCUSSION
In this study, quantification of metabolites in transgenic YK1 rice plants and calli (two independent transgenic lines: L-1 and L-2; Uchimiya et al., 2002) was performed. Previously, it was shown that YK1 had DFR activity and that overexpression of YK1 enhanced tolerance to H2O2, submergence and infection by Magnaporthe grisea (Hayashi et al., 2005). Since DFR is a key enzyme of anthocyanin synthesis, the amounts of anthocyanin in transgenic control plants with vector alone and YK1 rice plants were compared. The amounts of total anthocyanin in leaves (A530nm − 0·25A657nm, g f. wt) were 0·10 (control), 0·17 (L-1) and 0·19 (L-2), respectively. Furthermore, the purified YK1 protein could convert taxifolin to leucocyanidin, which is one of the precursors to anthocyanin. Therefore, increased levels of precursor might enhance anthocyanin biosynthesis, and accumulated anthocyanin served as an antioxidant in YK1 leaves.
Recently, metabolome analysis by CE/MS was established to identify the charged metabolites of Bacillus subtilis cells (Soga et al., 2002a, b) and rice (Sato et al., 2004). Here we carried out a similar analysis in transgenic YK1 rice plants by CE/MS and compared the amounts of metabolites in plants and calli of control and YK1 rice. Because NAD(P)H synthesis was upregulated in transgenic YK1 rice plants (Hayashi et al., 2005), metabolites involved in glycolysis, the TCA cycle, the pentose phosphate pathway and their neighbouring pathways were analysed. The detected metabolites were identified by comparing their m/z values and migration times with those of various standard metabolites. The amount of each metabolite was calculated from peak areas of the corresponding standards.
In the leaves, the amounts of TCA metabolites such as cis-aconitate, isocitrate and 2-oxoglutarate were higher in both YK1 lines than in the control. In the roots of both YK1 transgenic plants, the amounts of FBP, GA3P and isocitrate were lower (approx. 50 %) than in the control. Furthermore, TCA metabolites such as cis-aconitate, isocitrate and 2-oxoglutarate were lower than in the control, with the exception of citrate in the roots of both transgenic YK1 lines (Table 1).
Comparison of organic acids in leaves and roots between control and YK1 rice
| Concentration (nmol g−1 f. wt) | ||||||
|---|---|---|---|---|---|---|
| Metabolites | Control (%) | L-1 (%) | L-2 (%) | |||
| Leaf | ||||||
| FBP | 21·1 ± 1·0 (100) | 20·1 ± 1·1 (95) | 24·3 ± 4·8 (116) | |||
| GA3P | 98·5 ± 0·9 (100) | 92·7 ± 6·7 (94) | 82·5 ± 4·0 (84) | |||
| 3PGA | 1222·3 ± 72·2 (100) | 1101·2 ± 16·6 (90) | 1165·7 ± 95·5 (95) | |||
| Citrate | 855·5 ± 118·8 (100) | 799·6 ± 69·6 (93) | 762·8 ± 143·4 (89) | |||
| cis-Aconitate | 18·3 ± 2·3 (100) | 27·2 ± 1·7 (149) | 27·8 ± 0·5 (152) | |||
| Isocitrate | 101·4 ± 8·8 (100) | 147·1 ± 14·4 (145) | 141·2 ± 22·9 (139) | |||
| 2-Oxoglutarate | 100·5 ± 4·4 (100) | 127·5 ± 10·0 (127) | 134·0 ± 17·3 (133) | |||
| Root | ||||||
| FBP | 143·2 ± 19·4 (100) | 91·7 ± 10·1 (64) | 59·9 ± 24·4 (42) | |||
| GA3P | 340·2 ± 47·0 (100) | 171·2 ± 9·7 (50) | 138·7 ± 13·0 (41) | |||
| 3PGA | ND – | ND – | ND – | |||
| Citrate | 163·1 ± 30·4 (100) | 218·4 ± 70·7 (134) | 226·1 ± 64·3 (139) | |||
| cis-Aconitate | 2·9 ± 0·2 (100) | 2·3 ± 0·4 (82) | 2·3 ± 0·5 (81) | |||
| Isocitrate | 14·1 ± 0·5 (100) | 10·2 ± 1·7 (72) | 8·9 ± 0·9 (63) | |||
| 2-Oxoglutarate | 41·1 ± 4·0 (100) | 39·7 ± 3·3 (96) | 40·4 ± 6·5 (98) | |||
Leaves and roots of 7-day-old plants were used.
Control, transgenic rice possessing vector alone; L-1 and L-2, transgenic rice possessing the YK1 gene.
Data are the means ± s.e. of three independent experiments.
Table 2 shows the composition of free amino acids (FAAs) in the leaves and roots of the control plants and both transgenic rice plants. In the leaves, there were no significant differences between the samples, except for threonine. In the roots, arginine tended to be lower in YK1 lines compared with the control. FAAs amounts were similar to those reported by Chen et al. (2004). FAAs and sugars are essential compounds not only for plant metabolism but also for human nutrition. Since rice is an important staple food in the world, measurement of these metabolites in seeds is important for nutritional evaluation. Therefore, the amounts of FAAs and sugars in seeds of transgenic rice were investigated. There were no significant differences in the total amount of FAAs between control and transgenic YK1 seeds (Table 3). However, in YK1 (L-2), the concentrations of asparagine and tryptophan were 64 and 187 % those of the control, respectively. Further work is needed to elucidate the reason for this difference. The concentrations of total sugars and starch were consistent among different lines. Likewise, there were no differences in amylose contents (Fig. 1). We also compared amounts of minerals in leaves, roots and seeds (Table 4). In YK1 plants, Mg and Fe contents were increased in leaves, while Ca, Mn and Fe contents were decreased in roots. However, the amounts of mineral, except for Ca, were consistently maintained in YK1 seeds.
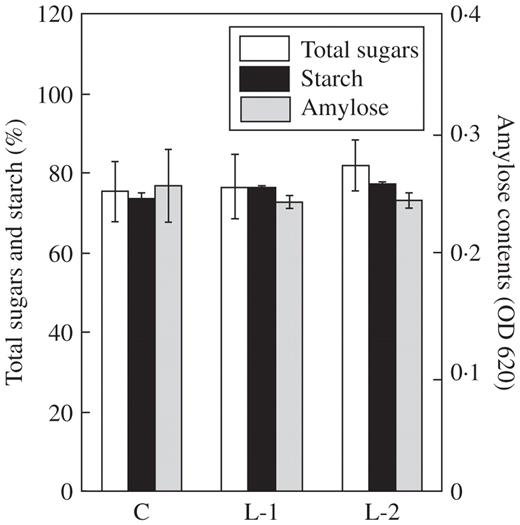
Analysis of sugar contents in seeds of control (C) and YK1 (L-1 and L-2) plants. Starch purified from seeds was dissolved in 10 % (v/v) ethanol and 400 mm NaOH. The total sugar concentration in the solution was measured by the phenol sulfate method and the amylose content was analysed using an iodine colorimetric procedure. Total sugars and starch contents are expressed relative to the weight of seeds. Amylose contents represent the absorbance value at 620 nm. Data are the mean ± s.e. of three independent experiments.
Comparison of the amounts of free amino acids in leaves and roots
| Concentration (nmol g−1 f. wt) | ||||||
|---|---|---|---|---|---|---|
| Metabolites | Control (%) | L-1 (%) | L-2 (%) | |||
| Leaf | ||||||
| Arginine | 67·5 ± 4·9 (100) | 67·2 ± 6·9 (100) | 69·9 ± 7·8 (104) | |||
| Asparagine | 3050·6 ± 29·2 (100) | 2723·2 ± 380·3 (89) | 2997·2 ± 251·6 (98) | |||
| Aspartate | 1601·2 ± 64·4 (100) | 1695·5 ± 91·1 (106) | 1739·5 ± 72·4 (109) | |||
| Glutamine | 5050·9 ± 1414·4 (100) | 5233·5 ± 788·4 (104) | 5368·3 ± 706·7 (106) | |||
| Glutamate | 2965·8 ± 153·1 (100) | 3179·6 ± 36·4 (107) | 3093·0 ± 202·0 (104) | |||
| Threonine | 287·1 ± 4·9 (100) | 335·8 ± 4·9 (117) | 345·4 ± 22·3 (120) | |||
| Tryptophan | 24·1 ± 3·6 (100) | 24·4 ± 5·1 (101) | 24·6 ± 2·4 (102) | |||
| Total | 16 035·6 ± 907·1 (100) | 16 238·3 ± 902·1 (101) | 17 058·2 ± 792·4 (106) | |||
| Root | ||||||
| Arginine | 198·3 ± 60·7 (100) | 132·0 ± 6·2 (67) | 111·2 ± 13·7 (56) | |||
| Asparagine | 1025·2 ± 106·8 (100) | 1068·5 ± 239·0 (104) | 1137·0 ± 159·9 (111) | |||
| Aspartate | 452·5 ± 31·0 (100) | 468·4 ± 193·0 (104) | 507·7 ± 81·0 (112) | |||
| Glutamine | 3035·6 ± 296·6 (100) | 2765·5 ± 518·8 (91) | 3052·5 ± 381·5 (101) | |||
| Glutamate | 690·7 ± 47·3 (100) | 705·6 ± 245·1 (102) | 851·6 ± 97·8 (123) | |||
| Threonine | 120·9 ± 14·3 (100) | 129·3 ± 27·6 (107) | 121·4 ± 7·6 (100) | |||
| Tryptophan | 31·9 ± 5·1 (100) | 36·0 ± 5·4 (113) | 42·3 ± 2·8 (133) | |||
| Total | 8121·0 ± 501·1 (100) | 7850·7 ± 1002·0 (97) | 8041·3 ± 893·1 (99) | |||
Leaves and roots of 7-day-old plants were used.
Control, transgenic rice possessing vector alone; L-1 and L-2, transgenic rice possessing the YK1 gene.
Data are the means ± s.e. of three independent experiments.
Compositions of free amino acids in seeds of control and YK1 plants
| Concentration (nmol/5 seeds) | |||||
|---|---|---|---|---|---|
| Metabolites | Control (%) | L-1 (%) | L-2 (%) | ||
| Alanine | 19·1 ± 1·2 (100) | 19·1 ± 0·9 (100) | 17·3 ± 1·6 (91) | ||
| Arginine | 14·7 ± 1·2 (100) | 11·6 ± 0·5 (79) | 13·2 ± 0·9 (91) | ||
| Asparagine | 107·5 ± 4·0 (100) | 103·7 ± 6·3 (97) | 69·1 ± 3·0 (64) | ||
| Aspartate | 64·1 ± 4·2 (100) | 63·8 ± 5·9 (100) | 66·2 ± 2·2 (103) | ||
| Glutamine | 3·9 ± 0·2 (100) | 3·3 ± 0·2 (85) | 2·9 ± 0·4 (74) | ||
| Glutamate | 118·2 ± 3·7 (100) | 119·1 ± 5·3 (101) | 110·7 ± 6·3 (94) | ||
| Glycine | 6·4 ± 0·2 (100) | 5·8 ± 0·0 (92) | 6·3 ± 0·4 (100) | ||
| Histidine | 4·5 ± 0·1 (100) | 3·6 ± 0·1 (81) | 4·9 ± 0·1 (110) | ||
| Lysine | 2·8 ± 0·1 (100) | 2·6 ± 0·0 (91) | 2·7 ± 0·2 (95) | ||
| Leucine | 1·7 ± 0·0 (100) | 1·5 ± 0·1 (89) | 1·5 ± 0·0 (87) | ||
| Methionine | 3·6 ± 0·3 (100) | 3·6 ± 0·1 (102) | 3·0 ± 0·1 (83) | ||
| Phenylalanine | 1·1 ± 0·1 (100) | 0·9 ± 0·1 (81) | 1·2 ± 0·1 (108) | ||
| Proline | 18·8 ± 0·3 (100) | 13·9 ± 0·2 (74) | 23·7 ± 1·0 (126) | ||
| Serine | 20·6 ± 0·5 (100) | 18·4 ± 0·9 (89) | 16·9 ± 0·8 (82) | ||
| Threonine | 5·0 ± 0·1 (100) | 4·5 ± 0·3 (89) | 5·6 ± 0·4 (110) | ||
| Tryptophan | 5·7 ± 0·2 (100) | 4·9 ± 0·2 (85) | 10·7 ± 0·7 (187) | ||
| Tyrosine | 4·1 ± 0·2 (100) | 3·3 ± 0·1 (81) | 4·2 ± 0·3 (102) | ||
| Valine | 25·5 ± 1·0 (100) | 24·9 ± 0·6 (98) | 18·8 ± 0·6 (74) | ||
| Total | 427·0 ± 4·9 (100) | 408·5 ± 14·7 (96) | 378·6 ± 12·7 (89) | ||
Control, transgenic rice possessing vector alone; L-1 and L-2, transgenic rice possessing the YK1 gene.
Data are the means ± s.e. of three independent experiments.
Metal concentration in leaf, root and seed
| Amount (µg g−1 d. wt) | ||||||
|---|---|---|---|---|---|---|
| Metals | Leaf (%) | Root (%) | Seed (%) | |||
| K | Control | 44 491·0 (100) | 51 974·1 (100) | 3150·8 (100) | ||
| L-1 | 44 125·2 (99) | 56 618·5 (109) | 3224·8 (102) | |||
| L-2 | 42 240·1 (95) | 54 336·7 (105) | 3345·8 (106) | |||
| P | Control | 12 512·6 (100) | 26 647·6 (100) | 2920·8 (100) | ||
| L-1 | 12 839·8 (103) | 26 888·9 (101) | 3056·0 (105) | |||
| L-2 | 12 169·6 (97) | 25 742·7 (97) | 2901·4 (99) | |||
| Mg | Control | 1085·9 (100) | 1123·2 (100) | 1181·2 (100) | ||
| L-1 | 1271·5 (117) | 1242·2 (111) | 1171·0 (99) | |||
| L-2 | 1261·6 (116) | 1168·0 (104) | 1176·0 (100) | |||
| Ca | Control | 930·6 (100) | 634·6 (100) | 109·9 (100) | ||
| L-1 | 1032·0 (111) | 507·1 (80) | 120·9 (110) | |||
| L-2 | 923·4 (99) | 470·6 (74) | 146·2 (133) | |||
| Fe | Control | 144·5 (100) | 1120·8 (100) | 14·5 (100) | ||
| L-1 | 170·3 (118) | 734·6 (66) | 16·1 (111) | |||
| L-2 | 170·2 (118) | 732·1 (65) | 15·5 (107) | |||
| Mn | Control | 95·6 (100) | 72·3 (100) | 16·0 (100) | ||
| L-1 | 105·1 (110) | 56·5 (78) | 15·1 (94) | |||
| L-2 | 98·0 (103) | 55·4 (77) | 21·2 (132) | |||
Leaves and roots of 7-day-old plants were used.
Control, transgenic rice possessing vector alone; L-1 and L-2, transgenic rice possessing the YK1 gene.
In YK1 calli, different metabolic patterns were observed. Among the FAAs, aspartate and glutamine were decreased (Table 6). Since these amino acids are precursors of NAD in plants, this decrease may be caused by the activation of NAD synthesis (Hayashi et al., 2005). The amounts of TCA cycle intermediates, except for 2-oxoglutarate, were decreased (Table 5). 2-Oxoglutarate is a substrate of glutamine synthetase/glutamate synthase (Weber and Flügge, 2002), and the resulting glutamate is converted into GSH. GSH metabolism is known to require NADPH and to play an important role in maintaining homeostasis against several types of stress (Xiang et al., 2001; Dorval and Hontela, 2003). The amount of GSH was increased in YK1 lines by 291 % for L-1 and 204 % for L-2 over the control (Table 7). Likewise, the amount of GSSG was increased by 131 % (L-1) and 134 % (L-2), respectively. Correspondingly, the increase of the compound expected to be GSH (m/z = 307) in YK1 callus was detected by FT-MS analysis (Takahashi et al., 2005). We therefore measured the activity of GSH-related enzymes, GPX and GR. GPX and GR were significantly activated in the transgenic line, while the activities of APX and CAT were unchanged (Fig. 2). These results suggested that the overexpression of YK1 in calli enhanced synthesis and the reduction state of GSH concomitantly with NAD(P)(H) production. In previous reports, expression levels of antioxidant enzymes were enhanced by alteration of the cellular redox state (Hérouart et al., 1993; Lamb 1994). Further, Kamata and Hirata (1999) proposed the existence of a relationship between the cellular signalling system and the redox state. The cellular redox state is known to be affected by the amounts of NAD(P)(H) and GSH, whereas the redox state of GSH is also important for the defence response (Rao and Davis, 1999). Since the ratio of GSH to GSSG increased, YK1 calli might enhance tolerance to oxidative stresses. On the other hand, the amounts of GSH in YK1 plants were only marginally increased and the activities of GPX and GR were not altered (data not shown). These discrepancies can be considered as follows. Calli are always subjected to severe conditions such as oxygen depletion and nutrient deficiency, etc. Thus, such physical and chemical stresses may affect antagonistic defences, leading to an increase in GSH, which would be accelerated by DFR activity. Further experiments to explain the precise mechanisms of the cross-talk between DFR overexpression, NAD(P)(H) and GSH metabolism will be the subject of further study.
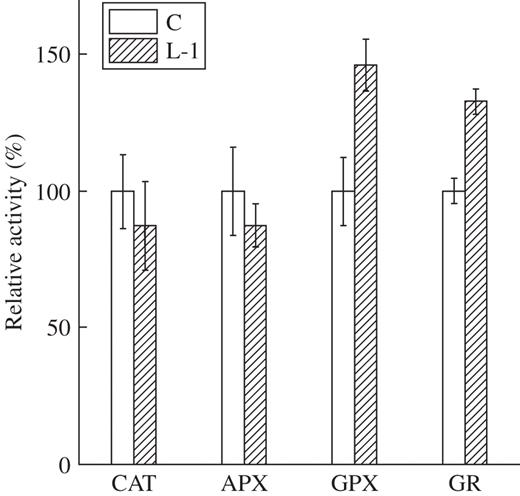
Measurement of antioxidant enzyme activities in control (C) and YK1-overexpressing callus (L-1). Catalase (CAT), ascorbate peroxidase (APX) and glutathione peroxidase (GPX) were measured using H2O2 as a substrate. Activities are expressed as relative activity (%) of the control. Exact values of activities in control calli are 65·8 (μmol H2O2 reduced min−1 mg protein−1) for CAT, 66·1 (nmol ascorbate oxidized min−1 mg protein−1) for APX, 101·0 (nmol NADPH reduced min−1 mg protein−1) for GPX and 95·1 (nmol NADPH reduced min−1 mg protein−1) for glutathione reductase (GR). All data represent the mean of three independent experiments.
Comparison of organic acid levels in calli of control and YK1 rice
| Concentration (nmol g−1 f. wt) | |||
|---|---|---|---|
| Metabolites | Control (%) | L-1 (%) | |
| FBP | 18·9 ± 1·7 (100) | 28·0 ± 7·3 (148) | |
| GA3P | 25·1 ± 2·7 (100) | 11·0 ± 0·9 (44) | |
| PEP | 4·6 ± 0·9 (100) | 8·4 ± 2·9 (183) | |
| Pyruvate | 17·2 ± 1·3 (100) | 20·3 ± 4·1 (118) | |
| Citrate | 95·5 ± 19·3 (100) | 72·3 ± 18·2 (76) | |
| cis-Aconitate | 0·6 ± 0·1 (100) | 0·6 ± 0·1 (99) | |
| 2-Oxoglutarate | 11·4 ± 0·7 (100) | 15·2 ± 1·3 (134) | |
| Succinate | 249·3 ± 9·4 (100) | 183·3 ± 23·8 (74) | |
| Fumarate | 48·5 ± 9·2 (100) | 22·2 ± 1·5 (46) | |
| Malate | 236·6 ± 28·0 (100) | 161·9 ± 21·4 (68) | |
| G6P + F6P | 177·3 ± 12·4 (100) | 212·4 ± 11·5 (120) | |
| 6PG | 7·5 ± 1·7 (100) | 9·5 ± 1·9 (126) | |
| R5P | 11·8 ± 1·2 (100) | 22·6 ± 2·5 (192) | |
Calli cultured for 5 d were used.
Control, transgenic rice possessing vector alone; L-1, transgenic rice possessing the YK1 gene.
Data are the means ± s.e. of three independent experiments.
Comparison of free amino acid levels in calli
| Concentration (nmol g−1 f. wt) | |||
|---|---|---|---|
| Metabolites | Control (%) | L-1 (%) | |
| Alanine | 3136·0 ± 219·0 (100) | 2504·5 ± 242·2 (80) | |
| Arginine | 238·5 ± 6·4 (100) | 268·0 ± 18·7 (113) | |
| Asparagine | 432·3 ± 102·5 (100) | 372·0 ± 51·4 (86) | |
| Aspartate | 85·5 ± 4·3 (100) | 36·8 ± 2·8 (43) | |
| Cysteine | 76·5 ± 7·1 (100) | 107·7 ± 5·8 (141) | |
| Glutamine | 603·1 ± 21·7 (100) | 200·2 ± 11·5 (33) | |
| Glutamate | 715·2 ± 47·5 (100) | 590·6 ± 19·1 (83) | |
| Glycine | 705·8 ± 38·1 (100) | 760·1 ± 32·1 (108) | |
| Histidine | 124·2 ± 5·8 (100) | 129·0 ± 4·3 (104) | |
| Lysine | 279·7 ± 9·5 (100) | 280·4 ± 19·4 (100) | |
| Leucine | 486·8 ± 24·2 (100) | 518·5 ± 27·2 (107) | |
| Methionine | 54·9 ± 12·3 (100) | 34·2 ± 6·8 (62) | |
| Phenylalanine | 416·0 ± 33·9 (100) | 520·4 ± 10·7 (125) | |
| Proline | 178·1 ± 9·7 (100) | 159·9 ± 8·8 (90) | |
| Serine | 794·6 ± 45·6 (100) | 411·0 ± 29·3 (52) | |
| Threonine | 290·5 ± 13·7 (100) | 234·7 ± 20·4 (81) | |
| Tryptophan | 54·5 ± 3·1 (100) | 47·4 ± 0·7 (87) | |
| Tyrosine | 198·9 ± 9·6 (100) | 193·0 ± 8·2 (97) | |
| Valine | 484·8 ± 24·4 (100) | 467·9 ± 34·4 (97) | |
| Total | 9355·9 ± 559·3 (100) | 7837·2 ± 218·3 (84) | |
Calli cultured for 5 d were used.
Control, transgenic rice possessing vector alone; L-1, transgenic rice possessing the YK1 gene.
Data are the means ± s.e. of three independent experiments.
Comparison of reduced and oxidized glutathione levels in calli
| Concentration (nmol g−1 f. wt) | |||||
|---|---|---|---|---|---|
| Metabolites | Control (%) | L-1 (%) | L-2 (%) | ||
| GSH | 219·7 ± 36·5 (100) | 639·3 ± 105·8 (291) | 449·0 ± 80·4 (204) | ||
| GSSG | 75·8 ± 11·8 (100) | 99·5 ± 11·3 (131) | 101·5 ± 14·2 (134) | ||
| GSH + GSSG | 295·5 ± 24·8 (100) | 738·8 ± 117·0 (250) | 550·5 ± 85·3 (186) | ||
| GSH/GSSG | 2·9 (100) | 6·4 (221) | 4·4 (153) | ||
Calli cultured for 5 d were used.
Control, transgenic rice possessing vector alone; L-1 and L-2, transgenic rice possessing the YK1 gene.
Data are the means ± s.e. of three independent experiments.
This research was supported in part by a grant from the Ministry of Agriculture, Forestry and Fishery, Japan and CREST, JST, Japan.
LITERATURE CITED
Adams MA, Chen Z, Landman P, Colmer TD.
Aharoni A, Ric de vos CH, Verhoeven HA, Maliepaard CA, Kruppa G, Bino R, Goodenowe DB.
Bradford MM.
Chen LM, Li K-Z, Miwa T.
Choi HK, Choi YH, Verberne M, Lefeber AWM, Erkelens C, Verpoorte R.
Dörmann P, Hoffmann-Benning S, Balbo I, Benning C.
Dorval J, Hontela A.
Dubois M, Gilles KA, Hamilton JK, Rebers PA, Smith F.
Echt CS, Schwarts D.
Fiehn O, Kopka J, Dörmann P, Altmann T, Trethewey RN, Willmitzer L.
Goto F, Yoshihara T, Shigemoto N, Toki S, Takaiwa F.
Hayashi M, Takahashi H, Tamura K, Huang J, Yu LH, Kawai-Yamada M, et al.
Hérouart D, Montagu MV, Inzé D.
Hirai MY, Yano M, Goodenowe D, Kanaya S, Kimura T, Awazuhara M, et al.
Itoh K, Ozaki H, Okada K, Hori H, Takeda Y, Mitsui T.
Lamb CJ.
Mittova V, Theodoulou FL, Kiddle G, Gómez L, Volokita M, Tal M, et al.
Mungur R, Glass ADM, Goodenow DB, Lightfoot DA.
Murashige T, Skoog F.
Oliver DJ, Nikolau B, Wurtele ES.
Rao MV, Davis KR.
Roessner U, Luedemann A, Brust D, Fiehn O, Linke T, Willmitzer L, et al.
Rohloff J, Bones AM.
Saruyama H, Tanida M.
Sato S, Soga T, Nishioka T, Tomita M.
Soga T.
Soga T, Ueno Y, Naraoka H, Ohashi Y, Tomita M, Nishioka T.
Soga T, Ueno Y, Naraoka H, Matsuda K, Tomita M, Nishioka T.
Suneetha A, Chinnappa CC, Devid MR.
Takahashi H, Hotta Y, Hayashi M, Kawai-Yamada M, Komatsu S, Uchimiya H.
Tanaka N, Takahashi H, Kitano H, Matsuoka M, Akao S, Uchimiya H, Komatsu S.
Trethewey RN.
Uchimiya H, Fujii S, Huang J, Fushimi T, Nishioka M, Kim KM, et al.
Ward JL, Harris C, Lewis J, Beale MH.
Weber A, Flügge UI.
Xiang C, Werner BL, Christernse EM, Oliver DJ.
Author notes
1Institute of Molecular and Cellular Biosciences, The University of Tokyo, 1-1-1 Yayoi, Bunkyo-ku, Tokyo 113-0032, Japan, 2Plant Molecular Biology Group, Laboratory of Environmental Science, Central Research Institute Electric Power Industry, 1646 Abiko, Chiba 270-1194, Japan, 3Institute for Advanced Biosciences, University of Keio, Tsuruoka, Yamagata 997-0017, Japan and 4Iwate Biotechnology Research Center, Kitakami, Iwate 024-0003, Japan
