


Abstract
The use of immunohistochemical methods has led to a new understanding of the prevalence and significance of cortical lesions in multiple sclerosis but these lesions have not yet been formally described in an animal model. In this study we have set out to use immunohistochemical techniques to identify and describe cortical lesions in marmosets with experimental autoimmune encephalomyelitis (EAE). Using antibodies to proteolipid protein (PLP), we found a total of 70 cortical lesions in 11 tissue blocks from 6 animals. These lesions were subdivided into leucocortical (40), intracortical (12) and subpial lesions (18). We quantified the density of inflammatory cells within lesions using a double labelling protocol which employed anti-PLP in addition to antibodies against markers of B-lymphocytes (CD20), T-lymphocytes (CD3), macrophages (MAC387) and MHC-II expressing cells (CR3/43). This analysis revealed that the large subpial lesions accounted for the majority of demyelinated cortex (88%) despite possessing the lowest density of inflammatory cells. This study has shown that lesions in this model share many of the major features of cortical lesions in multiple sclerosis both in terms of morphology and inflammatory cell content. We believe that this tool can be exploited in future studies to investigate the aetiology, development and clinical significance of cortical lesions in demyelinating disease.
Introduction
Neocortical lesions have long been recognized in multiple sclerosis (Greenfield and King, 1936; Brownell and Hughes, 1962; Lumsden, 1970), but until recently research had concentrated almost exclusively on white matter lesions. This focus is explained by their easy visualization with conventional myelin staining methods, the ease with which they can be identified and measured with MRI, and evidence associating their appearance with relapses in multiple sclerosis (Schreiber et al., 2001; Christodoulou et al., 2003; Taylor et al., 2004). However, quantitative volumetric MRI studies have demonstrated convincing evidence for substantial neocortical atrophy, which is correlated only poorly with visible white matter lesion load (Paolillo et al., 2000; Chard et al., 2003; De Stefano et al., 2003; Dalton et al., 2004; Inglese et al., 2004). Neocortical atrophy is an important parameter to understand, as it makes a major (and, in some cases, the predominant) contribution to cerebral atrophy in multiple sclerosis. Studies investigating the relationship between MRI measures and disability generally suggest cerebral atrophy to be the strongest imaging correlate of disease progression (Losseff et al., 1996; Fisher et al., 2002). Detailed evaluation using MRI to define the substrate for the atrophy observed has been difficult, in part because the neocortex is thin relative to the size of conventional imaging voxels. Conventional MRI approaches allow only 5–9% of demyelinated cortical lesions visible post-mortem with immunohistochemistry to be seen with MRI (Geurts et al., 2003).
Recent studies using sensitive immunohistochemical methods promise a new understanding of the extent and nature of neocortical lesions in multiple sclerosis (Peterson et al., 2001). Bo et al. (2003b) systematically sampled multiple sclerosis brain tissue and found a mean of 26.5% of the cortex to be demyelinated, compared with only 6.5% of the subcortical white matter. Cortical lesions identified using immunohistochemistry have been divided into three distinct morphological patterns: leucocortical (Type 1) lesions, which involve both the grey and immediately adjacent white matter; intracortical (Type 2) lesions, which lie purely within the cortex; and subpial (Type 3) lesions, which extend from and run parallel to the pial surface (Peterson et al., 2001). Such lesions have been found to be hypocellular with respect to white matter lesions with a lymphocyte density in intracortical and subpial lesions similar to that in the neocortex of non-multiple sclerosis control brains (Bo et al., 2003a). Despite this lack of inflammatory activity, cortical lesions have been shown to contain neurodegenerative features, such as an increased rate of transected neurites, and apoptotic neurons (Peterson et al., 2001).
The extent of cortical lesions reported in these studies and the presence of neurodegenerative changes suggest that they may play a significant role in determining the clinical progression of multiple sclerosis. However, investigations into the dynamics of lesion development and specific clinical–pathological correlations are limited by difficulties in quantitatively monitoring lesions in vivo. A reliance on post-mortem studies imposes restrictions on the information available owing to limited tissue availability, suboptimal fixation and the predominance of material from patients with end-stage disease. The availability of an animal model reproducing essential characteristics of neocortical lesions in multiple sclerosis would offer a new tool for understanding their genesis. However, to date we are not aware that they have been formally described in an animal model of multiple sclerosis.
Experimental autoimmune encephalomyelitis (EAE) is the most commonly used multiple sclerosis animal model and was first studied over 70 years ago (Rivers, 1933). Disease is induced with a subcutaneous injection of myelin antigen, which leads to an inflammatory reaction within the central nervous system. Disease course and pathological features are variable and depend on the animal species or strain chosen and the specific antigen injected. EAE in the common marmoset (Callithrix jacchus jacchus) is considered by some researchers to bear a closer resemblance to multiple sclerosis than other EAE models, as it uses an outbred population of animals which possess a high degree of homology with humans for myelin and immune system genes and displays similar white matter features on histopathological study (Genain and Hauser, 2001; Uccelli et al., 2003; 't Hart et al., 2004). In preliminary work by our research group (unpublished data) we used immunohistochemical methods to identify neocortical lesions in marmoset EAE. The aim of this study was to characterize the extent, morphology and inflammatory content of these lesions in ways that can be related to previous similar studies of multiple sclerosis.
Methods
Disease model
The animals used in this study came from an outbred population of common marmosets (C. jacchus jacchus) kept as a part of an animal care and use protocol approved at the National Institutes of Health. EAE was induced with a subcutaneous injection of 100 µg of recombinant human myelin oligodendrocyte glycoprotein (rhMOG, gift from Dr Robert Weissert, University of Tuebingen, Germany, Weissert et al., 2002) in 450 µl incomplete Freund's adjuvant supplemented with 1 mg/ml of inactivated Mycobacterium tuberculosis H37 Ra. In addition, the animals were given an intravenous injection of 109 inactivated Bordetella pertussis organisms in 0.5 ml of normal saline. Animals ran a progressive course and either died suddenly as a direct result of the disease or were euthanized when they became immobile.
Animals were euthanized by preanaesthetizing them with an intramuscular injection of ketamine and acepromazine followed by an intravenous injection of pentobarbital. Tissues were fixed by perfusion or immersion fixation with 4% paraformaldehyde and 3% sucrose. Following fixation a brain frame was used to divide the whole brains into 2 mm thick coronal sections which were set in paraffin blocks.
Tissue selection
In order to select tissue for the study we reviewed sections stained with luxol fast blue (LFB) and H & E from all tissue blocks taken from 13 animals with MOG-induced EAE. Using this method it was possible to survey the entire brains to detect evidence of both subcortical white matter and leucocortical lesions. Leucocortical lesions were seen in one or more blocks in 10 of the 13 animals. Intracortical lesions could be seen in the deeper cortical layers but no subpial lesions could be identified at this stage. A total of 11 blocks from 6 animals were selected for the study based on the presence of subcortical and leucocortical lesions within the block. In addition tissue blocks were selected for study from five control cases which were either euthanized or died from non-neurological disease. Clinical details for cases and controls are shown in Table 1.
Clinical characteristics of cases and controls
| Subject | Case/control | Age (months) | Sex | No. of tissue blocks studied | Induction | Survival (days) | Cause of death |
|---|---|---|---|---|---|---|---|
| 1 | Case | 29 | M | 1 | 100 µg rhMOG | 66 | EAE |
| 1× B. pertussis | |||||||
| 2 | Case | 47 | M | 2 | 100 µg rhMOG | 44 | Euthanized |
| 1× B. pertussis | Immobility resulting from EAE | ||||||
| 3 | Case | 97 | M | 2 | 100 µg rhMOG | 49 | EAE |
| 2× B. pertussis# | |||||||
| 4 | Case | 30 | F | 2* | 100 µg rhMOG | 70 | Euthanized |
| 1× B. pertussis | Immobility resulting from EAE | ||||||
| 5 | Case | 33 | F | 1* | 100 µg rhMOG | 26 | Euthanized |
| 1× B. pertussis | Immobility resulting from EAE | ||||||
| 6 | Case | 33 | F | 3 | 100 µg rhMOG | 65 | Euthanized |
| 1× B. pertussis | Immobility resulting from EAE | ||||||
| 7 | Control | 7 | M | 2 | N/A | N/A | Euthanized |
| Fractured femur | |||||||
| 8 | Control | 19 | M | 2 | N/A | N/A | Sudden death |
| Ruptured aortic aneurysm seen at post-mortem | |||||||
| 9 | Control | 119 | F | 13 | N/A | N/A | Euthanized |
| Non-specific illness with increasing weakness for 1 week. Dilated inferior vena cava seen at post-mortem | |||||||
| 10 | Control | 93 | F | 13 | N/A | N/A | Euthanized |
| Immobility resulting from chronic arthritis | |||||||
| 11 | Control | 102 | M | 5 | N/A | N/A | Euthanized |
| Marmoset wasting syndrome |
Block contained single hemisphere only.
Animal received B. pertussis at 0 and 24 h post-induction.
Immunohistochemistry
Blocks identified using the methods described above were cut using a microtome into 6 µm thick sections. In order to identify and classify demyelinated lesions, two index sections were selected from the centre of each block and stained for myelin using antibodies to proteolipid protein (anti-PLP, Serotec, UK) and LFB. Surrounding sections were stained with a double labelling protocol using anti-PLP to differentiate myelinated and demyelinated areas and an additional antibody to label inflammatory cells. The following antibodies were used in this protocol: mouse anti-human CD20 for B-lymphocytes (Dako, UK), mouse anti-human CD3 for T-lymphocytes (Dako, UK), mouse anti-human MAC387 for macrophages (Serotec, UK) and mouse anti-human CR3/43 for cells expressing MHC-II antigen (Dako, UK).
Selection of matched control areas
Each demyelinated lesion was classified according to the morphological classification described by Peterson et al. (2001) and its position was recorded using 3D coordinates derived from an atlas of the marmoset brain (Stephan et al., 1980). These coordinates were used to select matched control areas for each lesion using the following method. Normal appearing grey matter (NAGM) controls were selected in an identical position to each lesion in the contralateral hemisphere. If this area also contained a lesion then an area immediately superior to the lesion was used. In addition, each block from an EAE animal was matched with a control block from a healthy control animal by first selecting an animal at random and then randomly selecting a block from that animal. A matched control area was then selected from this block taking care to include the same cortical layers involved in the index lesion. Sections from control blocks were stained using the same procedure employed for EAE blocks. The procedure for selecting cortical areas from control blocks was repeated for each of the five staining protocols used in order to minimize the impact of any individual control case.
Calculation of lesion areas and cell densities
Sections stained using LFB and antibodies to PLP were scanned on a flat bed scanner (Canoscan 2400U, Canon UK) to obtain representative cross-sectional images from each block. These images were viewed on a computer using SCION image analysis software (version beta 4.0.2, Scion Corporation) in order to draw around the cortex and cerebral white matter and calculate their respective areas. The white matter portion of each image was then greyscaled and a threshold applied to select out the demyelinated area. These same sections were then examined under a microscope in order to identify cortical lesions and classify them according to their morphology as described by Peterson et al. (2001). A digital photograph of each lesion was taken using an Olympus Camedia Micro Imaging System (Olympus, UK). Each image was viewed using SCION image to allow its perimeter to be outlined manually and its area recorded.
All cortical lesions recorded using the above method were identified on each set of double-labelled sections and photographed along with their corresponding matched NAGM and healthy control areas. These photographs were analysed using the following method: the demyelinated area was identified and outlined by hand using the full colour image. The outline of each lesion was then used as a template to select anatomically matched areas from NAGM and control cases. The images of the resulting areas of interest in cases and controls were greyscaled and a density threshold was applied to highlight the inflammatory cells. The percentage of the lesion or control area occupied by each inflammatory cell type was then calculated. A subset of eight cases was recounted for each inflammatory cell stain and analysed in order to assess the reliability of this method. This analysis generated common interitem correlation coefficients and Pearson correlation coefficients of >0.70 in all cases.
When examining the inflammatory cell density of leucocortical lesions, the cortical and white matter components were counted separately for the purposes of comparison. Sections stained with this MAC-387 were used in order to classify the inflammatory activity of lesions: lesions with macrophages throughout were classed as active, lesions with macrophages at the edges but not in the centre were classed as chronic active whereas chronic inactive lesions were those with no significant inflammatory activity present.
In order to investigate for a relationship between cortical lesions and subpial inflammatory cells, the number of cells between the pia and the brain parenchyma was calculated in areas overlying Type 3 lesions and their matched controls. In this analysis, cells were identified objectively by applying a threshold to a digital image and counting only those objects above a predetermined size. The number of cells identified in this way was then divided by the length of pia analysed to give a measure of subpial inflammatory cell density.
Statistical analysis
The distribution of inflammatory cell densities was not normally distributed and a Mann–Whitney U-test was, therefore, used to investigate for significant differences between groups. Comparisons were performed between cell densities in different cortical lesion types and also between lesions and matched NAGM or control cortex. We investigated for a relationship between white matter lesion load and cortical lesion load by correlating the total demyelinated white matter area found within each hemisphere with the area of each cortical lesion type within that same hemisphere. Since the distribution of this data was non parametric, Spearman's correlation coefficient was used for this analysis. All statistical calculations were performed using SPSS software (version 12.0.1, SPSS Inc.)
Results
Lesion identification
Detection of all cortical lesions was greatly enhanced by the use of immunohistochemistry. Lesions close to the leucocortical border could be seen using LFB and anti-PLP although the contrast between lesion and myelinated cortex was much greater in the immunohistochemically stained sections. Identification in conventional sections was often aided by obvious continuation of demyelinated white matter lesions into the cortex and the presence of an inflammatory infiltrate seen with the cresyl violet counterstain. In the more superficial layers, cortex demonstrated to be myelinated in immunohistochemical sections showed very little or no myelin staining with LFB, making it impossible to be certain of the presence of a demyelinated lesion based on the LFB section alone (Fig. 1).
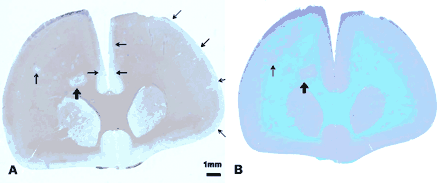
Comparison of immunohistochemical and conventional staining methods. Sequential sections from Case 3 scanned using a flatbed scanner. (A) Section stained using immunohistochemical method with anti-PLP + haematoxylin counterstain. This section shows clearly demarcated white matter (thick arrow) and cortical lesions (thin arrows). Note the presence of bilateral, large subpial lesions starting in the midline immediately above the corpus callosum which in the left hemisphere extends for the entire length of the cortical ribbon. (B) Section stained with conventional methodology using LFB + cresyl violet counterstain. Numerous white matter lesions can be clearly seen using this method but lesions in the cortex, particularly those in the superficial cortical layers are difficult to distinguish from normal myelinated cortex.
In contrast, at low magnifications white matter lesions appeared more extensive with LFB staining than with anti-PLP (Fig. 1). Examination at higher power revealed that this was because of the presence of vesiculated myelin, myelin degradation products and disrupted myelinated fibres within active lesions. These structures stained more intensely with anti-PLP and they, therefore, incorrectly appeared to be a part of the normal myelinated white matter at lower magnifications. For this reason, LFB-stained sections were used for identification and quantification of white matter lesions.
Lesion counts
Through examining sections stained immunohistochemically using anti-PLP, examples of all three cortical lesion types were identified (Fig. 2). A total of 70 cortical lesions were detected in 11 tissue blocks from 6 animals (Table 2). Three different patterns of cortical demyelination could be identified (similar to those described by Peterson et al. (2001) in multiple sclerosis). Leucocortical lesions (Fig. 2A) accounted for 57% of the total number of cortical lesions and were found in all subjects. Subpial lesions (Fig. 2C and D) (26%) were found in 5 out of 6 subjects. Intracortical lesions (Fig. 2B) (17%) were found in only 2 out of 6 subjects. White matter lesions were seen in all tissue blocks and were frequently confluent, making it difficult to identify and count individual plaques.
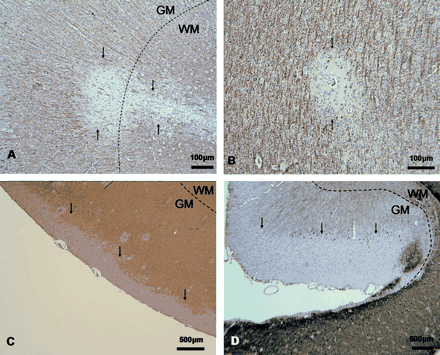
Cortical lesion morphology. Sections stained with anti-PLP + haematoxylin counterstain. The leucocortical border is highlighted with a dashed line when present, lesion borders are indicated with arrows. (A) Leucocortical lesion, ×100, showing lesion appearing to originate around a vessel in the white matter and spreading out into the cortex. (B) Intracortical lesion, ×100, showing a small, circular lesion centred on a blood vessel and situated entirely within the cortex. (C) Subpial lesion, ×40, showing a large lesion running parallel to the pial surface. (D) Subpial lesion, ×40, showing a common location of this lesion type, with the lesion running along the cingulate cortex as it abuts the corpus callosum.
Cortical lesion counts
| Subject | No. of blocks | No. of lesions | ||||
|---|---|---|---|---|---|---|
| Leucocortical (Type I) | Intracortical (Type II) | Subpial (Type III) | ||||
| 1 | 1 | 10 | 0 | 1 | ||
| 2 | 2 | 3 | 0 | 0 | ||
| 3 | 2 | 6 | 9 | 5 | ||
| 4 | 2 | 8 | 0 | 4 | ||
| 5 | 1 | 4 | 3 | 2 | ||
| 6 | 3 | 9 | 0 | 6 | ||
| Total | 11 | 40 | 12 | 18 | ||
Lesion size, morphology and location
White matter lesions were centred on blood vessels, were round or ovoid in shape and had sharp, clearly demarcated borders reminiscent of classical multiple sclerosis plaques. These lesions were large, occupying up to 60% of the cerebral white matter in some tissue blocks (Table 3). White matter lesions could be seen throughout the cerebrum but were most commonly found in the periventricular area and in the corpus callosum. Leucocortical lesions were of variable size (0.01–0.28, median 0.08 mm2) and shape. A blood vessel was found at the centre of this lesion type in 34 out of 40 instances and occurred in the grey matter portion of the lesion in 21 cases, the white matter portion in 8 cases and straddled the leucocortical border in 5 cases. Intracortical lesions were small (0.01–0.09, median 0.02 mm2), round or oval in shape and were always centred on a vessel. Subpial lesions were found in the superficial cortical layers extending parallel to the pial surface for most of their length before tapering at the ends. These lesions could be very large (0.28–12.04, median 0.98 mm2) and accounted for 88% of the total demyelinated cortical area in the sections (Table 3).
Cortical lesion areas
| Subject | Percentage of total cortical area | Percentage of white matter area | ||||
|---|---|---|---|---|---|---|
| Leucocortical (Type I) | Intracortical (Type II) | Subpial (Type III) | ||||
| 1 | 1.97 | 0.00 | 0.47 | 58.66 | ||
| 2 | 0.21 | 0.00 | 0.00 | 7.1 | ||
| 3 | 0.36 | 0.13 | 13.19 | 12.06 | ||
| 4 | 0.18 | 0.00 | 1.18 | 57.51 | ||
| 5 | 0.85 | 0.13 | 3.13 | 10.2 | ||
| 6 | 0.27 | 0.00 | 1.38 | 35.63 | ||
| Total | 0.41 | 0.04 | 3.25 | 31.39 | ||
Although leucocortical and intracortical lesions were most frequently located in the cortex surrounding the corona radiata in this sample, these lesions could be found throughout the cerebral hemisphere. In contrast, subpial lesions were found most frequently in the cingulate cortex with 15 out of 18 subpial lesions involving this area. The three remaining subpial lesions all appeared to be centred on a prominent vessel in the subpial rim that was associated with a small, wedge shaped extension of the lesion into deeper cortical layers. Typical examples of all of these lesion morphologies are shown in Fig. 2.
Inflammatory activity
Inflammatory activity within white matter, leucocortical and intracortical lesions was similar to that described in typical multiple sclerosis plaques (Esiri and Gay, 1997). Lymphocytes were located mainly in a perivascular distribution but T cells also spread out into the lesion parenchyma (Fig. 3). Although there was no obvious difference between the densities of perivascular infiltrates in white matter and cortical lesions, there appeared to be a greater density of parenchymal lymphocytes in white matter lesions. Leucocortical lesions (34 out of 40) and intracortical lesions (7 out of 12) displayed dense infiltrates of macrophages occupying the whole of the demyelinated area and were classed as active (Fig. 3C). The remaining 6 out of 40 leucocortical and 5 out of 12 intracortical lesions were classed as chronic inactive with macrophages found only at the edges of lesions. Demyelinated regions within white matter predominantly contained macrophages throughout their entire area although a few distinct lesions displayed a chronic active distribution of macrophages. Macrophage density was greater within white matter lesions compared with leucocortical and intracortical lesions. This point was best illustrated in leucocortical lesions where the higher density of macrophages in the white matter portion of the lesions could be seen clearly (Fig. 3C). Activated microglia were prominent around the perimeter of all lesion types and often extended beyond the demyelinated lesion border into surrounding myelinated tissue.
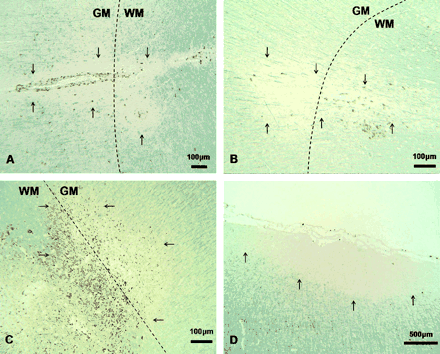
Inflammatory cell distribution in cortical lesions. Leucocortical borders are outlined with dashed line where present; lesion borders are indicated with arrows. Chromagens used are vector SG (blue-grey) for myelin and diaminobenzidine (brown) for inflammatory cells. (A) Leucocortical lesion, ×100, anti-CD20, showing typical distribution of B-cells with a high density in the perivascular space. (B) Leucocortical lesion, ×100 anti-CD3, showing T-lymphocytes concentrated around the perivascular space but with a wider distribution than that of B-cells. (C) Leucocortical lesion, ×100 anti-MAC387, showing an active lesion with macrophages scattered throughout the lesion. Note the higher density of cells within the white matter (WM) portion of the lesion. (D) Subpial lesion, ×40, anti-MAC387, from same animal as in C showing hypocellular nature of subpial lesions.
In contrast, subpial lesions showed little evidence for ongoing inflammatory activity. Lymphocytes and macrophages were present in the subpial rim, whereas the centres of lesions typically contained only a few perivascular lymphocytes. In 6 of the 18 lesions studied there were no significant infiltrates of inflammatory cells (Fig. 3D), whereas the remaining 12 lesions had cellular infiltrates only at the lesion border. Macrophages and activated microglia were the most frequently identified inflammatory cells in these infiltrates but their density was lower around subpial lesions than around other lesion types.
Figure 4 shows the distribution of inflammatory cell densities for the three cortical lesion types, the white matter portion of leucocortical lesions, NAGM and control cortex from non-EAE animals. Mann–Whitney tests were performed to look for significant differences between these groups. This analysis confirmed all lesion types to have a greater density of all types of inflammatory cells when compared with NAGM and control cortex (P < 0.01) with the exception of CD20 positive cells in subpial lesions. Intracortical lesions had a significantly greater density of CD20 (P = 0.003) and CD3 (P = 0.002) positive cells than leucocortical lesions but no significant differences for MAC387 and CR3/43 positive cells. Inflammatory cell density in subpial lesions was significantly lower than in leucocortical and intracortical lesions across all cell types (P < 0.01).
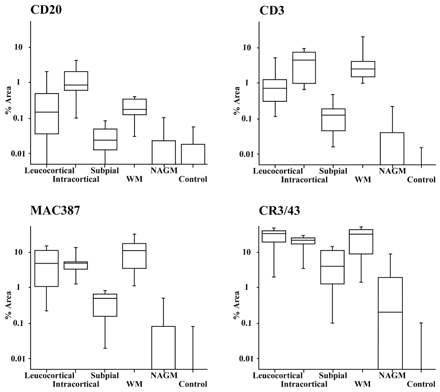
Box and whisker plots to display relative inflammatory cell densities of lesions and control areas. The graphs display the percentage of the lesion area accounted for by each inflammatory cell class in each lesion type and control area. Boxes show the median and interquartile range whereas the whiskers extend to the 5th and 95th centiles. Despite the large variations in densities of each cell type (note the use of a logarithmic scale) a consistent pattern was found to apply across all cell types with subpial lesions having a significantly lower cell density than leucocortical and intracortical lesions. Note that the data displayed for WM refers to the cell density in the white matter portion of leucocortical lesions.
We explored the relationships between lesion inflammatory cell infiltration in grey matter of leucocortical and subpial lesions relative to immediately adjacent tissue. In leucocortical lesions, the white matter portion of the lesions had a significantly greater density of cells expressing MAC387 (P = 0.009) and CD3 (P = 0.046) but no such difference was found for CD20 expressing cells (P = 0.41). Density of cells expressing CD3, CD20 and MAC387 was significantly increased in the pia overlying subpial lesions compared with matched areas from NAGM and control cortex (P < 0.001).
Associations between demyelinated white matter and cortical lesion area
Spearman's correlation coefficients were applied to test for a significant association between total demyelinated white matter area and cortical lesion area within the 11 cerebral hemispheres studied. This analysis found only a trend towards an association between white matter demyelinated area and total leucocortical lesion area within each hemisphere (r = 0.52, P = 0.10). There was no evidence found for an association between white matter demyelinated area and intracortical lesion area (r = −0.18, P = 0.60) or subpial lesion area (r = −0.01, P = 0.94).
Discussion
These results show that cortical lesions can be identified in this form of EAE with the use of immunohistochemical methods. To our knowledge this is the first formal investigation of cortical lesions in any animal model of multiple sclerosis. These results have demonstrated several key features of cortical lesions in this model that are shared with multiple sclerosis. These features include a preponderance of subpial lesions, a lower density of inflammatory cells relative to white matter lesions and poor detection of lesions with conventional neuropathological methods (Peterson et al., 2001; Bo et al., 2003a, b). In addition, we have demonstrated a novel finding that subpial lesions are associated with inflammatory infiltrates in the subpial rim.
We have confirmed that traditional LFB staining can be used to reliably detect white matter lesions but has poor sensitivity for even large lesions in the cortex. Two major features of cortical lesions combine to make them difficult to detect with LFB and help to explain why they have not been more extensively investigated in the past. Our study has shown that the majority of demyelinated cortex is accounted for by subpial lesions and occurs in the more superficial cortical layers. The poor sensitivity of LFB for the low myelin density found in this area provides for very little contrast between lesions and myelinated cortex. In addition, the relative hypocellularity of cortical lesions and their occurrence in a cellular environment leads to poorer contrast with surrounding tissue when using counterstains that rely on staining of the nucleus (Kidd et al., 1999).
Prior to this study, the only systematic investigations of demyelinated cortical lesions have been performed using post-mortem tissue from patients with end-stage multiple sclerosis. Based on existing studies it is difficult to comment on whether cortical lesions in multiple sclerosis occur in the early stages of the illness, although the finding that both cortical atrophy and neuronal loss are found in the first few years of multiple sclerosis (Dalton et al., 2004; Inglese et al., 2004) suggests that there are active processes involving the cortex at this time. The presence of lesions in the more aggressive and rapidly progressive disease investigated in this study provides evidence that cortical lesions may not be confined to chronic, inactive demyelinating disease.
Despite the differences in the natural history and degree of inflammatory activity found in EAE and multiple sclerosis there appear to be many similarities between the cortical lesions seen in the two diseases. Although the density of inflammatory infiltrates appears to be greater in EAE the relative proportion of each type of inflammatory cell that makes up the infiltrate is similar. In addition to this, the system devised for classifying multiple sclerosis lesions according to morphology appears to work very well in this marmoset model. This study has found a significantly greater density of T-lymphocytes and macrophages in the white matter portion of leucocortical lesions relative to the adjacent grey matter portion. This finding is consistent with previous investigations using multiple sclerosis tissue that also found a decreased macrophage and lymphocyte density in cortical lesions relative to white matter lesions. Although we failed to find a similar difference in the distribution of B-lymphocytes in this study, the preferential distribution of these cells in the perivascular space and the fact that the majority of leucocortical lesions were centred on a vessel in the cortex makes this distinction difficult to test.
It is the subpial lesions seen in multiple sclerosis and EAE that are the most intriguing as they show the greatest variation from familiar white matter lesions. The similarities between subpial lesions seen in this study and those previously described in multiple sclerosis are particularly striking. In both multiple sclerosis and in this form of EAE, these lesions account for the greatest area of demyelinated cortex despite having the lowest density of inflammatory cells (Bo et al., 2003a, b; Peterson et al., 2001). Subpial lesions occupy a considerable proportion of the cortex but their aetiology, development and clinical significance are currently unknown. The shape of these lesions and the low density of inflammatory cells suggests that they may be caused by a factor diffusing from the pial surface (Peterson et al., 2001). This hypothesis is supported by our finding of a greater density of lymphocytes in the subpial rim immediately above subpial lesions.
The observation that subpial lesions were most frequently found in the cingulate cortex at the point where the cortex runs alongside the corpus callosum also requires explanation. Studies of multiple sclerosis tissue have found significantly more cortical lesions in the cingulate gyrus relative to other gyri studied (Bo et al., 2003b), whereas it has previously been noted that cortical lesions have a tendency to occur at the depth of a sulcus where two pial surfaces abut each other (Kidd et al., 1999). Possible explanations for these findings include direct spread of inflammation across the pial surface, a local effect caused by the dynamics of CSF flow in these areas or features of the local vascular architecture.
The extent of demyelination seen in the white matter was greater than that seen in the cortex in this model. This contrasts with multiple sclerosis, in which published work which has used immunohistochemical methods to quantify cortical lesions found the cortex to be affected more than cerebral white matter (Bo et al., 2003b). Methodological issues can explain some of this discrepancy since Bo et al. included only subcortical white matter and did not include periventricular areas which show a greater extent of demyelination. However, it is clear that the form of EAE studied here has a highly active inflammatory component which has a significant impact on the white matter. The large burden of white matter disease may complicate the future study of the clinical and pathological sequelae of cortical lesions in this model.
There was no strong evidence found for an association between the areas of demyelinated white matter and cortical lesions within individual cerebral hemispheres. This finding presents further evidence of the poor sensitivity of MRI for detecting the presence of cortical lesions either directly or indirectly. The lack of an association between white matter lesions and the large subpial lesions which form a part of the normal appearing cortex on conventional MRI could help to explain some of the discrepancies between clinical and radiological findings which are well described in multiple sclerosis (Barkhof, 2002).
Conclusions
This study has demonstrated that cortical lesions of a type similar to those in multiple sclerosis occur in an EAE model and confirms that such lesions can arise in the early, active stages of demyelinating disease. We have documented the presence of multiple sclerosis-like subpial lesions with a morphology and inflammatory cell content that differentiates them as being distinct from other lesion types. We report the novel finding of an association between cortical lesions and a subpial inflammatory response which suggests an encephalitic component relevant to disease in the pia. Further investigation of cortical lesions may better define mechanisms responsible for neurodegenerative features seen in multiple sclerosis. The demonstration of cortical lesions in this animal model provides a new tool which can be used to study this pathology.
The authors would like to acknowledge Drs Henry McFarland and Roland Martin from the National Institutes of Neurological Disorders and Stroke, National Institutes of Health for supporting EAE marmoset project. The authors would also like to acknowledge the generous gift of recombinant MOG protein from Robert Weissert from the Department of Neurology, University of Tuebingen, Germany. We would like to thank Carolyn Sloan for her excellent technical assistance, and Dr Christiane Wegner for the help and advice throughout the course of this project. This study was funded through a generous grant from the UK Multiple Sclerosis Society.
References
Barkhof F. The clinico-radiological paradox in multiple sclerosis revisited.
Bo L, Vedeler CA, Nyland H, Trapp BD, Mork SJ. Intracortical multiple sclerosis lesions are not associated with increased lymphocyte infiltration.
Bo L, Vedeler CA, Nyland HI, Trapp BD, Mork SJ. Subpial demyelination in the cerebral cortex of multiple sclerosis patients.
Brownell B, Hughes JT. Distribution of plaques in the cerebrum in multiple sclerosis.
Chard DT, Brex PA, Ciccarelli O, Griffin CM, Parker GJM, Dalton C et al. The longitudinal relation between brain lesion load and atrophy in multiple sclerosis: a 14 year follow up study.
Christodoulou C, Krupp LB, Liang Z, Huang W, Melville P, Roque C, et al. Cognitive performance and MR markers of cerebral injury in cognitively impaired MS patients.
Dalton CM, Chard DT, Davies GR, Miszkiel KA, Altmann DR, Fernando K, et al. Early development of multiple sclerosis is associated with progressive grey matter atrophy in patients presenting with clinically isolated syndromes.
De Stefano N, Matthews PM, Filippi M, Agosta F, De Luca M, Bartolozzi ML, et al. Evidence of early cortical atrophy in MS: relevance to white matter changes and disability.
Esiri MM, Gay D. The immunocytochemistry of multiple sclerosis plaques. In: Raine CS, McFarland HF, Tourtellotte WW, editors. Multiple sclerosis: clinical and pathogenetic basis. London: Chapman and Hall;
Fisher E, Rudick RA, Simon JH, Cutter G, Baier M, Lee JC, et al. Eight-year follow-up study of brain atrophy in patients with MS.
Genain CP, Hauser SL. Experimental allergic encephalomyelitis in the New World monkey Callithrix jacchus.
Geurts JJG, Bo L, Vrenken H, Castelijns JA, Polman CH, Barkhof F. Grey matter lesions in multiple sclerosis brain: a combined histopathology and MRI study.
Greenfield JG, King LS. Observations on the histopathology of the cerebral lesions in disseminated sclerosis.
't Hart BA, Laman JD, Bauer J, Blezer E, van Kooyk Y, Hintzen RQ. Modelling of multiple sclerosis: lessons learned in a non-human primate.
Inglese M, Ge Y, Filippi M, Falini A, Grossman RI, Gonen O. Indirect evidence for early widespread gray matter involvement in relapsing-remitting multiple sclerosis.
Kidd D, Barkhof F, McConnell R, Algra PR, Allen IV, Revesz T. Cortical lesions in multiple sclerosis.
Losseff NA, Wang L, Lai HM, Yoo DS, Gawne-Cain ML, McDonald WI, et al. Progressive cerebral atrophy in multiple sclerosis. A serial MRI study.
Lumsden CE. The neuropathology of multiple sclerosis. In: Vinken PJ, Bruyn GW, editors. Handbook of clinical neurology. Amsterdam: North Holland Publishers,
Paolillo A, Pozzilli C, Gasperini C, Giugni E, Mainero C, Giuliani S, et al. Brain atrophy in relapsing-remitting multiple sclerosis: relationship with ‘black holes’, disease duration and clinical disability.
Peterson JW, Bo L, Mork S, Chang A, Trapp BD. Transected neurites, apoptotic neurons, and reduced inflammation in cortical multiple sclerosis lesions.
Rivers TM. Observations on the attempts to produce acute-disseminated encephalomyelitis in monkeys.
Schreiber K, Sorensen PS, Koch-Henriksen N, Wagner A, Blinkenberg M, Svarer C, et al. Correlations of brain MRI parameters to disability in multiple sclerosis.
Stephan H, Baron G, Schwerdtreger WK. The brain of the common marmoset (Callithrix jacchus): a stereotaxic atlas. Berlin: Springer Verlag;
Taylor I, Butzkueven H, Litewka L, MacGregor LR, Szoeke C, Cook M, et al. Serial MRI in multiple sclerosis: a prospective pilot study of lesion load, whole brain volume and thalamic atrophy.
Uccelli A, Giunti D, Capello E, Roccatagliata L, Mancardi GL. EAE in the common marmoset Callithrix jacchus.
Author notes
1Department of Clinical Neurology, University of Oxford, Oxford, UK and 2Laboratory of Diagnostic Radiology Research, National Institutes of Health, Bethesda, MD, USA

