


Abstract
Although communication and social difficulties in autism have received a great deal of research attention, the other key diagnostic feature, extreme repetitive behaviour and unusual narrow interests, has been addressed less often. Also known as ‘resistance to change’ this may be related to atypical processing of infrequent, novel stimuli. This can be tested at sensory and neural levels. Our aims were to (i) examine auditory novelty detection and its neural basis in children with autism spectrum conditions (ASC) and (ii) test for brain activation patterns that correlate quantitatively with number of autistic traits as a test of the dimensional nature of ASC. The present study employed event-related fMRI during a novel auditory detection paradigm. Participants were twelve 10- to 15-year-old children with ASC and a group of 12 age-, IQ- and sex-matched typical controls. The ASC group responded faster to novel target stimuli. Group differences in brain activity mainly involved the right prefrontal–premotor and the left inferior parietal regions, which were more activated in the ASC group than in controls. In both groups, activation of prefrontal regions during target detection was positively correlated with Autism Spectrum Quotient scores measuring the number of autistic traits. These findings suggest that target detection in autism is associated not only with superior behavioural performance (shorter reaction time) but also with activation of a more widespread network of brain regions. This pattern also shows quantitative variation with number of autistic traits, in a continuum that extends to the normal population. This finding may shed light on the neurophysiological process underlying narrow interests and what clinically is called ‘need for sameness’.
Introduction
Autism spectrum conditions (ASC) are diagnosed when an individual demonstrates difficulties in communication and social interaction, alongside extremely repetitive and unusual restricted behaviours and interests. Although the first two features have been extensively studied (Frith and Frith, 1999), the ‘need for sameness’ (Kanner, 1943) or ‘resistance to change’ has received little research attention. In the highly unpredictable social world, resistance to change can lead to major behaviour problems such as tantrums as the individual tries to resist others saying or doing things unexpectedly or if events occur unexpectedly (Baron-Cohen, 2006a). Resistance to change is independent of IQ and is present in individuals with ASC at all ages (Kobayashi and Murata, 1998). Although of major importance for understanding autism, the psychophysiological mechanisms underlying such phenomena remain poorly understood.
Repetitive behaviour has recently been conceptualized as a consequence of hyper-systemizing (Baron-Cohen, 2006a), a process in which superior attention to detail aids in identifying lawful relationships that predict the behaviour of rule-based systems. The superior attention to detail in autism is evident not only using cognitive performance measures (O’Riordan and Passetti, 2006) but also in the unusual sensory behaviours characteristic of ASC, expressed in the auditory modality by paradoxical responses to sounds (Khalfa et al., 2004). Several behavioural studies focused on auditory attention processes and revealed enhanced pitch processing (Bonnel et al., 2003; Mottron et al., 2006; Heaton et al., 2008). However none of these studies used functional exploration techniques to study the brain mechanisms underlying such high-level processes. In contrast, hypo-reactivity to noises has also frequently been reported (Rosenhall et al., 1999). As no major dysfunction of the auditory system has been demonstrated in people with autism (Kellerman, 2005), the reason for such inconsistent responding to sensory stimuli in autism is still a matter of discussion.
Event-related brain potential (ERPs) and behavioural studies suggest that attentional patterns are more important in explaining such responses (Allen and Courchesne, 2001) and that the variability in attentional focus in patients (Burack, 1994) may help to explain these apparently inconsistent aspects of the clinical presentation of autism. Allen and Courchesne (2001) concluded that in certain contexts it is possible to elicit performance on tests of selective attention that is within normal limits or is even superior. This has been shown in several behavioural studies (Plaisted et al., 1998; Townsend et al., 2001).
Taken together, these observations suggest that patients with autism manifest unusual processing of infrequent events, rooted in a basic difference in how the brain orients to changing, novel sensory stimuli. This difference might underlie the ‘need for sameness’ characteristic of ASC. The fMRI study reported below aims to test the neural basis of such atypical change processing.
The neural basis of change detection has been studied using the ‘novelty oddball’ paradigm in which typically three classes of stimuli are presented, one occurring frequently (‘standard’ stimulus) and the others, being either ‘deviant’ or ‘novel’, occurring infrequently. In the ‘active oddball’ paradigm, subjects are required to detect and respond to one of the infrequent stimuli, defined as the target.
Most ERP studies have shown abnormal responses associated with the processing of auditory oddball stimuli in ASC. For instance, the P3 amplitude in response to novel target stimuli is overall decreased in ASC and highly variable across trials (Novick et al., 1980; Niwa et al., 1983; Courchesne et al., 1985; Dawson et al., 1988; Oades et al., 1988; Lincoln et al., 1993; Kemner et al., 1995; Čeponienė et al., 2003). However, the underlying neural processes and brain location of these differences remain unknown. fMRI offers the potential to localize the subcortical and cortical anatomical structures in which these effects may occur.
Auditory change detection has been studied with fMRI in typical adults using the classical oddball paradigm (Menon et al., 1997; Linden et al., 1999; Opitz et al., 1999; Stevens et al., 2000; Horovitz et al., 2002; Mulert et al., 2004; Brazdil et al., 2005). These studies demonstrate the involvement of a wide network during target detection (Kiehl et al., 2005). This network includes the inferior and middle frontal gyri; the insula; the inferior and superior parietal lobules; the inferior, middle and superior temporal gyri; the cingulate cortex; the thalamus; the caudate nucleus; the amygdala–hippocampal complex and the cerebellum. As far as we know, no fMRI study of auditory novel target detection in ASC has been reported to date.
In a recent fMRI study (Gomot et al., 2006), we found lower brain activation in children with ASC during passive listening to deviant and novel stimuli. This hypo-activation was assumed to reflect reduced orientation towards novelty observed in people with ASC. However, as mentioned before, clinical observations report both hypo- and hyper-reactivity to acoustically changing events, these paradoxical reactions possibly being related to attentional mechanisms. The aim of the present study was to investigate novelty detection in children with ASC when attention is actively oriented towards the changing events. The study used fMRI to characterize brain regions involved in the detection of novel target sounds in children with ASC.
The second objective of this study was to assess brain activation patterns that correlate quantitatively with number of autistic traits as a test of the dimensional nature of ASC (Baron-Cohen et al., 2001; Constantino and Todd, 2005). Adaptation to change is important, particularly when dealing with unpredictable, quickly changing information. Abnormalities in change detection could have major repercussions on every aspect of life, whether adapting to changing physical or social events. We aimed to test if there is a correlation between number of autistic traits and brain activations during novelty detection. Finding such a correlation would suggest that autism, as measured by these traits, is quantitative rather than categorical, a view that would easily accommodate the existence of partial syndromes such as the Broader Autism Phenotype (Piven et al., 1997). The logical extension of this quantitative, dimensional view is that there is not just a Narrow Autism Phenotype and a Broader Autism Phenotype but a dimension of autistic traits that run right through the population. Such a dimension has been quantified with instruments such as the Social Responsiveness Scale (Constantino and Todd, 2003) and the Autism Spectrum Quotient (Baron-Cohen et al., 2001).
To measure change detection, we chose a variation of the novelty oddball paradigm in which the novel stimuli, rather than the ‘deviants’, are defined as targets. This method allows one to investigate response to task-relevant, novel stimuli when these stimuli are actively attended. As this task was intended to be very simple, we chose to target the novel stimuli that are more salient than the deviants and thus easier to detect. We predicted activations common to both groups in regions associated with target detection but group differences in parietal and prefrontal regions subserving selective attention.
Methods
Participants
Twelve male children with ASC (three with Asperger syndrome/nine with high-functioning autism) and 12 typically developing children matched for sex, age and IQ participated in the experiment (Table 1). Children were 10–15 years old and were all right-handed. Participants with ASC were recruited through the Cambridge University Autism Research Centre volunteer database (www.autismresearchcentre.com). They all had clinical diagnoses based on Diagnostic and Statistical Manual of Mental Disorders (DSM-IV-TR) criteria (APA, 2000) and diagnosis was confirmed using the Autism Diagnostic Interview-Revised (Lord et al., 1994). Controls were recruited in the schools around Cambridge city and had no family history of ASC. Mean full-scale IQ scores based on the Wechsler Abbreviated Scale of Intelligence (1999) did not differ between the ASC (Full Scale IQ range: 89–150) and the control group (111–132) [t(22) = −1.04, P = 0.3, NS].
Characteristics of the population studied (mean ± SD)
| ASC group | Control group | |
|---|---|---|
| Age (year, Month) | 13.5 ± 1.6 | 13.8 ± 1 |
| ADI-R total score | 46 ± 15 | NA |
| Repetitive behaviours | 7 ± 2 | NA |
| Communication | 17 ± 6 | NA |
| Social interaction | 20 ± 7 | NA |
| Full Scale IQ | 116 ± 18 | 121 ± 8 |
| Verbal IQ | 118 ± 17 | 122 ± 10 |
| Performance IQ | 109 ± 16 | 116 ± 9 |
| Autism quotient (Adol) | 37.6 ± 6.2 | 13.8 ± 7.7 |
| Social skill | 8.7 ± 1.2 | 1.4 ± 2.5 |
| Attention switching | 8.8 ± 1.8 | 3.9 ± 2.7 |
| Attention to detail | 6.3 ± 2.4 | 4.7 ± 2.5 |
| Communication | 8.3 ± 1.7 | 1.6 ± 1.4 |
| Imagination | 5.6 ± 2.4 | 2.2 ± 2.1 |
ADI-R = Autism Diagnostic Interview-Revised; NA = Not applicable.
Parents/carers of each child were asked to complete the Adolescent version of the Autism Spectrum Quotient (AQ-Adol) (Baron-Cohen et al., 2006b), a questionnaire developed to quantify autistic traits in teenage samples. It is closely based on the adult Autism Spectrum Quotient (Baron-Cohen et al., 2001; Wheelwright et al., 2006), which has been validated against clinical diagnosis (Woodbury-Smith et al., 2005), and shows a similar psychometric profile. The pattern of group differences (Asperger syndrome versus controls) of the AQ-Adol has been replicated cross-culturally (Wakabayashi et al., 2007). It is a useful instrument, comprising 50 questions, for rapidly quantifying how many autistic traits a given individual child has, on the view that everyone has some autistic traits and that those who receive a diagnosis tend to have more of these traits. AQ-Adol total scores in the ASC group were all above the cut-off for autism (>30) and significantly higher than in the control group [t(22) = −8.33, P = 0.0001].
Participants with hearing abnormality (as assessed by a subjective audiometric task) or any infectious, metabolic or neurological disorders, or contraindication for MRI were excluded. No child was on medication at the time of the scanning session and all were free of psychotropic drugs for a period of at least 2 months before the study. The study was approved by the Addenbrooke's NHS Trust Local Research Ethics Committee (reference number: 02/266). Written informed consent was obtained from the parents or guardians of the subjects, according to the Declaration of Helsinki, and from the children themselves.
Auditory stimuli and experimental paradigm
Change detection processes were studied using an oddball paradigm with three types of stimuli, using an event-related fMRI design. Auditory sequences, including ‘Standard’ (probability of occurrence: P = 0.82), ‘Deviant’ (P = 0.09) and ‘Novel’ sounds (P = 0.09, targets), were delivered binaurally through non-ferromagnetic headphones. The Standard repetitive stimulus was a three-partial sound composed of three frequencies (sinusoids: 500, 1000 and 1500 Hz), with the second and third components 3 and 6 dB, respectively, lower in intensity than the first component. The Deviant sound differed from the Standard by a 30% change in frequency of all partial components (components: 650, 1300 and 1950 Hz). The Standard and Deviant sounds were similar to those used in previous ERP and fMRI studies of deviance processing (Tervaniemi et al., 2000; Opitz et al., 2002). The Novel sounds differed from the Standard sounds with regard to their frequency composition, basic frequencies and frequency transitions. They were originally sampled from a musician's keyboard and digitally prepared for stimulation purposes using the CoolEdit© sound editor. The resulting stimuli were always novel non-identifiable complex sounds, each with a different frequency composition. These novel sounds were kindly provided by B. Müller (Müller et al., 2002).
All sounds had an overall intensity of 85 dB SPL and a duration of 80 ms. Stimuli were presented with a constant stimulus onset asynchrony of 625 ms, in pseudorandom order with the constraints that the first five stimuli were Standard sounds and that each Deviant or Novel stimulus was preceded by at least three Standard sounds. The total number of stimuli was 668, including 58 Deviants and 58 Novels. Six ‘Resting’ periods of 10 s each (with no auditory stimuli) were interspersed, including one at the beginning and one at the end of the auditory sequence.
Subjects were asked to respond to the target stimuli (the Novel sounds) by pressing a button with the right index finger as quickly as possible and were told that accuracy was more important than speed. Prior to entering the scanning room, each participant performed a short practice to ensure they understood the instructions.
Exact instructions were as follows: ‘In this task, you will hear three types of sounds: one with a low-pitch, one with a slightly higher pitch and other sounds that will be more unusual and that will always change. What you have to do is to press the button as soon as possible with your right index finger each time you hear an unusual sound. I would prefer you to be accurate rather than quick’.
Behavioural measures
The reaction time (RT) to target stimuli, the percentage of hits and percentage of false alarms to non-target stimuli were used for behavioural analysis.
fMRI procedure
Data acquisition
Magnetic resonance data were acquired on a 3T whole-body system consisting of a Bruker Medspec 30/100 spectrometer (Ettlingen, Germany) and a 910 mm bore whole-body actively shielded magnet (Oxford Magnet Technology, Oxford, UK). Functional images were collected using T2*-weighted gradient-echo echo-planar imaging, with TR = 2.5 s, TE = 27.5 ms, flip angle = 82°. The acquisition volume consisted of 20 oblique-axial slices, with slice thickness = 4 mm and interslice gap = 1 mm. The matrix was 64 × 64 with a 20 cm field of view, yielding in an in-plane resolution of 3.125 × 3.125 mm. Two-hundred volumes were acquired for each participant.
Image pre-processing
fMRI data were analyzed using statistical parametric mapping software (SPM2, Wellcome Department of Cognitive Neurology, London, http://www.fil.ion.ucl.ac.uk/spm/software/spm2/). Functional volumes were time-corrected, motion-corrected by spatial realignment to the first volume and normalized to the MNI reference brain (courtesy of the Montreal Neurological Institute). The normalized functional images were then spatially smoothed with an 8 mm full-width half-maximum Gaussian kernel.
Statistical analysis
The statistical analysis of the variations of the BOLD signal was based on the application of the general linear model to time series of the task-related functional activations (Friston et al., 1995). Trials for all three events (Target Novel, Deviant and Standard) were modelled separately by a canonical haemodynamic response function and its first-order temporal derivative. Only the brain activation associated with novel target sounds is presented here. Contrast images (Novel minus Standard) consisting of statistical parametric maps (SPMs) of t-statistics at each voxel were then estimated for each individual. These SPM{t} were entered into a second level group analysis to create an SPM{F} (i.e. a mixed-effects or ‘random effects’ analysis). SPM{F} statistics including both the haemodynamic response function and its temporal derivative (corrected for non-sphericity) were thus computed to examine areas of activation for the group as a whole (Control+ASC), with a threshold of P < 0.001, false discovery rate (FDR) corrected for multiple comparisons. Between-group differences were evaluated in a similar manner by computing the SPM{F} statistics thresholded at P < 0.001, uncorrected. For each analysis, the F-statistic was subsequently converted to a standard normal z-statistic for reporting. Error trials were modelled separately in the imaging analysis and the results reported include only those trials on which participants performed correctly.
Finally, we tested for any correlation between the brain responses to Novel targets and clinical and behavioural measures (AQ-Adol, IQ, RT and accuracy) by performing a whole-brain regression analysis on contrast images of interest (Novel-Standard), using the questionnaire scores (n = 24) and performances from each participant entered as an independent linear parametric covariates (in a second level SPM design matrix).
Between-group correlation coefficients were then compared according to standard statistical methods by computing in each group separately the signal change in the brain regions found to be significant in whole-brain regression analysis (sphere of 10 mm diameter centred on the peak coordinate of each significant cluster, corrected for small volume, P < 0.05) and clinical and behavioural measures.
The locations of significant activations and correlations were expressed in Talairach coordinates, using the non-linear transformation procedure developed by M Brett (mni2tal: http://www.mrc-cbu.cam.ac.uk/Imaging/Common/mnispace.shtml).
Results
Behavioural results
Although both groups performed the task well, children with ASC responded more quickly than controls. Mean RT in correct response to novel targets differed significantly between the ASC (mean ± SD; 446 ± 56) and control (527 ± 109) groups [t(22) = −2.23; P = 0.03]. Both groups committed few errors of commission (CTRL: 0.70% ± 0.60; ASC: 0.71% ± 0.58) and the two groups did not differ in the percentage of correct responses (CTRL: 90% ± 7; ASC: 89% ± 7).
Activation common to both groups
The contrast between Novel target and Standard sounds produced significant activation in multiple brain regions in an analysis of data from both groups combined (Table 2, Fig. 1A). Regions activated in both groups included the bilateral superior and middle temporal gyri (BA41, 42, 22), the bilateral superior frontal gyrus (BA8), the right inferior parietal lobule (BA40), the right posterior cingulate, the left anterior and middle cingulate (BA32, 24), the thalamus, the left putamen and the left postcentral and precentral gyri (BA1, 3, 4). Novel target sounds also elicited activation of the left fusiform gyrus (BA37), the right cuneus and the left insula. Family Wise Error (FWE) was also used used for very large clusters (see Table 2, first cluster) and showed similar results.
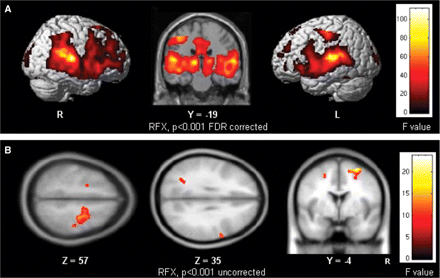
(A) Group activation map showing brain regions activated on average over all subjects (N = 24; Control + ASC) by processing Novel target sounds compared with Standard sounds. Voxels with activation significant at P < 0.001 (F = 9.62), FDR corrected for multiple comparisons are shown; R = right hemisphere; L = left hemisphere and (B) Group difference map showing brain regions differentially activated between groups (Control < ASC; N = 12 in each group) by processing of Novel target sounds compared with Standard sounds. Voxels with activation significant at P < 0.001 (F = 8.12) are shown.
Main regions demonstrating significant activation by Novel targets compared with Standard sounds in all subjects (N = 24; Control + ASC; P < 0.001, FDR corrected)
| Cluster size | Brain region | BA | Z score | Talairach coordinates | |||
|---|---|---|---|---|---|---|---|
| Nov > Sta | 50230 | L Thalamus | NA | >8 | −14 | −15 | 6 |
| L Superior Temporal Gyrus | BA41/42 | >8 | −45 | −27 | 10 | ||
| L Superior Temporal Gyrus | BA41 | >8 | −47 | −23 | 12 | ||
| R Superior Temporal Gyrus | BA42 | >8 | 59 | −21 | 10 | ||
| R Superior Temporal Gyrus | BA22 | >8 | 53 | −38 | 17 | ||
| L Superior Temporal Gyrus | BA42 | >8 | −55 | −25 | 12 | ||
| L Superior Temporal Gyrus | BA22 | >8 | −59 | −30 | 11 | ||
| L Superior Temporal Gyrus (sill) | BA41/42 | 7.84 | −40 | −27 | 5 | ||
| R Superior Temporal Gyrus (GTT) | BA41 | 7.7 | 40 | −30 | 11 | ||
| R Inferior Parietal Lobule (IPL) | BA40 | 7.56 | 47 | −32 | 24 | ||
| R Superior Frontal Gyrus | BA8 | 7.54 | 6 | 27 | 35 | ||
| L Insula | NA | 7.47 | −36 | −4 | 7 | ||
| R Superior Temporal Gyrus/IPL | BA22/40 | 7.4 | 61 | −48 | 21 | ||
| R Thalamus | NA | 7.23 | 16 | −19 | 10 | ||
| L Cingulate | BA32 | 7.1 | −4 | 4 | 42 | ||
| R Middle Temporal | BA21 | 7.06 | 48 | −22 | −9 | ||
| R Posterior Cingulate | BA23/31 | 6.97 | 8 | −30 | 25 | ||
| L Median Frontal Gyrus (SMA) | BA8 | 6.96 | 2 | 24 | 45 | ||
| R Superior Temporal Gyrus | BA41 | 6.94 | 46 | −19 | 5 | ||
| L Middle Cingulate | BA24 | 6.92 | −4 | −10 | 43 | ||
| L Anterior Cingulate | BA32 | 6.92 | −6 | 17 | 34 | ||
| L Putamen | NA | 6.85 | −30 | −13 | 8 | ||
| R Cuneus/Lingual Gyrus | BA17 | 6.8 | 20 | −68 | 7 | ||
| L Sup/Middle Temporal Gyrus | BA22/21 | 6.74 | −55 | −18 | −6 | ||
| R Superior Temporal Gyrus | BA22 | 6.72 | 57 | −17 | 1 | ||
| L Medial Frontal Gyrus | BA6 | 6.71 | −2 | 4 | 51 | ||
| 1434 | L Postcentral sill | BA1/3 | 7.63 | −40 | −15 | 50 | |
| L Precentral Gyrus sill | BA3/4 | 7.03 | −30 | −25 | 51 | ||
| L Middle Frontal Gyrus | BA6 | 4.26 | −26 | 1 | 55 | ||
| 308 | L Superior Frontal Gyrus | BA10 | 4.95 | −34 | 46 | 23 | |
| 30 | L Middle Frontal Gyrus | BA10 | 4.88 | −38 | 48 | −9 | |
| L Middle Frontal Gyrus | BA10 | 3.63 | −40 | 47 | 1 | ||
| 29 | L Inf Temporal Gyrus/Fusiform | BA37 | 4.28 | −46 | −51 | −16 | |
| L Fusifom Gyrus | BA37 | 3.72 | −42 | −44 | −16 | ||
Activation common to both groups.
P<0.001. FDR corrected; L = left; R = Right; Nov = Novel; Sta = Standard; BA = Brodmann Area; NA = Non applicable.
Activation differences between groups
The F-test directly comparing the pattern of activation elicited by novel targets revealed six significant clusters relatively more active in the ASC group than the control group ([(Novel-Standard)ASC − (Novel-Standard)Control], Table 3, panel A, Fig. 1B). The main group difference in response to novel targets compared to standard stimuli was found in the right superior/middle and inferior frontal gyrus (BA6, BA44) and the right pre- and post-central gyri (dorsal premotor cortex) (BA3/4). Group comparison also revealed stronger activation in the left inferior parietal lobule (BA40, intraparietal sulcus) and in the left middle frontal gyrus (BA6) in ASC compared to controls. A difference of activation was found in the right caudate for the reverse comparison [(Novel-Standard)Control−(Novel-Standard)ASC].
Panel A: Brain locations of a significant between-group difference in response to Novel target sounds (N = 12 in each group; P < 0.001, uncorrected) and Panel B: Positive correlation between signal change for the Novel-Standard contrast and AQ-Adol score in all subjects (N = 24; Control + ASC, P < 0.001, uncorrected)
| Cluster size | Brain region | BA | Z score | Talairach coordinates | |||
|---|---|---|---|---|---|---|---|
| Panel A | 419 | R Middle Frontal Gyrus | BA6 | 5.2 | 28 | −1 | 55 |
| Nov > Sta significant group difference (ASC>>Control) | R Superior Frontal Gyrus | BA6 | 5.14 | 20 | −3 | 55 | |
| R Precentral Gyrus | BA4 | 4.97 | 32 | −11 | 54 | ||
| R Precentral Gyrus | BA4 | 4.97 | 38 | −7 | 56 | ||
| R Middle Frontal Gyrus | BA6 | 3.97 | 30 | −5 | 46 | ||
| 100 | R Postcentral Gyrus | BA3 | 4.15 | 44 | −19 | 47 | |
| 42 | R Inferior Frontal Gyrus | BA44 | 4.07 | 59 | 5 | 24 | |
| 99 | L Inferior Parietal Lobule (sill) | BA40 | 3.82 | −32 | −60 | 32 | |
| L Inferior Parietal Lobule | BA40 | 3.65 | −34 | −53 | 36 | ||
| 20 | L Middle Frontal Gyrus | BA6 | 3.58 | −20 | 1 | 50 | |
| (Control >>ASC) | 33 | R Caudate | NA | 3.82 | 4 | 16 | 8 |
| Panel B | 229 | R Middle Frontal Gyrus | BA6 | 4.61 | 28 | −1 | 56 |
| Positive Correlation between signal change and AQ score | 56 | R Inferior Frontal Gyrus | BA44 | 4.34 | 57 | 5 | 25 |
| 28 | L Middle Cingulate Gyrus | BA24 | 4.01 | −2 | 2 | 42 | |
| 28 | L Superior Parietal Lobule | BA7 | 3.67 | −19 | −51 | 54 | |
| 27 | L Superior Temporal Gyrus | BA22 | 3.57 | −49 | −6 | −1 | |
P<0.001, uncorrected.
L = left; R = Right; Nov = Novel; Sta = Standard; BA = Brodmann Area; NA = Non applicable.
Further analyses were performed in the brain regions evidenced in the direct group comparison in order to better characterize the effects observed. The signal change values of each subject for the Standard-Rest and Novel-Rest contrasts were extracted (sphere of 10 mm diameter centred on the peak coordinate of each significant cluster, corrected for small volume) and then entered in a Group (ASC, Control) × Stimulus (Standard, Novel) ANOVA.
Results showed main group effects (ASC > Control) for the right and left middle frontal gyri (P = 0.004 and P = 0.006 respectively) and also Group × Stimuli interactions. Post hoc (Newman–Keuls) analysis indicated greater activations in ASC than in Controls for the Novel stimuli and greater differences in the signal change between Standard and Novel in ASC than in Controls. For the right postcentral gyrus, the inferior frontal gyrus and the left inferior parietal lobule, only a Group × Stimulus interaction was observed due to greater difference in signal change between Standard and Novel in the ASC group than in Controls. In all these regions, no significant group differences were observed for the Standard stimuli.
In the right caudate, results showed a main group effect with Controls displaying greater activation than ASC (P = 0.000), this effect being more marked for the Novel stimuli (Group × Stimulus interaction).
Correlations between neural and clinical data
As a dimensional approach onto measuring autistic traits, a whole-brain regression analysis was performed on the Novel-Standard contrast images in all participants using the AQ-Adol score as covariate (n = 24). Results showed significant positive correlations not only in regions that were significant in the between-group comparison for the Novel-Standard contrast (the right middle and inferior frontal gyri) but also in the left middle cingulate, superior parietal lobule and superior temporal gyrus (Table 3, panel B). No correlations were found between brain activity and IQ, or RT or percent of correct responses or false alarms.
As the most robust group difference associated with novel target detection was located in the right superior/middle frontal gyrus (BA6), further examination of the correlation between signal change in this region and behavioural measures was performed. Standard correlation analysis confirmed that the degree of activation measured in the right superior/middle frontal gyrus in the whole population was highly positively correlated with the AQ-Adol scores (n = 24; r = 0.83, P < 0.0001) (Fig. 2).
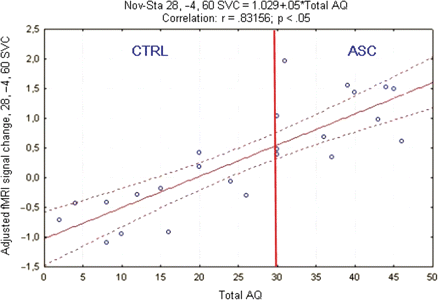
Plot of correlation between percent MR signal change in the superior frontal gyrus and Autism-Spectrum Quotient-Adolescent version (AQ-Adol) during novel target detection for all subjects. AQ-Adol cut off for autism = 30 (red line); Nov = Novel; Sta = Standard; SVC = Small Volume Correction.
Correlation analysis performed in each group separately (Control: n = 12; ASC: n = 12) indicated a similar trend in the two populations, with correlation coefficients just below significance (probably due to small sample sizes). Moreover, no significant difference was found between the correlation coefficient in the control (r = 0.57; P = 0.053) and the ASC group (r = 0.22; P = 0.4) (Fisher's z′ = 0.9, P = 0.3) and when an outlier was removed from the analysis, the correlation coefficient in the autism group reached 0.51 (P = 0.1), a value similar to that in controls.
Discussion
This study is the first to use functional neuroimaging to determine which brain regions are involved in the active detection of novel auditory stimuli in children with ASC. Results showed atypical brain activation associated with novelty detection in ASC. People with ASC displayed stronger activation in the prefrontal and inferior parietal cortices than controls, both regions well known for being involved in selective attention. Likewise, performance during target detection was better in children with ASC. Those with a diagnosis were faster than controls to detect novel targets, with similar accuracy.
Courchesne et al. (1985) showed lower accuracy and a trend towards longer RTs in response to auditory target deviants in ASC. However, the present study's sample was higher functioning than that of Courchesne et al. and the targets were novel stimuli, whose greater salience in comparison to deviant stimuli could have facilitated detection and response selection in the ASC group. Moreover, shorter RT in response to novel targets has later been reported in autism in the visual modality (Plaisted et al., 1998; Townsend et al., 2001).
The apparent discrepancy between results from ERP studies (Courchesne et al., 1985; Kemner et al., 1995; Čeponiene et al., 2003) showing decreased P3 amplitude in response to targets in autism and our fMRI findings of increased activation might be explained by several factors including the paradigm and the method used, as well as the subject population studied. Indeed, it remains difficult to relate haemodynamic activity to specific ERP components as the former reflects a temporally coarser measure that cannot be separated into different parts.
Thus, the fMRI activation elicited by target detection is assumed to reflect the electrical activity corresponding to both the N2 (especially N2b) and the P3 wave (Kiehl et al., 2005). N2b is evoked when any infrequent stimulus is attentively detected as being different from the regular stimuli, whether or not a decision about the changing sounds is required by the task (Näätänen, 1982; Novak et al., 1990). P3b reflects brain functions associated with context and memory updating; it is a measure of allocation of attentional resources, stimulus evaluation and response selection (Donchin and Coles, 1988; Polich and Kok, 1995). The different pattern of brain activation in autism might be related to the N2b process and may thus reflect the allocation of attention towards the infrequent stimuli rather than the selection of a response.
In addition, we tested a group of high functioning adolescents with autism (aged 10–15 years). Comprehensive analysis of ERPs according to population characteristics previously showed that P3 in response to targets was diminished in amplitude in low-functioning autism only (Salmond et al., 2007). Differences in the responses according to age have also been reported, with diminished P3 amplitude in children with autism but normal P3 amplitude in adolescents with autism, who display increased Processing Negativity (reflecting early selective attention) compared to controls (Hoeksma et al., 2006). This might explain why we found greater activation in response to novel targets in our group of subjects with ASC, since ours were adolescents. Lastly, it is unknown whether the enhancement of the BOLD response in a particular region reflects active inhibition or higher activation of this region.
Combining data from both groups, significant activation was seen during novel target detection in superior and middle temporal gyri, superior frontal gyrus, inferior parietal lobule, cingulate, thalamus, putamen and left post- and pre-central gyri. This pattern from the whole adolescent sample is very similar to findings from target detection studies in typical adults (Stevens et al., 2000; Horovitz et al., 2002; Brazdil et al., 2005; Kiehl et al., 2005) where deviants were defined as the targets.
The group comparison during novel target detection showed higher activations in the right prefrontal region and the left inferior parietal region (mainly intraparietal sulcus) in the autism group. Consistent with a previous fMRI oddball study (Kiehl et al., 2005), target detection that requires a manual response with the right index finger was associated with stronger contralateral (left) thalamic and pre- and post-central gyrus activity. However, the activity recorded in response to novel target stimuli in the right superior and middle frontal region in the ASC group was beyond the motor component of target detection. Müller et al. (2004) reported such hyper-activation of the premotor cortex ipsilateral to the side of movement in ASC during a visuomotor learning task. Their interpretation was that the premotor cortex plays an unusual role in visuomotor learning in autism. However, our findings suggest that even during a simple auditory target detection task, people with ASC recruit brain regions that are usually not involved in such a task (and might thus employ a different strategy). An alternative possibility is that motor responses of ASC children may be less well lateralized, or that any active task results in increased activation in these patients.
These findings corroborate previous evidence of structural and functional differences in the prefrontal region. Indeed, impairment in frontal circuitry and its connectivity to other regions have been repeatedly associated with autism (Ohnishi et al., 2000; Luna et al., 2002; Carper and Courchesne, 2005; Hazlett et al., 2005). More specifically, both structural and functional abnormalities of the dorsolateral prefrontal region have been found in individuals with autism (Kawasaki et al., 1997; Carper and Courchesne, 2000).
The left inferior parietal and right inferior and middle frontal areas are described as belonging to the same novelty-detection circuit. These are posited to have a major role in attention switching and in the distribution of attentional resources (Daffner et al., 2003). Intraparietal sulcus in particular is known to play a crucial role in orienting attention and in identifying targets in both visual (Corbetta et al., 2000) and auditory modalities (Mayer et al., 2006). The inferior parietal and premotor regions also belong to a network in which reduced white matter has been demonstrated in autism using DTI (Barnea-Goraly et al., 2004) and atypical functioning of this fronto-parietal network has previously been reported in autism during a visual attention task (Belmonte and Yurgelun-Todd, 2003).
It should be noted that interpretation of differences in brain activation between two groups remains difficult when the behavioural measures are not equated. Thus, one cannot exclude that some of the brain activity differences observed may arise part from comparison of two haemodynamic response functions that are out of synchrony with each other (the ASC one possibly being ahead of the controls).
Analysis of the correlations between clinical assessment and brain activation in response to novelty detection revealed that signal change measured in the right prefrontal, left middle cingulate and left superior parietal regions was positively correlated with score on the AQ-Adol. Children with ASC performed better on the task than controls and they recruited a larger network during novelty detection. However, this stronger brain activation was associated with greater difficulties in communication, socialisation and adaptation to the environment, as reflected by highest AQ-Adol scores. This relationship, even if not specific to repetitive symptoms, suggests atypical involvement of the fronto-parietal network in the physiology of autism. A similar tendency towards positive correlation between the number of autistic traits and brain activation was evidenced in both the autism and control groups, adding to the evidence for a continuum between the autism spectrum and the general population in terms of both brain functioning and behavioural expression (Baron-Cohen et al., 2001; Constantino and Todd, 2003). Only one subject with autism did not follow the pattern of the group, perhaps because of unusual brain activations or perhaps because of bias in his parents' ratings on the AQ-Adol.
The ASC participants in this study were quite high functioning and it is known that clinical signs of resistance to change vary according to the level of functioning. Clinical tools available at the moment mainly assess stereotyped and repetitive motor behaviours, which were not characteristics of our population. Further studies are needed to establish more precisely the relationship between resistance to change and brain activation.
Both the better performance (shorter RT) and the brain activity pattern observed in response to target novels are consistent with the idea of hyper-reactivity to sounds in autism (Gomot et al., 2002) and consequently with hyper-discrimination (Mottron et al., 2006). Enhanced discrimination ability has been demonstrated for both visual (O’Riordan et al., 2004) and auditory stimuli (Bonnel et al., 2003; O’Riordan et al., 2006). However, in the present study, no group differences were found in the sensory auditory regions for novel targets, suggesting that novel stimuli in autism receive equal degrees of sensory processing as in controls, but different attentional analysis.
This contention is supported by findings from our previous fMRI study, in which we used the same sounds as the present study but in a passive context, whilst subjects viewed a silent film. In this ‘no-task’ condition, the left intraparietal lobule in children with autism was found to be hypo-activated in response to novel stimuli (Gomot et al., 2006). Therefore, depending on the context (instruction), individuals with autism may have an abnormally narrow or an abnormally broad focus of attention. Our present findings indicate that when the instructions are clearly defined, children with autism manifest superior selective responding. Such a view could have important implications for teaching and intervention, as it implies that some autistic differences are a matter of learning style.
Conclusions
The ability to focus on selected sensory inputs whilst ignoring irrelevant inputs is a key feature of cognition. Hyper-selectivity has both positive and negative consequences. On the positive side, it enables unusually accurate systemizing, crucial in technical fields like computer science or mathematics. On the negative side, it can interfere with appropriate allocation of attention to novel relevant events or with adaptation to change. The current data show unusual activation of the inferior parietal and prefrontal regions that might contribute to people with ASC overfocusing on specific events when attention is actively directed towards the stimuli. This overfocused attention may be counterproductive during flexible social interactions and may play a role in the development of narrow patterns of interests or activities. Finally, high scores on the AQ-Adol were associated with an atypical pattern of activation in the frontoparietal network during novelty detection, raising the possibility of links between these brain regions and autistic traits. Though further studies are needed to establish precisely which brain systems relate to rigidity, these findings of atypical brain response to novel stimuli may illuminate the neurophysiological basis of autistic ‘resistance to change’.
Acknowledgements
This study was supported by grants from the Fondation pour la Recherche Médicale, the ‘Région Centre’ and the ‘Fondation d’Entreprise France Télécom’ (M.G.), Cure Autism Now (M.K.B.), Merck Sharp and Dohme Post-doctoral Fellowship award (F.A.B.) and the UK Medical Research Council (S.B.-C., E.T.B.). The Wolfson Brain Imaging Centre is supported by an MRC Cooperative Group grant. The authors thank José Alcantara and Matt Davis and most of all the participants and their parents for their contributions to this study.
References
Abbreviations:
- AQ-Adol
Adolescent version of the Autism Spectrum Quotient
- ASC
Autism spectrum conditions
- ERP
event-related brain potential
- RT
reaction time
- SPM
statistical parametric map

