


Abstract
The anti-cancer efficacy of grape seed extract (GSE) against prostate cancer (PCA) via its anti-proliferative, pro-apoptotic and anti-angiogenic activities in both cell culture and animal models have recently been described by us. GSE is a complex mixture containing gallic acid (GA), catechin (C), epicatechin (EC) and several oligomers (procyanidins) of C and/or EC, some of which are esterified to GA. To determine which components are most active against PCA, an ethyl acetate extract of GSE was separated by reverse-phase high-performance liquid chromatography (HPLC) into three fractions. Fraction 1 was far more effective than others in causing growth inhibition and apoptotic death of human PCA DU145 cells. Of the components in this fraction, GA showed a very strong dose- and time-dependent growth inhibition and apoptotic death of DU145 cells, but C and procyanidins B1 (EC–C dimer), B2 (EC–EC dimer) and B3 (C–C dimer) were nearly ineffective. Mechanistic studies demonstrated a strong caspase-9, caspase-3 and poly (ADP-ribose) polymerase (PARP) cleavages by GA in DU145 cells. Procyanidin oligomers eluting in HPLC Fractions 2 and 3 were obtained in larger quantities by separating GSE into eight fractions (I–VIII) on a gel filtration column. All fractions were analyzed by HPLC-UV and negative-ion electrospray mass spectrometry. Fractions I–III contained the active compound GA and inactive components C, EC, B1 and B2. Fraction IV contained other dimers and a dimer–GA ester and was also less active than GSE in DU145 cells. Fractions V–VIII, however, caused significant growth inhibition and apoptosis with the highest activity present in the later fractions that contained procyanidin trimers and GA esters of dimers and trimers. Together, these observations identify GA as one of the major active constituents in GSE. Several procyanidins, however, and especially the gallate esters of dimers and trimers also may be efficacious against PCA and merit further investigation.
Introduction
Prostate cancer (PCA) is the most invasive and frequently diagnosed malignancy in males in the USA and, at present, is the second leading cause of cancer deaths in American males ( 1 ). The induction of human PCA has been viewed as a multistage process, involving progression from small, latent carcinomas of low histological grade to large, metastatic carcinomas of higher grade ( 2 – 4 ). Since the growth and development of PCA is initially androgen-dependent, androgen deprivation has been extensively explored as a strategy for PCA prevention and therapy ( 4 , 5 ). While PCA patients treated with androgen-deprivation therapy often have remission of their PCA, within a few years, tumor re-growth occurs, which is largely due to progression of initially androgen-dependent PCA cells to tumor cells that do not depend on androgen for their proliferation ( 6 , 7 ). At this stage of the disease, the uncontrolled growth and metastasis potential of malignant cells are extremely aggressive, and unfortunately, the prognosis is death of the patient ( 6 – 8 ). Taken together, it can be appreciated that additional approaches and strategies are needed to control initial phases of PCA development, as well as its progression to advanced and androgen-independent PCA.
One approach to reduce PCA incidence and associated mortality could be its prevention and/or therapeutic intervention by phytochemicals present in diet as well as those consumed as dietary supplements ( 9 – 11 ). In support of this approach, epidemiological studies have recommended increasing vegetables and fruit consumption to reduce cancer incidence, and have suggested that tomato-based foods may be especially beneficial in lowering PCA risk ( 12 – 14 ). Another epidemiological study has shown profound effects of selenium in human PCA reduction ( 15 ). With regard to pre-clinical efficacy studies, a plethora of literature exists advocating for both prevention and therapeutic intervention of PCA by several phytochemicals employed as pure compounds as well as crude mixtures ( 16 – 23 ). Grape seed extract (GSE) is one such mixture of several polyphenols mostly containing dimers, trimers and other oligomers of catechin (C) and epicatechin (EC) (also present in tea) and their gallate derivatives ( Figure 1 ) ( 24 , 25 ). The general term for grape seed polyphenols is procyanidins, which are marketed in the USA as ‘grape seed extract’ with 95% standardized procyanidins as dietary supplement owing to its several health benefits. In addition to grape seeds, procyanidins are a diverse group of polyphenolics that are also abundant in blackjack oak, horse chestnut, witch hazel and hawthorn, as well as in apples, berries, barley, bean hulls, chocolate, rhubarb, rose hips and sorghum (refs 26 – 28 and references therein).
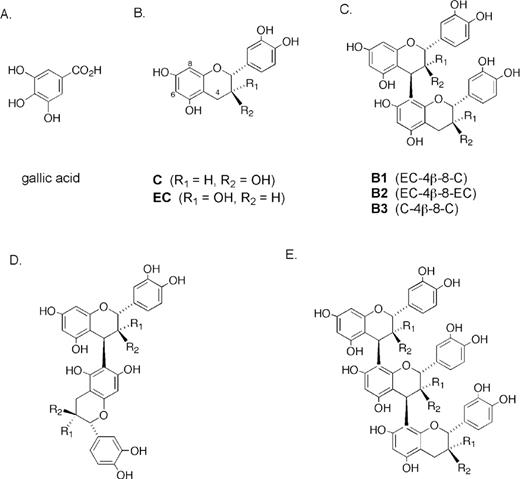
Structures of GA and procyanidins discussed in the text. ( A ) GA; ( B ) C, and EC; ( C ) B1, B2 and B3 are procyanidin dimers of C and/or EC; ( D ) general structures of dimers with a 4β-6 interflavan linkage; and ( E ) procyanidin trimers with 4β-8 interflavan linkages. The OH group R 1 or R 2 may be esterified with GA, generally in the lower ring.
Recent studies have shown that GSE inhibits human breast carcinoma MCF-7, human lung cancer A-427 and human gastric cancer CRL-1739 cell growth ( 29 ); however, it was not effective on K562 chronic myelogenous leukemic cells, and enhanced growth and viability of normal human gastric mucosal and normal J774A.1 murine macrophage cells ( 29 ). More recent studies by us also showed that GSE inhibits growth, induces cell cycle arrest and causes apoptotic death in human breast MDA-MB468 and prostate DU145 carcinoma cells ( 30 – 32 ), which were further verified and confirmed in the studies by Katiyar et al . ( 33 ) with both similar and different cell lines. With regard to its anti-carcinogenic effects in animal models, oral feeding of 1% GSE in the diet was shown to inhibit intestinal adenoma formation in MIN mice ( 34 ), and topical application of GSE significantly prevented phorbol ester-mediated tumor promotion in chemical carcinogen-initiated mouse skin ( 35 , 36 ). Initial reports from our laboratory concerning the skin cancer preventive efficacy of GSE were further verified and confirmed recently by others showing that GSE inhibits ultraviolet B radiation-induced skin tumorigenesis ( 37 ). With regard to the in vivo efficacy of GSE against PCA, we recently reported that oral feeding of GSE strongly inhibits DU145 xenograft growth in nude mice ( 38 ). Overall, these reports suggest the presence of bioactive phytochemicals in the crude mixture of GSE that could be effective cancer preventive/therapeutic agents.
In order to identify the most active components of GSE we focused our efforts on the fractionation of GSE employing a combination of chromatographic separations and efficacy screening of the fractions. This work involved evaluations of growth inhibition and induction of apoptotic death of DU145 human prostate carcinoma cells in culture. These approaches are also intended to provide the groundwork for future efficacy and mechanistic studies with active compounds in GSE for PCA in particular, and other cancers in general.
Materials and methods
GSE and chemicals for analytical work
GSE used in the present study was obtained from Traco Labs (Champaign, IL). To avoid batch-to-batch (or lot-to-lot) variation in GSE preparations and to achieve consistency in our analytical and efficacy studies, we obtained a large quantity of a single batch of GSE for use in all studies ( 38 ). GSE (1.0 g) was dissolved in 8 ml of water and extracted twice with 8 ml of ethyl acetate. Extracts were combined and evaporated under reduced pressure on a rotary evaporator to yield ∼0.5 g of material used for all the work described herein. Analysis of the residual water-soluble material demonstrated essentially the same compounds observed in the ethyl acetate fraction, thereby indicating that the extraction was not highly efficient. Furthermore, biological activity of the aqueous fraction was similar to that of intact GSE, so the work described herein involves only the phenolic material extracted into the organic phase. Gallic acid (GA) and trifluoroacetic acid (TFA) were obtained from Aldrich (Milwaukee, WI), C and EC were from Sigma (St Louis, MO), dimers B1, B2 and B3 were purchased from Indofine Chemical (Hillsborough, NJ), and high-performance liquid chromatography (HPLC) grade solvents and ammonium acetate were obtained from Fisher Scientific (Pittsburgh, PA).
Chromatographic separations
The HPLC work was carried out on a HP 1090 instrument (Agilent Technologies, Wilmington, DE) equipped with a photodiode array detector set at 280 ± 20 nm and a 4.6 × 250 mm Prodigy 5 μ ODS-2 column (Phenomenex, Torrance, CA). Solvent A consisted of 0.1% TFA in water and solvent B was 0.1% TFA in acetonitrile at a flow rate of 1.0 ml/min. A gradient was utilized consisting of 8–20% B in A from 0 to 20 min and 20–50% B in A from 20 to 40 min. Semi-preparative HPLC was conducted with the same system, but substituting a 10 × 250 mm Prodigy ODS-2 column (Phenomenex) and a flow rate of 3.0 ml/min. All collections from the latter column were re-analyzed on the analytical HPLC column to assure sample integrity and then evaporated to dryness by freeze-drying. Samples were stored in the dark under argon at −20°C until tested for biological activity. Gel filtration chromatography was carried out as described previously ( 39 ) on Toyopearl HW-40S resin (Tosoh Biosep, Montgomeryville, PA) prepared according to the manufacturer's instructions. A slurry in methanol was loaded into a 25 × 400 mm glass column. Samples (250 mg) of ethyl acetate-soluble material extracted from aqueous solutions of GSE were dissolved in methanol, injected onto the column and eluted with methanol at a flow rate of 1.2 ml/min, and the effluent was monitored using a UV detector at 280 nm. The isolated fractions were re-analyzed by HPLC as described above, evaporated to dryness under vacuum at <40°C and stored in the dark under argon at −20°C until tested for biological activity.
Electrospray ionization liquid chromatography/mass spectrometry (LC/MS) analysis
HPLC separations were carried out on a 2.0 × 150 mm Prodigy 5 μ ODS-2 column (Phenomenex) at a flow rate of 0.20 ml/min. The mobile phase consisted of solvent A, 10 mM ammonium acetate in water, and solvent B, 10 mM ammonium acetate in acetonitrile, utilizing a gradient of 8–20% B in A from 0 to 20 min and 20–50% B in A from 20 to 30 min. Analyses were performed on an Agilent Technologies 1100 HPLC system interfaced to an Agilent-SL LC/MSD trap equipped with an electrospray ionization source and operated in the negative-ion mode. The nebulizer and collision gases were nitrogen and helium, respectively, with the former set at 20 psi and the instrument scanned over the mass range 250–1500 Da.
Cell line and other reagents
Human prostate carcinoma cell line DU145 was obtained from American Type Culture Collection (Manassas, VA). Cells were cultured in RPMI 1640 with 10% fetal bovine serum (Hyclone, Logan, UT) under standard culture conditions (37°C, 95% humidified air and 5% CO 2 ). RPMI 1640 and other culture materials were from Life Technologies (Gaithersburg, MD). Cleaved caspase-9, caspase-3 and poly(ADP-ribose) polymerase (PARP) primary antibodies, and peroxidase-conjugated secondary antibody were from Cell Signaling Technology (Beverly, MA). Annexin V/propidium iodide (PI) staining Vybrant Apoptosis Assay Kit2 was from Molecular Probes (Eugene, OR). ECL detection system was from Amersham (Arlington Heights, IL). Other chemicals were obtained in their commercially available highest purity grade.
Cell growth and death assays
DU145 cells were plated at 1 × 10 5 cells/60 mm plates under standard culture condition. After 24 h, cells were fed with fresh medium and treated with dimethyl sulfoxide (DMSO) alone (control) or GSE, its fractions or GA dissolved in DMSO at desired doses. DMSO concentration was the same for all treatments and did not exceed 0.1% (v/v). After 24, 48 or 72 h of treatment, cells were collected with brief trypsinization, washed with ice-cold PBS and counted in duplicate using a hemocytometer. Trypan blue dye exclusion was used to determine viable and dead cells.\
Quantitative apoptotic cell death assay
To quantify GSE and/or its fractions including GA-induced apoptotic death of DU145 cells, annexin V and PI staining was performed followed by flow cytometry, as described previously ( 32 ). Briefly, after treatment of cells with GSE, its fractions or GA at desired doses and time-points, both floating and attached cells were collected by brief trypsinization and washed with PBS twice and subjected to annexin V and PI staining using Apoptosis Assay Kit following the step-by-step protocol provided by the manufacture. The kit contains recombinant annexin V conjugated to fluorophores and the Alexa fluro 488 dye, providing maximum sensitivity. After staining, flow cytometry was performed for the quantification of both early (annexin V stained cells) and late (annexin V/PI stained cells) apoptotic cells.
Immunoblot analysis
Following desired treatments, total cell lysates were prepared in non-denaturing lysis buffer (10 mM Tris–HCl (pH 7.4), 150 mM NaCl, 1% Triton X-100, 1 mM EDTA, 1 mM EGTA, 0.3 mM phenyl methyl sulfonyl fluoride, 0.2 mM sodium orthovanadate, 0.5% NP-40 and 5 U/ml aprotinin). For lysate preparation, medium was aspirated and cells were washed twice with ice-cold PBS followed by incubation in non-denaturing lysis buffer for 20 min. Then, cells were scrapped and kept on ice for an additional 30 min, and finally cell lysates were cleared by centrifugation at 4°C for 30 min in a tabletop centrifuge. Protein concentrations in lysates were determined by the Lowry method using a Bio-Rad DC protein assay kit (Bio-Rad laboratories, Hercules, CA). For immunoblot analyses, 70–100 μg of protein lysates per sample were denatured in 2× SDS–PAGE sample buffer and subjected to SDS–PAGE on tris-glycine gel as needed. The separated proteins were transferred onto nitrocellulose membrane followed by blocking with 5% non-fat milk powder (w/v) in TBS (10 mM Tris, 100 mM NaCl, 0.1% Tween 20) for 1 h at room temperature or overnight at 4°C. Membranes were probed for the protein levels of cleaved caspase-9, caspase-3 and PARP as well as β-actin using specific primary antibodies followed by peroxidase-conjugated appropriate secondary antibody, and visualized by ECL detection system. The representative blots shown were reproducible in at least one additional independent experiment.
Statistical analysis
Autoradiograms of the immunoblots were scanned using Adobe Photoshop, Adobe System (San Jose, CA). Statistical significance of differences between control and treated samples were calculated by Student's t -test (SigmaStat 2.03). P < 0.05 was considered significant. Unless otherwise mentioned, all the data shown in the study for cell growth inhibition, cell death, quantitative apoptosis and immunoblotting are representative of two to three independent studies.
Results
Preliminary fractionation of GSE by HPLC
Reversed-phase HPLC analysis of ethyl acetate-soluble material from GSE yielded the chromatogram shown in Figure 2 demonstrating a profile similar to that observed in earlier work ( 36 ). Three fractions labeled F1–F3 were collected, and the effects of equal doses on growth and death as well as apoptosis in human PCA DU145 cells were compared with the effects of GSE. Data summarized in Table I clearly demonstrate high activity of F1 relative to intact GSE. Almost 90% inhibition of cell growth ( P ≤ 0.01) occurred with F1 exposure and 60% of the cells died ( P ≤ 0.01). In addition, 47.5 ( P ≤ 0.01) and 27.4% ( P ≤ 0.01) of the cells underwent early and late apoptotic death by F1 treatment for 48 h, respectively. These results are compared with only 30% growth inhibition, 16% cell death and 6.2% late apoptotic death by GSE for the same treatment period; no early apoptotic death was evidenced for GSE relative to control values ( Table I ). In contrast to a very strong effect in F1, Fractions F2 and F3 at an equivalent weight dose did not show measurable biological responses following 48 h of treatment in the microscopic examination of the treated culture plates. In fact, F2- and F3-treated cultures were more comparable with vehicle-treated controls, and therefore were not further analyzed ( Table I ).
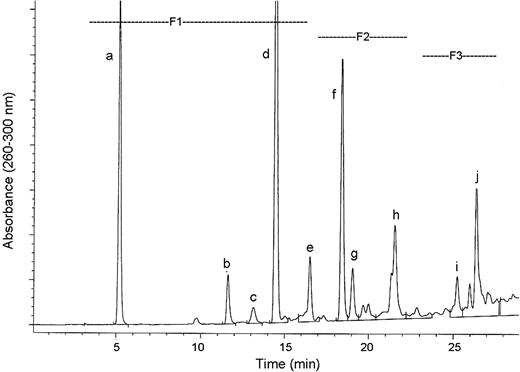
HPLC analysis of the ethyl acetate-soluble components extracted from GSE. Fractions F1–F3 as well as the individual peaks labeled a–j were isolated employing the chromatographic conditions described under Materials and methods.
Biological activity a of GSE and HPLC Fractions F1–F3 b in DU145 cells
| Sample | Growth (% of control) | Death (%) | Apoptosis | ||
|---|---|---|---|---|---|
| Early | Late | ||||
| Control | 100 | 5 | 4.6 ± 0.0 | 1.8 ± 0.2 | |
| GSE | 70 * | 16 * | 4.3 ± 0.4 (NS) | 6.2 ± 0.1 ** | |
| F1 | 11 ** | 60 ** | 47.5 ± 0.8 ** | 25.9 ± 5.9 ** | |
| F2 | No effect c | No effect c | NA c | ||
| F3 | No effect c | No effect c | NA c | ||
a Biological activity of Fractions F1–F3 (collected by semi-preparative reversed-phase HPLC detailed in Figure 1 ) was assessed in terms of DU145 cell growth, death and both early and late apoptosis. DU145 cells were cultured under standard conditions and treated with DMSO (control), GSE or F1–F3 in DMSO at 100 μg/ml doses for 48 h. The selection of treatment time was based on the fact that in visual inspection of the cells, F1 fraction showed massive cell death within 48 h treatment; however, there was no effect by F2 and F3 fractions in 48 h. Cells were then collected and counted for total live and dead cells or processed for annexin V–PI staining followed by florescence-activated cell sorting (FACS) analysis. The data shown in each case are mean ± SE of three independent samples, and are representative of three independent experiments with comparable observations.
b Corresponding to the chromatogram in Figure 2 .
c The cell growth and death responses with exposure to F2 and F3 at 48 h were not distinguishable from controls in microscopic examination of the cultures, so apoptosis was not analyzed (NA) with these fractions.
* , P ≤ 0.05; ** , P ≤ 0.01; NS, not significant; versus DMSO control.
On the basis of the observed biological effects of F1 on DU145 cells, the individual peaks labeled a–e in F1 ( Figure 2 ) were individually collected, activities determined in DU145 cells and the major components identified ( Table II ) by comparing chromatographic properties, UV spectra and mass spectra with reference standards. Compounds a–e also have been reported in previous work with GSE ( 39 , 40 ). It should be emphasized that since we observed very strong biological effects by F1 with almost no effect of F2 and F3 after 48 h of exposure, an extended treatment time of 72 h was employed in assessing the efficacy of individual components in F1. Furthermore, because of the strong effect of F1 at 48 h, all the treatments with the individual F1 components were carefully monitored under the microscope during the entire 72 h period. The results summarized in Table II demonstrate that the activity of F1 is due mainly to GA. Treatment of DU145 cells at the same dose (100 μg/ml in DMSO) of each individually collected peak for 72 h resulted in complete cell death by GA in less than 48 h ( Table II ) and, therefore, a comparison could not be made with the other compounds. For this reason, all further studies of GA efficacy were performed at lower doses and treatment time.
Identifications and biological activities of the components isolated from HPLC Fraction F1
| Peak a | Component b | Biological activities c | ||||||
|---|---|---|---|---|---|---|---|---|
| Cell growth (% of control) | % Cell death | Early apoptosis | Late apoptosis | |||||
| Control | N/A | 100 | 2.6 | 2.6 ± 0.2 | 2.4 ± 0.8 | |||
| GSE | N/A | 36 * | 19 ** | 10.6 ± 0.3 ** | 9.9 ± 1.8 * | |||
| A | GA d | — | 100 ** | — | — | |||
| B | B1 dimer | 73 NS | 12 * | 4.0 ± 0.1 * | 3.1 ± 0.1 (NS) | |||
| C | B3 dimer | 70 * | 11 * | 3.4 ± 0.3 (NS) | 3.9 ± 0.1 (NS) | |||
| D | Catechin | ND | ND | ND | ND | |||
| E | B2 dimer | 55 * | 17 ** | 4.4 ± 0.2 * | 5.2 ± 0.3 * | |||
a Correspond to the peaks labeled in Figure 2 .
b Identified by comparing HPLC retention data, UV spectra and mass spectra with reference compounds and published data ( 39 , 40 ). Structures are shown in Figure 1 .
c Biological activity of each peak, except Peak A, was assessed in terms of DU145 cell growth, death and both early and late apoptosis. Cells were cultured under standard conditions and treated with DMSO (control), GSE or various peaks in DMSO at 100 μg/ml dose for 72 h. Cells were then collected and counted for total live and dead cells or processed for annexin V–PI staining followed by FACS analysis. Early apoptotic cells are those stained only for annexin V and the late ones are those stained positive with both annexin V and PI. The data shown in each case are mean ± SE of three independent samples, and are representative of three independent experiments with comparable observations. ND, not done.
d In the GA studies in DU145 cells at 100 μg/ml dose and 72 h treatment time, no cell survival was detected as all the cells died after 48 h treatment. All further GA efficacy studies, therefore, were next performed at lower doses and treatment times (Figures 5 and 6).
* , P ≤ 0.05; ** , P ≤ 0.01; NS, not significant; versus DMSO control.
To further substantiate that GA is a major contributor in the biological effects of GSE on DU145 cells, GSE was modified by selectively removing the GA component eluting before procyanidins on a gel filtration column with the remaining components (Fractions II–VIII, Figure 3 ) collected in a single fraction. The biological efficacy of modified GSE shown in Figure 4 was intermediate between that of control and intact GSE, thereby demonstrating the major contribution of GA but also demonstrating that other GSE components (presumably procyanidins) eluting from a gel filtration column also contribute to the effects of GSE in DU145 cells (discussed below).
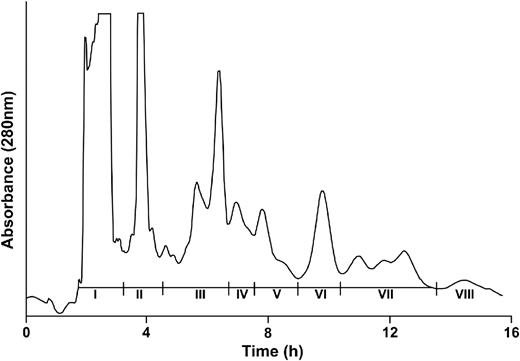
Fractionation of ethyl acetate-soluble components extracted from GSE by gel filtration chromatography on Toyopearl HW-40S resin with methanol as the elution solvent. Fractions I–VIII were collected at the times indicated employing the chromatographic conditions described under Materials and methods.
![Biological activity of GSE with or without the GA component. DU145 cells were treated with DMSO (control), intact GSE or GSE without GA [GSE (−GA)] in DMSO at 100 μg/ml dose for 72 h. Cells were then collected and counted for total live and dead cells (A) or processed for annexin V–PI staining followed by FACS analysis (B) . Early apoptotic cells are those stained only for annexin V and the late ones are those stained positive with both annexin V and PI. The data shown in each case are mean ± SE of three independent samples, and are representative of two independent experiments with comparable observations. * , P ≤ 0.05; ** , P ≤ 0.01; versus DMSO control.](https://oup.silverchair-cdn.com/oup/backfile/Content_public/Journal/carcin/27/7/10.1093_carcin_bgi347/2/m_bgi347f4.jpeg?Expires=1716515592&Signature=0HrCB1kaVLZFjWTjOcPySuE3lXlZcOSAPS9ewROUf5A0yxkeqdUv5A92jlrmVJpn6vbj2qpE9VsjjY~pnBLadalLd3lU~e-J7xUOl46IrAOolpW7vtrt842smrgrkCCD-1ehY9gA1ZFu70NO2R4ZywLLkDk8zaj-sxcRhIvbroRIGKJV1DVo0O0ldWseP7XkxR8rtMdWWtKF111SOoQxrYQBwn7YgmRi1lU0y9QjSgIyxQcIfZ5aUAdgufJCxeyVgrE2-qw2Nzv~5R1JLrReWAZ~IZ93LTtWcRIDMj99GZPw5badvcg~T3iacktzwAYocRf7MLwHgupq-qWhnDL9mg__&Key-Pair-Id=APKAIE5G5CRDK6RD3PGA)
Biological activity of GSE with or without the GA component. DU145 cells were treated with DMSO (control), intact GSE or GSE without GA [GSE (−GA)] in DMSO at 100 μg/ml dose for 72 h. Cells were then collected and counted for total live and dead cells (A) or processed for annexin V–PI staining followed by FACS analysis (B) . Early apoptotic cells are those stained only for annexin V and the late ones are those stained positive with both annexin V and PI. The data shown in each case are mean ± SE of three independent samples, and are representative of two independent experiments with comparable observations. * , P ≤ 0.05; ** , P ≤ 0.01; versus DMSO control.
GA causes growth inhibition and death of DU145 cells
On the basis of the results shown in this study identifying GA as one of the most active constituents in GSE and the fact that a high dose (100 μg/ml) causes massive DU145 cell death in 72 h of treatment, we conducted further efficacy studies employing lower doses and treatment times. As shown in Figure 5 , treatment with GA at 25 and 50 μg/ml doses for 24 and 48 h resulted in a strong cell growth inhibition [55–60% ( P ≤ 0.05) and 91–93% ( P ≤ 0.01), respectively] and cell death [11–16% ( P ≤ 0.05) and 54–56% ( P ≤ 0.01), respectively] mostly in a dose-dependent, but not a time-dependent, manner.
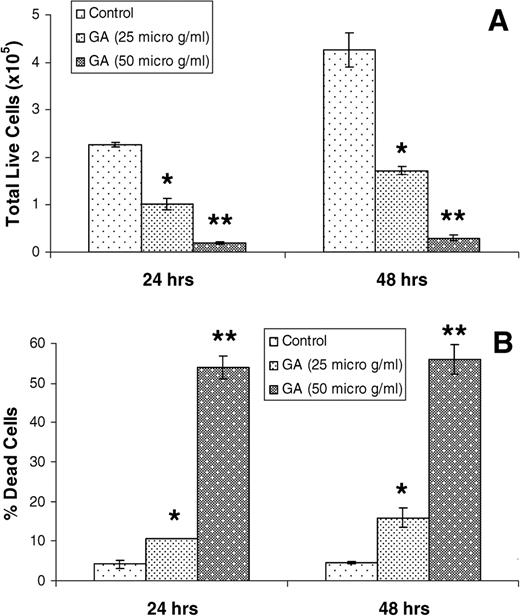
GA causes growth inhibition ( A ) and death ( B ) of DU145 cells. Cells were cultured under standard conditions and treated with DMSO (control) or GA in DMSO at 25 and 50 μg/ml doses for 24 or 48 h. Cells were then collected and counted for total live and dead cells as detailed under Materials and methods. The data shown in each case are mean ± SE of three independent samples, and are representative of three independent experiments with comparable observations. * , P ≤ 0.05; ** , P ≤ 0.01; versus DMSO control.
GA induces apoptotic death of DU145 cells and causes caspase-9, caspase-3 and PARP cleavages
As the effects of GA on cell growth and death were largely dose-dependent and occurred early, they could possibly be due to a strong apoptotic effect contributing to both a reduced cell number (measured as cell growth inhibition) and cell death. Accordingly, next we assessed the effect of GA on apoptosis induction in DU145 cells under the same experimental conditions as for cell growth and death. As shown in Figure 6 , treatment of cells with GA resulted in a strong dose-dependent, but again not a time-dependent, apoptotic cell death, as the agent produced a mostly early rather than late apoptotic cell population. Interestingly, the observed effect of GA on early apoptotic cell death was almost comparable with its overall effect on cell death shown in Figure 5B , in terms of both dose and treatment times ( Figure 6A and B ). These results further support the possibility that the effects of GA towards growth inhibition and death are largely due to its strong apoptotic activity.
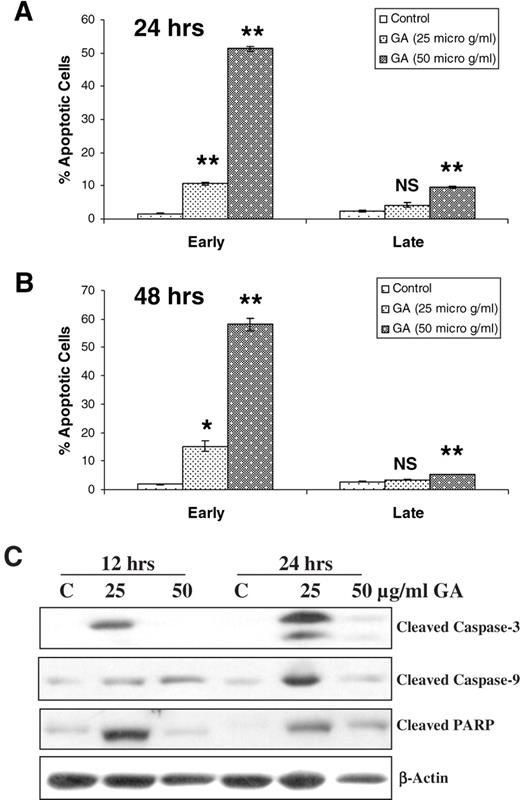
GA induces apoptotic death of DU145 cells and causes caspase-3, caspase-9 and PARP cleavages. Cells were cultured under standard conditions and treated with DMSO (control) or GA in DMSO at 25 and 50 μg/ml doses for 24 ( A ) or 48 ( B ) h. Cells were then collected and processed for annexin V–PI staining followed by FACS analysis as detailed in Materials and methods. Early apoptotic cells are those stained only for annexin V and the late apoptotic cells are those stained positive with both annexin V and PI. The data shown in each case are mean ± SE of two independent samples, and are representative of three independent experiments with comparable observations. * , P ≤ 0.05; ** , P ≤ 0.01; NS, not significant; versus DMSO control. For western analyses ( C ), following treatments with DMSO (control) or GA in DMSO at 25 or 50 μg/ml dose for indicated times, cells were collected and total lysates prepared and subjected to SDS–PAGE and immunoblotting. Membranes were probed with desired primary followed by appropriate secondary antibodies and bands developed by ECL, as detailed in Materials and methods.
As caspase-3 followed by PARP cleavage is the key event in the process of apoptosis, and as these events are also employed as markers of apoptosis induction ( 41 – 43 ), we examined the effect of GA on the activation of caspase-3 by western immunoblotting employing the identical treatments described above. As we observed no additional effect of this compound following 48 h as compared with 24 h of treatment, an early time-point of 12 h was used, which was also intended to (i) investigate a time–response effect and (ii) determine whether caspase activation followed by PARP cleavage contribute to an overall apoptotic response. As shown in Figure 6C , treatment of the cells with GA led to a strong activation of pro-caspase-3, as evidenced by the level of cleaved caspase-3 at 12 h after exposure, however, only at lower dose (25 μg/ml). Much stronger cleaved caspase-3 bands were observed at a lower GA dose following 24 h of treatment. Overexposure of the film also showed faint bands for cleaved caspase-3 at higher dose (50 μg/ml) ( Figure 6C ). On the basis of the levels of caspase-3 cleavage by GA, the fact that caspase-9 activation leads in turn to caspase-3 activation, and that PARP is a major substrate of activated caspase-3 ( 43 ), we also examined the levels of both cleaved caspase-9 and PARP in the total cell lysates used for cleaved caspase-3 blotting. As shown in Figure 6C , consistent with our caspase-3 results, modest to very strong levels of cleaved caspase-9 and PARP were observed in GA-treated cell lysates.
Taken together, these results suggest that indeed GA causes caspase-9, caspase-3 and PARP cleavages; however, more studies are needed at early time-points with a higher dose to further address the observed discrepancy, that is, nearly a complete lack of effect at higher dose despite a very strong early apoptotic cell population. One possible explanation could be that the 50 μg/ml dose of GA produces massive apoptotic cell death even after 12 h, making the analyses of caspases and PARP cleavages impractical in total cell lysates. In support of this explanation, indeed we found very low levels of total cellular protein in cells treated with a 50 μg/ml dose of GA at 12 h that decreased further after 24 h of the treatment (data not shown). In terms of the actin immunoblot, used as a loading control, Figure 6C demonstrates that the levels were considerably lower in the cells treated with 50 μg/ml of GA at both 12 and 24 h time-points as compared with both DMSO control and cells treated with a 25 μg/ml dose of GA. Another possibility is that treatment of the cells with a higher dose of GA leads to an aggressive and massive apoptotic cell death by a mechanism mostly independent of caspase activation. In support of this possibility, several studies in recent years have shown that various phytochemicals such as those from green tea, garlic, cruciferous vegetables, and so on cause apoptotic cell death in different human carcinoma cells including PCA by the generation of reactive oxygen species ( 44 , 45 ). This event is accompanied by DNA damage and ataxia telangiectasia mutated (ATM)/ATM and Rad3-related (ATR) activation leading to alterations in downstream effectors including inactivating phosphorylation of Cdc25C and Cdc2 for cell cycle arrest and apoptosis ( 46 ). Whether a higher dose of GA also follows similar mechanisms remains to be determined in our ongoing studies with this agent.
Isolation and testing of procyanidins
To investigate oligomeric procyanidins, GSE was separated into eight fractions by gel filtration chromatography ( Figure 3 ). The only significant component in Fraction I was GA. As shown in Table III , Fractions II–IV had much less effect on cell growth, death and apoptosis compared with GSE; Fraction V produced similar effects; and Fractions VI–VIII were generally more active than GSE. Several of these fractions were analyzed further by HPLC ( Figure 7 ) and negative-ion LC/MS. The general structures of major components isolated from these fractions by semi-preparative HPLC are summarized in Table IV . The molecular ions and daughter ions obtained by collision-induced dissociation are those expected for procyanidin dimer gallate esters [(M–H) − m/z 729.8, and daughter ions m/z 711, 603, 577, 559, 441, 425, 407 and 289], procyanidin trimers [(M–H) − m/z 865.5, and daughter ions m/z 847, 739, 713, 695, 577, 407 and 289] and trimer gallates [(M–H) − m/z 1017.4, and daughter ions m/z 999, 890, 865, 847, 729 and 695]. These results, by comparison with published spectra of procyanidins, led to the general structure assignments listed in Table IV ( 47 , 48 ).
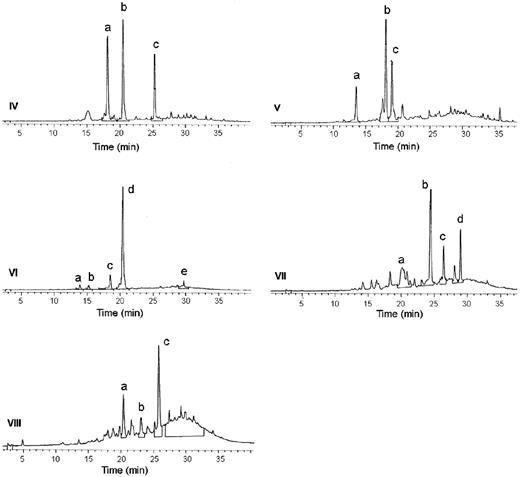
Analyses of gel filtration Fractions IV–VIII by reversed-phase HPLC. The labeled peaks in each chromatogram were collected and analyzed by LC/MS as described under Materials and methods.
Biological activities of the fractions separated by gel filtration chromatography a
| Fraction | Biological activities b | ||||||
|---|---|---|---|---|---|---|---|
| Cell growth (% of control) | % Cell death | Early apoptosis | Late apoptosis | ||||
| Control | 100 | 3 | 1.3 ± 0.2 | 2.5 ± 0.2 | |||
| GSE | 34 * | 14 * | 6.1 ± 0.1 ** | 10.3 ± 0.8 * | |||
| II | 81 (NS) | 2 (NS) | 1.3 ± 0.1 (NS) | 2.0 ± 0.1 (NS) | |||
| III | 75 (NS) | 7 (NS) | 4.2 ± 0.3 * | 3.0 ± 0.2 (NS) | |||
| IV | 74 (NS) | 3 (NS) | 3.2 ± 0.5 (NS) | 1.7 ± 0.1 (NS) | |||
| V | 38 * | 15 * | 5.1 ± 0.1 ** | 7.6 ± 0.2 ** | |||
| VI | 25 * | 24 * | 8.1 ± 0.3 * | 7.2 ± 0.3 ** | |||
| VII | 25 * | 24 * | 7.8 ± 0.1 ** | 9.4 ± 0.7 ** | |||
| VIII | 23 ** | 27 * | 6.1 ± 0.0 ** | 7.9 ± 0.5 ** | |||
a Corresponding to the chromatogram in Figure 3 .
b Biological activity of each fraction, except Fraction I that was identified as GA, was assessed in terms of DU145 cell growth, death and both early and late apoptosis. DU145 cells were cultured under standard conditions and treated with DMSO (control), GSE or various fractions in DMSO at 100 μg/ml dose for 72 h. Cells were then collected and counted for total live and dead cells or processed for annexin V–PI staining followed by FACS analysis. Early apoptotic cells are those stained only for annexin V and the late ones are those stained positive with both annexin V and PI. The data shown in each case are mean ± SE of three independent samples, and are representative of three independent experiments with comparable observations.
* , P ≤ 0.05; ** , P ≤ 0.01; NS, not significant; versus DMSO control.
Procyanidin components of GSE isolated by gel filtration combined with HPLC
| Fraction a | HPLC peak | Procyanidins detected b | Fraction | HPLC peak | Procyanidins detected |
|---|---|---|---|---|---|
| IV | A | Dimer-G c | VII | a | Dimer-G |
| B | Dimer | b | Dimer-(G)2 | ||
| C | Dimer | c | Dimer-G | ||
| d | Dimer-G | ||||
| V | A | Trimer | VIII | A | Trimer-G |
| B | Dimer-G | b | Trimer-G | ||
| C | Trimer | c | Trimer-G | ||
| VI | A | Trimer | |||
| B | Trimer | ||||
| C | Trimer | ||||
| D | Dimer-G | ||||
| E | Trimer |
b The general structures of procyanidins were deduced from LC/MS analysis as described in the test.
c The symbol ‘G’ corresponds to a gallate ester derivative.
Fraction II was composed of C and EC, and Fraction III contained the dimers B1 and B2. Neither of these fractions produced significant biological activity except 20–25% cell growth inhibition ( Table IV ), further demonstrating that monomers and dimers do not contribute appreciably to the activity of GSE in DU145 cells. Fraction IV also contained dimers and a dimer–gallate derivative ( Table IV ) and was not active except for significant early apoptosis. Fractions V–VIII, however, produced about the same cell growth inhibition and apoptotic activity as GSE, but greater cytotoxicity.
Discussion
In the present study, fractionation of GSE and biological testing of isolated fractions has led to two principal conclusions. The most important finding is that GA accounts for a significant fraction of the activity of GSE in causing growth inhibition, death and apoptotic induction in DU145 human prostate carcinoma cells. It is also clear, however, that oligomeric procyanidins (i.e. larger than dimers) and the corresponding gallate esters contribute to the biological activity of GSE and, therefore, merit further investigation. Gel filtration chromatography on Toyopearl HW-40S resin is an efficient method to prepare large quantities of partially purified oligomers from GSE that can then be subjected to semi-preparative HPLC to isolate individual components. The gel filtration approach also facilitated the selective removal of GA from GSE to confirm the contribution of this compound to the efficacy of the latter.
It should be noted that various GSE preparations are not standardized for the presence and quantity of active constituents, which could account for the differences in the reproducibility of the effects from one laboratory to another. Even though crude GSE produces anti-cancer effects in various animal studies, additional knowledge about the most active constituents will facilitate mechanistic, pharmacokinetic and pharmacodynamic studies. Our continuing efforts are focused on identifying additional purified GSE procyanidins and subsequently assessing their biological effects in several other human carcinoma cell lines. Anti-cancer efficacy of GSE has been shown against many epithelial cancers, including skin, colon and breast cancers ( 29 , 35 – 37 ), in addition to PCA; however, the contribution of GA in GSE efficacy is yet to be studied.
Overall, in the present study we have confirmed GA as one of the principal constituents in GSE, determined that this compound contributes significantly to the biological effects of GSE in DU145 cells and confirmed the activity of pure samples of GA. It should also be emphasized, however, that whereas the contributions of GA to the strong biological effects of GSE in DU145 cells are novel observations, there have been numerous studies showing the presence of this phytochemical in fruits, vegetables and green tea, either in free acid or ester form ( 49 , 50 ). In addition, several investigators have reported both cancer-preventive and anti-cancer effects of GA employing different in vitro and in vivo models ( 51 – 53 ). On the basis of literature reports and the present findings, we conclude that more detailed mechanistic and efficacy studies are warranted with this relatively simple and widespread phytochemical in both cell culture and animal models of PCA.
This work was supported by USPHS grant CA91883 (to C.A.) from the National Cancer Institute, NIH.
Conflict of Interest : None declared.
References
Jemal,A., Murray,T., Ward,E., Samuels,A., Tiwari,R.C., Ghafoor,A., Feuer,E.J. and Thun,M.J. (
De Marzo,A.M., Meeker,A.K., Zha,S., Luo,J., Nakayama,M., Platz,E.A., Isaacs,W.B. and Nelson,W.G. (
Sakr,W.A. and Partin,A.W. (
Nelson,W.G., De Marzo,A.M., Deweese,T.L., Lin,X., Brooks,J.D., Putzi,M.J., Nelson,C.P., Groopman,J.D. and Kensler,T.W. (
Bostwick,D.G. and Qian,J. (
Feldman,B.J. and Feldman,D. (
Koivisto,P., Kolmer,M., Visakorpi,T. and Kallioniemi,O.P. (
Pilat,M.J., Kamradt,J.M. and Pienta,K.J. (
Surh,Y.J. (
Singh,D.K. and Lippman,S.M. (
Singh,R.P. and Agarwal,R. (
Barnes,S. (
Park,O.J. and Surh,Y.J. (
Campbell,J.K., Canene-Adams,K., Lindshield,B.L., Boileau,T.W., Clinton,S.K. and Erdman,J.W.,Jr (
Klein,E.A., Thompson,I.M., Lippman,S.M., Goodman,P.J., Albanes,D., Taylor,P.R. and Coltman,C. (
Lin,X., Gingrich,J.R., Bao,W., Li,J., Haroon,Z.A. and Demark-Wahnefried,W. (
Mentor-Marcel,R., Lamartiniere,C.A., Eltoum,I.E., Greenberg,N.M. and Elgavish,A. Genistein in the diet reduces the incidence of poorly differentiated prostatic adenocarcinoma in transgenic mice (TRAMP).
Gupta,S., Hastak,K., Ahmad,N., Lewin,J.S. and Mukhtar,H. (
Albrecht,M., Jiang,W., Kumi-Diaka,J., Lansky,E.P., Gommersall,L.M., Patel,A., Mansel,R.E., Neeman,I., Geldof,A.A. and Campbell,M.J. (
Singh,R.P., Sharma,G., Mallikarjuna,G.U., Dhanalakshmi,S., Agarwal,C. and Agarwal,R. (
Singh,A.V., Xiao,D., Lew,K.L., Dhir,R. and Singh,S.V. (
Singh,R.P., Dhanalakshmi,S., Tyagi,A.K., Chan,D.C., Agarwal,C. and Agarwal,R. (
Rice,L., Samedi,V.G., Medrano,T.A., Sweeney,C.A., Baker,H.V., Stenstrom,A., Furman,J. and Shiverick,K.T. (
Bartolome,B., Hernandez,T., Bengoechea,M.L., Quesada,C., Gomez-Cordoves,C. and Estrella,I. (
Escribano-Bailon,M.T., Gutierrez-Fernandez,Y., Rivas-Gonzalo,J.C. and Santos-Buelga,C. (
Packer,L., Rimbach,G. and Virgili,F. (
Maffei Facino,R., Carini,M., Aldini,G., Berti,F., Rossoni,G., Bombardelli,E. and Morazzoni,P. (
Ferreira,D. and Slade,D. (
Ye,X., Krohn,R.L., Liu,W., Joshi,S.S., Kuszynski,C.A., McGinn,T.R., Bagchi,M., Preuss,H.G., Stohs,S.J. and Bagchi,D. (
Agarwal,C., Sharma,Y., Zhao,J. and Agarwal,R. (
Tyagi,A., Agarwal,R. and Agarwal,C. (
Agarwal,C., Singh,R.P. and Agarwal,R. (
Vayalil,P.K., Mittal,A. and Katiyar,S.K. (
Arii,M., Miki,M., Hosoyama,R., Ariga,H., Yamaji,N. and Kataoka,S. (
Bomser,J.A., Singletary,K.W., Wallig,M.A. and Smith,M.A.L. (
Zhao,J., Wang,J., Chen,Y. and Agarwal,R. (
Mittal,A., Elmets,C.A. and Katiyar,S.K. (
Singh,R.P., Tyagi,A.K., Dhanalakshmi,S., Agarwal,R. and Agarwal,C. (
De Freitas,V.A.P., Glories,Y., Bourgeois,G. and Vitry,C. (
Oszmianski,J. and Sapis,J.C. (
Jiang,C., Wang,Z., Ganther,H. and Lu,J. (
Kaufmann,S., Desnoyers,S., Ottaviano,Y., Davidson,N. and Poirier,G. (
Chung,L.Y., Cheung,T.C., Kong,S.K., Fung,K.P., Choy,Y.M., Chan,Z.Y. and Kwok,T.T. (
Singh,S.V., Srivastava,S.K., Choi,S. et al . (
Xiao,D., Herman-Antosiewicz,A., Antosiewicz,J., Xiao,H., Brisson,M., Lazo,J.S. and Singh,S.V. (
Friedrich,W., Eberhardt,A. and Galensa,R. (
Gu,L., Kelm,M.A., Hammerstone,J.F., Zhang,Z., Beecher,G., Holden,J., Haytowitz,D. and Prior,R.L. (
Hour,T.C., Liang,Y.C., Chu,I.S. and Lin,J.K. (
Haslam,E. and Cai,Y. (
Inoue,M., Suzuki,R., Sakaguchi,N., Li,Z., Takeda,T., Ogihara,Y., Jiang,B.Y. and Chen,Y. (
Galati,G. and O'Brien,P.J. (
Author notes
1Department of Pharmaceutical Sciences, School of Pharmacy, 2University of Colorado Cancer Center, University of Colorado Health Sciences Center, Denver, CO 80262, USA
