


Abstract
Previous research in non-human primates has shown that the superior longitudinal fascicle (SLF), a major intrahemispheric fiber tract, is actually composed of four separate components. In humans, only post-mortem investigations have been available to examine the trajectory of this tract. This study evaluates the hypothesis that the four subcomponents observed in non-human primates can also be found in the human brain using in vivo diffusion tensor magnetic resonance imaging (DT-MRI). The results of our study demonstrated that the four subdivisions could indeed be identified and segmented in humans. SLF I is located in the white matter of the superior parietal and superior frontal lobes and extends to the dorsal premotor and dorsolateral prefrontal regions. SLF II occupies the central core of the white matter above the insula. It extends from the angular gyrus to the caudal–lateral prefrontal regions. SLF III is situated in the white matter of the parietal and frontal opercula and extends from the supramarginal gyrus to the ventral premotor and prefrontal regions. The fourth subdivision of the SLF, the arcuate fascicle, stems from the caudal part of the superior temporal gyrus arches around the caudal end of the Sylvian fissure and extends to the lateral prefrontal cortex along with the SLF II fibers. Since DT-MRI allows the precise definition of only the stem portion of each fiber pathway, the origin and termination of the subdivisions of SLF are extrapolated from the available data in experimental material from non-human primates.
Introduction
Traditionally the superior longitudinal fascicle (SLF) is considered to be a major association fiber pathway that connects the postrolandic regions (i.e. parieto-temporal association areas) with the frontal lobe and vice versa. Burdach (1822), following a description by Reil and Autenrieth (1809), was the first to delineate this pathway in some detail. Subsequently, Dejerine (1895), while describing different association fiber pathways, gave a detailed account of this fiber bundle that has remained the mainstay for interpreting many clinical disorders (e.g. Geschwind, 1965a). Moreover, Ludwig and Klingler (1956) and Heimer (1983), using gross dissection, further demonstrated the trajectory of this fiber system in the human. In recent years, several studies have described the course of SLF using the diffusion tensor magnetic resonance imaging (DT-MRI) technique (Makris et al., 1997; Mori et al., 1999; Poupon et al, 2000; Catani et al., 2002; Mamata et al., 2002). Although the available descriptions of this fiber bundle provide basic anatomical information, the detailed understanding of SLF remains to be ascertained. Both Burdach and Dejerine suggested that there is a fiber tract stemming from the caudal part of the superior temporal gyrus that arches around the Sylvian fissure and advances forward to end within the frontal lobe. They named this bundle the arcuate fascicle (AF) and considered it as part of SLF, using interchangeably the terms ‘superior longitudinal’ or ‘arcuate fasciculus’ in their descriptions. Recent observations from neuroimaging studies agree with this description. In contrast to these classical descriptions and the neuroimaging studies, non-human primate studies showed the SLF and AF to be two separate entities that have separate trajectories (Petrides and Pandya, 1984,1988). How the AF and SLF relate to each other remains to be clarified in humans.
Experimental observations in non-human primates have shown that SLF is composed of four components (Petrides and Pandya, 1984). The major component of SLF, i.e. SLF II, is derived from the caudal–inferior parietal region corresponding to the angular gyrus in the human and terminates within the dorsolateral frontal region. The dorsal component of SLF (SLF I) appears to originate from the medial and dorsal parietal cortex and ends in the dorsal and medial part of the frontal lobe. The ventral component of SLF (SLF III) originates from the supramarginal gyrus and terminates predominantly in the ventral premotor and prefrontal areas. It has been reported that the AF, the fourth division of SLF, originates from the caudal part of the superior temporal gyrus and runs contiguous with the fibers of SLF II above the Sylvian fissure and insula (Petrides and Pandya, 1988). Comparable organization of SLF in the human remains to be delineated.
Available anatomical information regarding the trajectories of SLF in the human is derived from post-mortem material. More refined neuroimaging techniques such as DT-MRI, as mentioned above, have made possible the segmentation and volumetric analysis of various fiber bundles (Makris, et al., 2002a) as well as the study of their trajectory (Mori, et al., 1999; Lori, et al., 2002) in the human in vivo. In the present study we have identified and segmented various subcomponents of SLF, including the AF, and investigated their volumetry, anisotropy and topographic anatomy, using the DT-MRI method combined with anatomical knowledge in four human normal subjects in vivo. We have also extrapolated the non-human primate literature data for the SLF to the human DT-MRI SLF data presented herein to provide anatomical inferences for these fiber pathways in terms of their origins and terminations (Makris, et al., 2002b). Combination of this detailed information regarding the quantification of this fiber system (Makris et al., 2002b) with tractographic approaches for trajectory information (Mori et al., 1999; Lori et al., 2002) would allow better anatomical–functional correlational studies as well as evaluation of white matter structures in clinical conditions.
Materials and Methods
Four normal right-handed male human subjects (mean age 35 years) were scanned using the DT-MRI technique to outline the SLF including the AF. For the acquisition of these data the following protocol was used. Magnetic resonance imaging was performed using a General Electric 1.5 T Signa imaging system (modified for instant imaging by Advanced NMR, Inc., Wilmington, MA). Subjects were positioned in the magnet along their anterior commissure (AC)–posterior commissure (PC) line. This alignment was adjusted and verified using quick scout imaging prior to the remainder of the study MR acquisitions. Scans included conventional MRI (multi-slice T1-weighted sagittal scan for prescription of subsequent images) and echo-planar DT-MRI. The echo-planar-based protocol included automatic magnetic field shimming and diffusion tensor imaging in axial planes. The axial imaging covered the entire brain (45 axial sections). We assumed Gaussian behavior of the water self-diffusion, and sampled the diffusion tensor, D, using an echo-planar imaging (EPI) technique to sample the diffusion tensor on a voxel-by-voxel basis. For each tensor acquisition six directions of high b value images and one low b value image (b ∼ 0) were acquired. The following technical parameters were used: TR = 8000 ms, TE = 96 ms, the ‘catch and hold’ readout option was employed (Sorensen, et al., 1999), averages = 12, number of slices = 45, slice thickness = 3 mm, no interslice gap, field of view = 40 × 20 cm, matrix = 256 × 128, in-plane voxel resolution = 1.56 × 1.56 mm2, high b value images used b = 568 s/mm2. We acquired each data set of 45 axial slices in three slabs of 15 slices each for 11.2 min/slab. The signal-to-noise ratio (SNR) was 30.
All of the axially acquired images were reformatted into the coronal orientation prior to the tensor calculations to facilitate anatomic interpretation. The locations of AC, PC and interhemispheric fissure as well as the cerebral exteriors (anterior, posterior, superior and inferior) were recorded on the coronal images so that all voxel locations within each image could be represented in the Talairach coordinate system. Note that the Talairach transformation was only applied to the results of pathway segmentation for group trajectory analysis (see below); all image analysis was performed in the native acquisition. Analysis of SLF was performed on contiguous coronal sections that sampled the SLF in the anterior–posterior orientation in its complete trajectory. We then identified and delineated within SLF four separate fiber tracts following the criteria described below. These tracts were SLF I, SLF II (including the horizontal part of the AF or AFh), SLF III, and the vertical part of the AF, i.e. the AFv. It should be pointed out that these four components of the SLF constitute the stem portion of this fiber bundle. The remaining mass of the fiber tract in the frontal, parietal and temporal lobes where the fibers fan out into sprays and their extreme peripheries, i.e. where the fibers originate or terminate, could not be investigated in the present study (Makris et al., 1997, 2002a). This is due to the fact that DT-MRI does not provide the capability to distinguish among multiple fiber orientations within a single voxel (Makris et al., 2002b).
Tensor solutions, generation of principal eigenvector maps (PEMS) and color coding were performed as follows. The orientation of the diffusion tensor, i.e. the orientation of diffusion, was assessed by an eigen-decomposition of the diffusion tensor. The largest eigenvalue corresponds to the major axis of the diffusion ellipsoid, and hence represents the major orientation of diffusion at that location (Basser et al. 1994). Subsequently, color was assigned for each voxel location using the primary eigenvector (corresponding to the largest eigenvalue) of the diffusion tensor. At each voxel the absolute value of the x, y and z components of the principal eigenvector were used as the red, green and blue color values (RGB) respectively, such that a red voxel in the image represents right–left (or left–right), green indicates anterior–posterior (or posterior–anterior), and blue represents superior–inferior (or inferior–superior). In Figure 1 this color coding scheme is shown with the appropriate color painted onto a sphere, and the principal eigenvector map (PEM) is the result of color coding a tensor image (Makris et al., 1997; Pajevic and Pierpaoli, 1999). To further distinguish white matter fiber pathways from other regions, the color was modulated by a measure of anisotropy of the voxel. This emphasizes the stem portions of the fiber tracts by diminishing the brightness of everything else. Here, ‘anisotropy’ is either fractional (Basser and Pierpaoli, 1996) or lattice (Pierpaoli and Basser, 1996a,b) and is measured, respectively, by the fractional anisotropy index (FA) and lattice anisotropy index (LA). Both fractional and lattice anisotropy are scalar metrics that quantify the degree of anisotropy of a medium such as the white matter of the brain. Fractional anisotropy is an estimate of the anisotropy of a voxel that is rotationally invariant and lattice anisotropy is basically an averaging of the fractional anisotropy over a neighborhood of voxels. By computing this average over a neighborhood of voxels that are contiguous and surround the reference voxel and weighting their contributions according to their distance from the reference voxel, lattice anisotropy offers a ‘smoother’ representation of the perimeter of the compact stem of a fiber tract. FA and LA range from zero to one, with zero representing maximally isotropic diffusion and one representing maximally anisotropic diffusion.
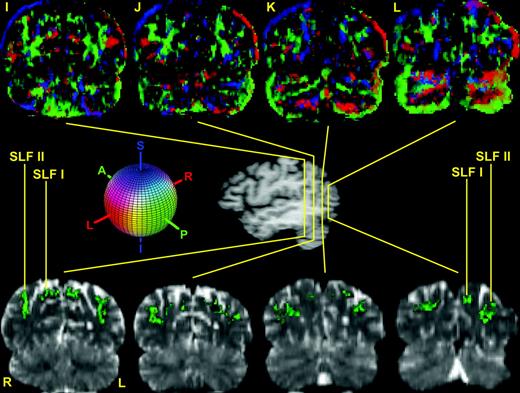
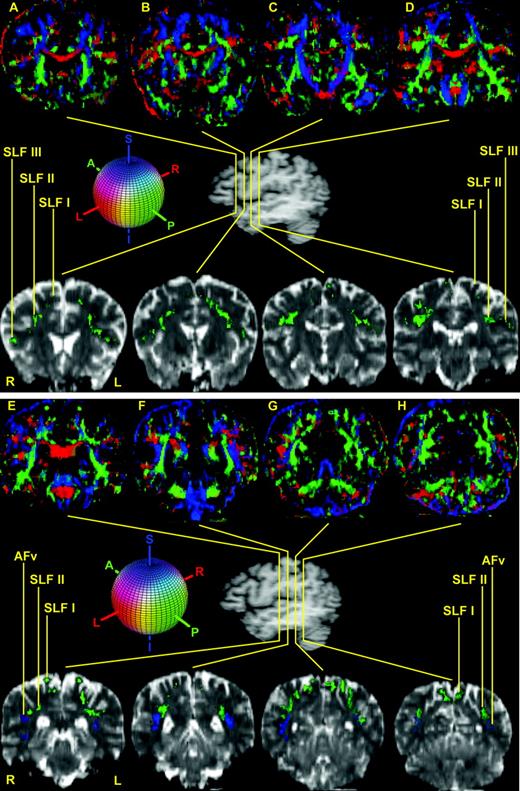
The course and topography of the different subcomponents of SLF, i.e. SLF I, SLF II, SLF III and AFv (vertical part of arcuate fascicle) are shown in 12 representative coronal sections (A–L) in the top and bottom panels. In the center of the figure is a lateral view of the hemisphere showing the rostrocaudal level of the selected sections (A–L). Coronal section A is the most rostral, located at the level of the frontal lobe, whereas section L is the most caudal, situated at the parieto-occipital transition. The upper row of images is composed of the principal eigenvector maps (PEMs). The lower row shows T2-weighted EPI sections corresponding to the DT-MRI of the upper panel to highlight the location and relative topography of the subdivisions of the SLF. In both rows, SLF I, SLF II and SLF III are generally contained in the green areas (i.e. runs anterior–posterior) and AFv is generally contained in the blue areas (i.e. runs superior–inferior). The colored sphere shows the color-coding scheme adopted in the DT-MRI data analysis. Red is right–left, green is anterior–posterior and blue is superior–inferior orientations. Abbreviations: AFv, vertical part of arcuate fascicle; SLF, superior longitudinal fascicle; L, left; R, right.
Segmentation
Based upon a priori knowledge of the SLF subcomponents from the experimental animal literature, we were able to define features of relative location and diffusion orientation in order to infer the existence and location of the stem portions of the SLF I, SLF II, SLF III and AFv fiber pathways in the human brain. Specifically, progressing through the coronal sections, the voxels pertaining to the stem portions of fiber pathways were determined by two factors: (i) relative location and (ii) orientation of diffusion properties of the tissue. It should be pointed out for clarity that the AF has been considered to be composed of a more rostral, horizontal portion or AFh and a more caudal, vertical portion or AFv. The regions were evaluated as follows. For SLF I, voxels with tensor information that was oriented anterior–posteriorly contained within the dorsomedial part of the hemisphere in the frontal and parietal lobes were selected. SLF II consisted of voxels with tensor information that was oriented anterior–posteriorly in the region above the insula, the extreme capsule, the claustrum, the external capsule, the lenticular nucleus and the internal capsule. Note that this included the horizontal part of the arcuate fascicle, AFh, and that the AFh runs contiguous to the ventral surface of SLF II and both fiber tracts are oriented in the anterior–posterior dimension. Because of their proximity and their identical orientation, the stem portions of these two fiber bundles are indiscernible from each other using images of fiber orientation in DT-MRI. Voxels with tensor information that was oriented vertically at the caudal end of SLF II were labeled as AFv, corresponding to the vertical part of the arcuate fascicle. Finally, voxels with tensor information that was oriented anterior–posteriorly within the frontoparietal opercular region were assigned to SLF III. Anterior–posteriorly oriented tensors were constrained to be within a 33° solid angle of the pure anterior–posterior orientation. A similar constraint was imposed upon the superior–inferiorly oriented tensors. This procedure generated a region of interest (ROI) for the right and left SLF I, SLF II (including AFh), SLF III and AFv in each subject.
Characterization of ROI
For each ROI, the size (as number of voxels) and the mean and SD of anisotropy, in terms of FA and LA, were calculated (Basser and Pierpaoli, 1996; Pierpaoli and Basser, 1996a). Calculations of left–right volumetric symmetry were based upon a symmetry coefficient (L – R)/[0.5(L + R)] (Galaburda et al., 1987). The course of SLF I, SLF II (including AFh), SLF III and AFv was defined in each individual subject using the segmentation ‘color map approach’ (Makris et al., 1997, 2002a; Mori, 2002). Moreover, the trajectories of SLF I, SLF II (including AFh), SLF III and AFv were determined in the Talairach coordinate system in each individual subject. From anatomical landmarks identified (see above), the average course for the group as a whole was derived by calculating the Talairach coordinate of the center of mass for the SLF I, SLF II (including AFh), SLF III and AFv respectively in each coronal section in which they were observed (Talairach and Tournoux, 1988). The tool used for two-dimensional visualization and quantitative processing of DT-MRI data has been described previously (Makris et al., 2002b). Using in-house software (named ‘surface and volume visualizer’ or SV2) we created three-dimensional reconstructions from the series of two-dimensional outlines, which included the voxels manually selected on each coronal section. Three-dimensional surfaces were displayed and visualized using transparency and color to elucidate the context and relationships between structures in the same coordinate space.
Results
In this study five main objectives were accomplished: (i) the SLF fiber system was delineated bilaterally in four normal subjects by segmentation of its four subcomponents. Figures 1 and 2 illustrate this in one of the four subjects; (ii) biophysical measurements such as FA and LA as well as the volumes of SLF I, SLF II (including the horizontal part of the arcuate fascicle, AFh), SLF III and the vertical part of the arcuate fascicle, AFv, for each individual and group were obtained as shown in Table 1; (iii) the coarse trajectories of SLF I, SLF II (including AFh), SLF III and AFv for each individual were portrayed in Talairach coordinate space as shown in Figures 4 and 5; (iv) the symmetry coefficient for left/right volume was calculated for each individual fiber pathway and group as shown in Table 1; (v) three-dimensional reconstructions of SLF I, SLF II (including AFh), SLF III and AFv were created as shown in Figure 3.
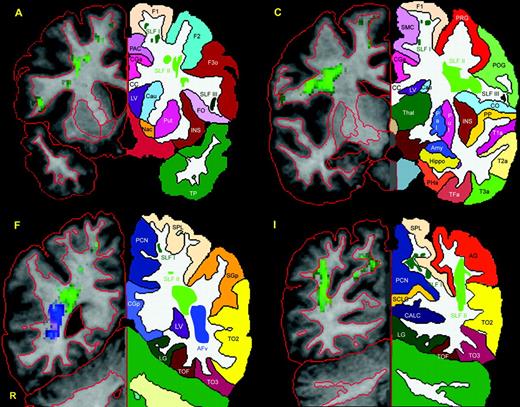
Four representative T1 coronal sections that correspond to four of the coronal slices included in Figure 1A, C, F and I are utilized to show the topographic anatomy and location of the four subcomponents of SLF, i.e. SLF I, SLF II, SLF III and AFv. To this end the individual brain was segmented and parcellated using the Center for Morphometric Analysis neuroanatomical framework (Filipek et al., 1994; Caviness et al., 1996). Thus the precise location of SLF I, SLF II, SLF III and AFv is indicated in relation to cortical and subcortical structures. On the left side of each panel (i.e. the radiological right side indicated as R) the contour outline of the cortical and subcortical structures is shown in red. On the opposite side of each panel the mirror images of the coronal section on the right are shown to demonstrate the parcellation of specific cortical and subcortical structures. Abbreviations: AFv, vertical part of arcuate fascicle; AG, angular gyrus; CALC, intracalcarine cortex; CC, corpus callosum; CGa, cingulate gyrus, anterior; CGp, cingulate gyrus, posterior; CN, cuneal cortex; CO, central operculum; F1, superior frontal gyrus; F2, middle frontal gyrus; F3o, inferior frontal gyrus, pars opercularis; F3t, inferior frontal gyrus, pars triangularis; FMC, frontal medial cortex; FO, frontal operculum; FOC, frontal orbital cortex; FP, frontal pole; H1, Heschl's gyrus; INS, insula; LG, lingual gyrus; OP, occipital pole; OF, occipital fusiform gyrus; OLi, lateral occipital cortex, inferior; OLs, lateral occipital cortex, superior; PAC, paracingulate cortex; PCN, precuneus; PHa, parahippocampal gyrus, anterior; PHp, parahippocampal gyrus, posterior; PO, parietal operculum; POG, postcentral gyrus; PP, planum polare; PRG, precentral gyrus; PT, planum temporale; SC, subcallosal cortex; SCLC, supracalcarine cortex; SGa, supramarginal gyrus, anterior; SGp, supramarginal gyrus, posterior; SLF, superior longitudinal fascicle; SMC, supplementary motor cortex; SPL, superior parietal lobule; T1a, superior temporal gyrus, anterior; T1p, superior temporal gyrus, posterior; T2a, middle temporal gyrus, anterior; T2p, middle temporal gyrus, posterior; T3a, inferior temporal gyrus, anterior; T3p, inferior temporal gyrus, posterior; TFa, temporal fusiform, anterior; TFp, temporal fusiform, posterior; TO2, middle temporal gyrus, temporooccipital; TO3, inferior temporal gyrus, temporooccipital; TOF, temporooccipital fusiform gyrus; TP, temporal pole; R, right.
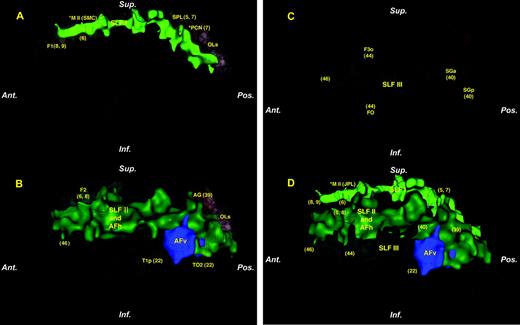
Three-dimensional renderings showing the course of the subcomponents of SLF, i.e. SLF I (A), SLF II (including AFh) and AFv (B) and SLF III (C) in the context of cerebral cortical areas and the cerebral exterior in an individual human subject. (D) The four subcomponents of SLF in a composite configuration in the context of the cerebral exterior. The asterisk in A and D denotes that the related regions, i.e. M II (supplementary motor area, SMC), and PCN (precuneus) are projected on the plane of the figure from their actual location, which is in the medial aspect of the hemisphere. Numbers in parentheses represent Brodmann cytoarchitectonic areas to illustrate possible origins and terminations of each fiber pathway as inferred from the monkey connectional studies. See text for details. Abbreviations, AFh, horizontal part of arcuate fascicle; AFv, vertical part of arcuate fascicle; AG, angular gyrus; F1, superior frontal gyrus; F2, middle frontal gyrus; F3o, inferior frontal gyrus, pars opercularis; FO, frontal operculum; OLs, lateral occipital cortex, superior; SGa, supramarginal gyrus, anterior; SGp, supramarginal gyrus, posterior; SLF, superior longitudinal fascicle; SPL, superior parietal lobule; T1p, superior temporal gyrus, posterior; TO2, middle temporal gyrus, temporooccipital.
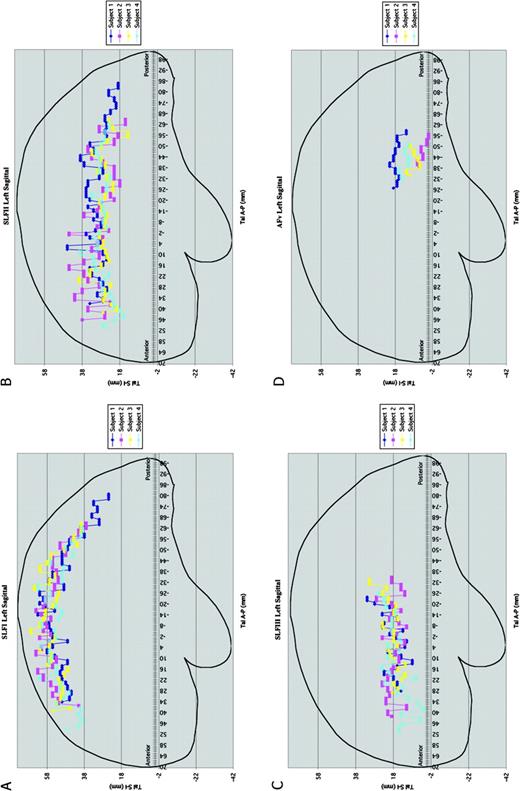
Composite representations (A–D) of lateral views of SLF I (A), SLF II (B), SLF III (C) and AFv (D) in four subjects in the Talairach space. The anterior commissure corresponds to 0 mm and the posterior commissure to −24 mm. For each individual subject each SLF component has been color coded. Abbreviations: SLF, superior longitudinal fascicle; AFv, vertical part of arcuate fascicle.
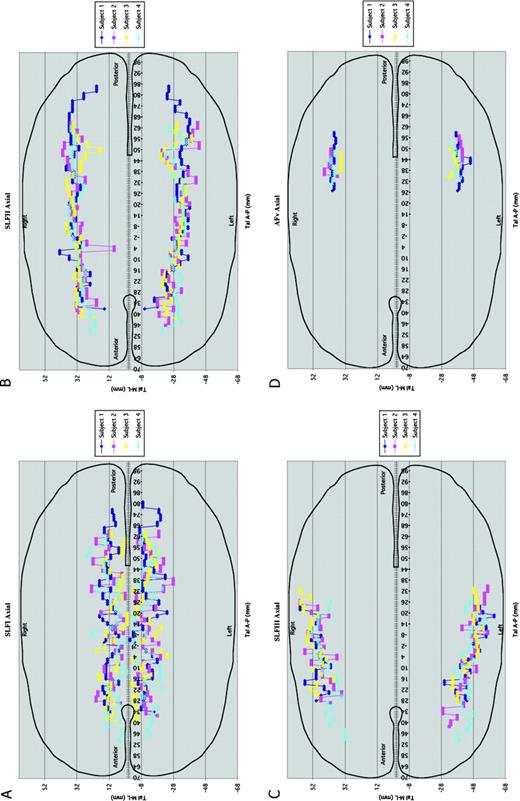
Composite representations (A–D) of axial views of the SLF I (A), SLF II (B), SLF III (C) and AFv (D) in four subjects in the Talairach space. The anterior commissure corresponds to 0 mm and the posterior commissure to −24 mm. For each individual subject each SLF component has been color coded. Abbreviations: SLF, superior longitudinal fascicle; AFv, vertical part of arcuate fascicle.
Statistical results of anisotropy indices (i.e., FA and LA) and volumetry of total SLF and of the SLFI, SLFII, SLFIII and Afv subcomponents of SLF
| Region | Measure | Side | Subject 1 | Subject 2 | Subject 3 | Subject 4 | Group Mean | Group SD |
|---|---|---|---|---|---|---|---|---|
| SLF I | FA | R | 0.38 (0.21) | 0.36 (0.21) | 0.35 (0.16) | 0.39 (0.18) | 0.37 | (0.02) |
| L | 0.38 (0.19) | 0.36 (0.26) | 0.34 (0.19) | 0.36 (0.15) | 0.36 | (0.01) | ||
| LA | R | 0.25 (0.19) | 0.22 (0.16) | 0.19 (0.11) | 0.23 (0.13) | 0.22 | (0.03) | |
| L | 0.25 (0.17) | 0.23 (0.23) | 0.19 (0.14) | 0.21 (0.10) | 0.22 | (0.03) | ||
| No. of voxels | R | 587 | 266 | 215 | 341 | 352 | (164.63) | |
| L | 475 | 210 | 202 | 243 | 282 | (129.32) | ||
| Volume (cm3) | R | 3.96 | 1.80 | 1.45 | 2.30 | 2.38 | (1.11) | |
| L | 3.20 | 1.42 | 1.36 | 1.64 | 1.91 | (0.87) | ||
| SC | −0.21 | −0.24 | −0.06 | −0.34 | −0.21 | (0.12) | ||
| SLF II | FA | R | 0.46 (0.17) | 0.43 (0.16) | 0.48 (0.15) | 0.50 (0.16) | 0.47 | (0.03) |
| L | 0.43 (0.17) | 0.41 (0.17) | 0.48 (0.15) | 0.46 (0.16) | 0.44 | (0.03) | ||
| LA | R | 0.32 (0.15) | 0.27 (0.13) | 0.32 (0.13) | 0.34 (0.15) | 0.31 | (0.03) | |
| L | 0.30 (0.15) | 0.26 (0.14) | 0.33 (0.14) | 0.30 (0.15) | 0.30 | (0.03) | ||
| No. of voxels | R | 1783 | 922 | 1529 | 1105 | 1335 | (392.22) | |
| L | 1918 | 980 | 1805 | 1084 | 1447 | (483.11) | ||
| Volume (cm3) | R | 12.03 | 6.22 | 10.32 | 7.46 | 9.01 | (2.65) | |
| L | 12.95 | 6.62 | 12.18 | 7.32 | 9.77 | (3.26) | ||
| SC | 0.07 | 0.06 | 0.17 | −0.02 | 0.07 | (0.08) | ||
| SLF III | FA | R | 0.41 (0.18) | 0.40 (0.15) | 0.43 (0.14) | 0.44 (0.15) | 0.42 | (0.02) |
| L | 0.41 (0.19) | 0.35 (0.16) | 0.39 (0.15) | 0.38 (0.14) | 0.38 | (0.02) | ||
| LA | R | 0.27 (0.16) | 0.24 (0.12) | 0.27 (0.12) | 0.28 (0.13) | 0.26 | (0.02) | |
| L | 0.28 (0.16) | 0.22 (0.13) | 0.24 (0.13) | 0.24 (0.11) | 0.24 | (0.03) | ||
| No. of voxels | R | 446 | 251 | 162 | 238 | 274 | (120.80) | |
| L | 545 | 485 | 385 | 342 | 439 | (92.41) | ||
| Volume (cm3) | R | 3.01 | 1.69 | 1.09 | 1.61 | 1.85 | (0.82) | |
| L | 3.68 | 3.27 | 2.60 | 2.31 | 2.96 | (0.62) | ||
| SC | 0.20 | 0.64 | 0.82 | 0.36 | 0.51 | (0.28) | ||
| Afv | FA | R | 0.51 (0.17) | 0.50 (0.18) | 0.44 (0.14) | 0.53 (0.15) | 0.50 | (0.04) |
| L | 0.47 (0.15) | 0.52 (0.16) | 0.52 (0.14) | 0.50 (0.15) | 0.50 | (0.02) | ||
| LA | R | 0.37 (0.16) | 0.34 (0.15) | 0.28 (0.11) | 0.37 (0.14) | 0.34 | (0.05) | |
| L | 0.34 (0.14) | 0.36 (0.15) | 0.36 (0.12) | 0.35 (0.13) | 0.35 | (0.01) | ||
| No. of voxels | R | 493 | 242 | 121 | 375 | 308 | (161.19) | |
| L | 333 | 295 | 255 | 457 | 335 | (87.34) | ||
| Volume (cm3) | R | 3.33 | 1.63 | 0.82 | 2.53 | 2.08 | (1.09) | |
| L | 2.25 | 1.99 | 1.72 | 3.08 | 2.26 | (0.59) | ||
| SC | −0.39 | 0.20 | 0.71 | 0.20 | 0.18 | (0.45) | ||
| Total SLF | FA | R | 0.44 (0.18) | 0.42 (0.17) | 0.46 (0.15) | 0.48 (0.17) | 0.45 | (0.02) |
| L | 0.42 (0.18) | 0.41 (0.18) | 0.46 (0.16) | 0.44 (0.16) | 0.43 | (0.02) | ||
| Total | 0.43 (0.18) | 0.42 (0.18) | 0.46 (0.16) | 0.46 (0.17) | 0.44 | (0.02) | ||
| LA | R | 0.31 (0.17) | 0.27 (0.14) | 0.30 (0.14) | 0.32 (0.15) | 0.30 | (0.02) | |
| L | 0.29 (0.16) | 0.26 (0.16) | 0.31 (0.14) | 0.29 (0.14) | 0.29 | (0.02) | ||
| Total | 0.30 (0.16) | 0.26 (0.15) | 0.30 (0.14) | 0.31 (0.15) | 0.29 | (0.02) | ||
| No. of voxels | R | 3308 | 1681 | 2027 | 2059 | 2269 | (713.42) | |
| L | 3271 | 1970 | 2647 | 2126 | 2504 | (587.89) | ||
| Total | 6579 | 3651 | 4674 | 4185 | 4772 | (1274.68) | ||
| Volume (cm3) | R | 22.33 | 11.35 | 13.68 | 13.90 | 15.31 | (4.82) | |
| L | 22.08 | 13.30 | 17.87 | 14.35 | 16.90 | (3.97) | ||
| Total | 44.41 | 24.64 | 31.55 | 28.25 | 32.21 | (8.60) | ||
| SC | −0.01 | 0.16 | 0.27 | 0.03 | 0.11 | (0.13) |
Abbreviations: L, left; R, right; SC, symmetry coefficient (L-R)/[0.5(L;plR)]; FA, fractional anisotropy index; LA, lattice anisotropy index.
Delineation of the Subcomponents of the SLF in the Human Brain
In this study four distinct subcomponents of the human SLF were delineated using DT-MRI, based on a priori knowledge from non-human primates. The entire extent of the stem portions of the four subcomponents of SLF were identified in 39 consecutive rostrocaudal coronal sections in four human subjects. Of these 39 sections, 12 representative sections are shown in Figure 1A–L in one of the four subjects. The qualitative morphological analysis was performed in terms of relative location, and orientation of diffusion properties of the tissue for each fiber pathway by direct inspection of the images. In Figure 1, DT-MRI views are shown in the upper part (sections A–L, in the rostrocaudal dimension in the coronal plane). In the center of the figure is a lateral view of the hemisphere showing the rostrocaudal level of the selected sections (sections A–L). The lower panel in Figure 1 shows T2-weighted EPI sections corresponding to the DT-MRI of the upper panel to highlight the location and relative topography of the subdivisions of the SLF. In the lower panel sections the locations of SLF I, SLF II, SLF III and AFh are shown in green. In this figure, AFv is shown in blue (sections E–H).
Out of the 12 consecutive T2 images shown in Figure 1, a subset of four representative sections was selected for the detailed description of the pathways in Figure 2A,C,F,I. This figure shows T1 representative coronal sections (sections A, C, F, I) that indicate the precise location of the SLF subcomponents in relation to cortical and subcortical structures. On one side of each coronal section (radiological right, R) the contour outline of the cortical and subcortical structures is shown in red. On the opposite side of each coronal section are shown the mirror images of the coronal section depicted on the right, to demonstrate the parcellation of specific cortical and subcortical structures (see figure legend for detail). In both the parts of each section the location of SLF I, SLF II and SLF III is shown in green, whereas AFv is shown in blue.
In the coronal plane SLF I, SLF II and SLF III are first delineated at the level of the rostral part of the corpus callosum (Fig. 2A). At this level, SLF I is located in the dorsomedial portion of the white matter of the superior frontal gyrus (F1). SLF II is located in the central part of the white matter, lateral to the corona radiata and the fibers of the corpus callosum (CC) and medial to the middle frontal gyrus (F2) and the pars opercularis of the inferior frontal gyrus (F3o). SLF III is located within the white matter of F3o and the frontal operculum (FO). Further caudally (Fig. 2C), SLF I remains in a dorsomedial position within the white matter of F1 and the supplementary motor area (SMC). SLF II is located above the superior circular sulcus of the insula and lateral to the corona radiata. SLF III is observed within the white matter of the central operculum (CO) and postcentral gyrus (POG). Caudal to the splenium of the corpus callosum (CC) (Fig. 2F) SLF I can be identified in the white matter of the superior parietal region, which is represented by the superior parietal lobule (SPL) and precuneus (PCN). SLF II at this level is located in the white matter of the supramarginal gyrus (SGp) dorsolateral to the posterior horn of the lateral ventricle. Immediately below and distinct from SLF II are the fibers of the AFv, which are oriented dorsoventrally (shown in blue). AFv is located within the white matter of the caudal portion of the superior temporal gyrus at the temporo-occipital (To2) transition region and lateral to the posterior horn of the lateral ventricle (LV). Caudal to the lateral ventricle (Fig. 2I), SLF I can be discerned in the white matter of the medial portion of the superior parietal region, represented in this section by the SPL and PCN. SLF II is situated in the white matter of the angular gyrus (AG) and temporo-occipital region (To2). Note that neither the SLF III nor the arcuate fascicle are observed at this level.
The horizontal course of each component of SLF is represented three-dimensionally in Figure 3. SLF I, SLF II, SLF III are shown in different shades of green, whereas the vertical part of AF (AFv) component is shown in blue. The overall orientation of the SLF fiber system is horizontal, except for the vertical part of the arcuate fascicle. SLF I is more medial and dorsal (Figs 1, 2, 3A,D), whereas SLF III is more ventral and lateral (Figs 1, 2, 3C,D). SLF II (including the horizontal part of AF, i.e. AFh) is located between these two components (Figs 1, 2, 3B,D). The horizontal part of the arcuate fascicle (AFh) cannot be separated from the SLF II, because the two fiber tracts run horizontally and adjacent to one another. However, SLF II and the vertical portion of AF (AFv) can be distinguished caudally, where the fibers of the arcuate fascicle arch around the caudal portion of the Sylvian fissure and their trajectory is vertical in nature (Figs 1, 2, 3B,D). SLF III is restricted mainly to the anterior part of the cerebral hemisphere, whereas SLF I and SLF II extend more caudally (Figs 1–3).
Whereas Figures 1–3 show the coarse trajectory of the SLF in one brain from among the four subjects, Figure 4 shows composite views of the ROI centers of mass in four subjects in Talairach coordinate space in lateral cardinal views for the left side. Each individual case is represented with different color in these diagrams. Specifically, Figure 4A portrays the sagittal view of SLF I; Figure 4B represents the course of SLF II (including the horizontal component of the arcuate fascicle, AFh) in sagittal plane; and Figures 4C,D show the sagittal representation of SLF III and AFv respectively in four subjects. Figure 5A–D portrays the axial view of the extent of SLF I, SLF II (including AFh), SLF III and AFv respectively of both hemispheres, in four subjects in Talairach coordinate space. In each of the cases studied in Talairach coordinate space, the observed relationship between the pathway coarse trajectories and adjacent cortical structures is in agreement with the individual analysis results as demonstrated above (Figs 1 and 2).
From the above description it can be inferred that the SLF, with its four subdivisions, runs through the core of the white matter of the cerebral hemisphere. SLF I and SLF II originate in the occipitoparietal region. SLF I is situated around the cingulate sulcus and continues further forward rostrally within the dorsal medial white matter of the hemisphere lateral to the cingulate and paracingulate sulci, and extends rostrally into the white matter of the superior frontal gyrus. SLF II fibers course within the central core of the white matter above the superior circular sulcus of the insula and are joined by the fiber system that originates in the superior temporal gyrus, which curves around the caudal tip of the Sylvian fissure, i.e. the arcuate fibers of AFv. This combined fiber system, composed of SLF II and the horizontal part of AF (AFh), continues rostrally in a position above the Sylvian fissure and lateral to the corona radiata as a compact bundle. Further rostrally, SLF II remains above the Sylvian operculum and lateral to the corona radiata. At the beginning of the Sylvian fissure SLF II remains above the circular sulcus of the insula and the extreme and external capsules and lateral to the corona radiata. At the beginning of the anterior horizontal ramus of the Sylvian fissure, SLF II fibers course within the white matter of the middle frontal gyrus. SLF III originates in the supramarginal gyrus and its fibers course in the Sylvian opercular white matter and continue into the white matter of the inferior frontal gyrus.
Quantitative Analyses of the SLF Subdivisions
Fractional anisotropy index (FA), lattice anisotropy index (LA), volume and symmetry coefficient measurements for SLF I, SLF II, SLF III and AFv are shown in detail in Table 1 for each individual subject as well as for the group. The group mean left/right values for the FA and LA, its left/right volume and their symmetry coefficient were as follows. For SLF I, FA and LA were 0.36/0.37 and 0.22/0.22, volume was 1.91 cm3/2.38 cm3, and the symmetry coefficient was −0.22 (rightward). For SLF II (including AFh), FA and LA were 0.44/0.47 and 0.30/0.31, volume was 9.77 cm3/9.01 cm3, and the symmetry coefficient was 0.08 (leftward) respectively. For SLF III, FA and LA were 0.38/0.42 and 0.24/0.26, volume was 2.96 cm3/1.85 cm3, and the symmetry coefficient was 0.46 (leftward). For AFv, FA and LA were 0.50/0.50 and 0.35/0.34, volume was 2.26 cm3/2.08 cm3, and the symmetry coefficient was 0.08 (leftward). The group average left/right values of the entire SLF system (i.e. the four subdivisions combined) for left/right FA and LA were 0.43/0.45 and 0.29/0.30; volume was 16.90 cm3/15.30 cm3, and the symmetry coefficient was 0.10 (leftward).
Discussion
According to the verbatim description by Dejerine (1895):
the superior longitudinal fasciculus (SLF) is located in the central part of the cerebral white matter lateral to the cingulum bundle. It appears as a compact bundle only over the parietal operculum. It remains above the dorsal Sylvian operculum and the circular sulcus, and lateral to the corona radiata. In coronal sections its shape is triangular: its infero-lateral angle corresponds to the base of the Sylvian operculum, its infero-medial angle corresponds to the external capsule entering in the interspace between the external capsule and the claustrum, and its superior angle is merged in the neighboring layer of fibers. Caudally, at the level of the posterior tip of the Sylvian fissure, SLF curves downward crossing the fibers of the corona radiata and the corpus callosum and descending into the parieto-occipito-temporal gyri. The most superficial fibers radiate to the anterior part of the superior temporal gyrus; the middle layer of fibers ends in the posterior part of the superior temporal and middle temporal gyri. The deepest fibers radiate into the supramarginal gyrus, the angular gyrus, and the gyri of the external occipital surface.
Dejerine also reported that rostrally, according to Meynert (1865), SLF ends in the Rolandic operculum and in the operculum of the inferior frontal gyrus and that, according to Schnopfhagen (1890), it crosses the midline at the genu of the corpus callosum and ends in the contralateral frontal cortical regions. In summary, SLF, as described above, would be an association fiber pathway connecting the lateral part of the temporo-parieto-occipital regions with the convexity of the frontal lobe. This bundle was designated the fasciculus arcuatus by Burdach (Dejerine, 1895). Dejerine considered that this fiber pathway is composed of short association fibers connecting two neighboring gyri and that only its deep layers, particularly the ones that are in relationship with the external capsule, contain some longer fibers that can connect more distant gyri. In his lesion material Dejerine was not able to follow degenerated fibers of SLF beyond the gyri adjacent to the lesion.
Most of Dejerine's conclusions regarding the SLF were based on human material prepared with myelin stain techniques. In contrast to descriptive studies of fiber bundles in humans, in the monkey the fiber pathways have been traced using experimental techniques that allow detection of the exact origin and termination of the association pathways. Thus, it has been shown in the monkey that, from the parietal region, fibers travel longitudinally in the central core of the white matter, remaining above the circular sulcus of the insula and lateral to the corona radiata (Petrides and Pandya, 1988). The main contingent of fibers of SLF has been designated SLF II. These fibers terminate in dorsal frontal Brodmann (1905) areas 6 and 8 as well as area 46. The contingent of fibers that originates from the caudal superior temporal gyrus and the cortex of the superior temporal sulcus curves around the depth of the caudal portion of the Sylvian fissure and runs along with the fibers of SLF II (Petrides and Pandya, 1984). This group of fibers has been designated the arcuate fasciculus (AF). AF fibers continue into the frontal lobe and terminate predominantly in the dorsal part of area 8 and in area 46. AF becomes distinct mainly at the parietal opercular level. It can be distinguished in most of its course from surrounding fiber systems, such as the corona radiata, the subcallosal fasciculus of Muratoff, the occipitofrontal fascicle, the external and extreme capsules, and the U-fibers. The experimental observations in monkeys also have revealed two additional components of SLF, i.e. SLF I and SLF III. SLF I originates in the superior and medial parietal cortex, runs around the cingulate sulcus as well as in the white matter of the superior parietal and frontal regions and terminates in the dorsal part of frontal areas 6, 8, area 9 and in the supplementary motor region (M II). SLF III originates from the rostral part of the inferior parietal lobule (supramarginal gyrus) and terminates in the ventral part of area 6 and in areas 44 and 46 in the frontal lobe. Thus, in non-human primates the SLF is quite broad and its terminations in the frontal lobe involve a number of regions. It should be pointed out that the SLF I, SLF II, SLF III and AF fiber pathways are bidirectional (Petrides and Pandya, 2002).
According to our in vivo DT-MRI analysis, SLF also can be divided into four components, in humans, i.e. SLF I, SLF II, SLF III and AF. The analyses of the individual data sets (Figs 1, 2 and 3) as well as of the individual and grouped data mapped onto the Talairach coordinate space (Figs 4 and 5) have enabled us to elucidate the topography of the stem portion of the four subdivisions of SLF in the human brain. To interpret the location of the various pathways from the T1-weighted and DT-MRI data, we have followed the criteria of the semi-automated MRI-based morphometric method described in previous reports (Rademacher et al., 1992; Filipek et al., 1994; Caviness et al., 1996). Figure 2 shows an example of the application of this method to segment and parcellate the cortical and subcortical structures of T1-weighted coronal sections and to compare the DT-MRI observations of SLF I, SLF II, SLF III and AF with the cortical and subcortical parcellation units.
Our observations suggest that SLF I is situated within the white matter of the superior parietal lobule (Brodmann [1909] area 7), the superior parts of the precuneus (medial area 7), postcentral gyrus (area 5), precentral gyrus (area 4), and the posterior part of superior frontal gyrus (areas 8 and 9) as well as the supplementary motor area (area 6) (Figs 2, 3A, 4A and 5A). SLF II, including the horizontal portion of AF (AFh), is located within the white matter of the occipito-temporo-parietal transition region (area 19), angular gyrus (area 39), supramarginal gyrus (area 40), postcentral gyrus (areas 3, 1 and 2), precentral gyrus (area 4), and middle frontal gyrus (areas 6 and 46) (Figs 2, 3B, 4B and 5B). SLF III maintains a lateral position in the hemispheric white matter, coursing in the anterior–posterior dimension within the dorsal Sylvian operculum (i.e. parietal area 40 — supramarginal gyrus, ventral part of pericentral areas 43, 2, 4 and 6, and frontal premotor area 44 — pars opercularis) (Figs 2, 3C, 4C and 5C). The vertical portion of the arcuate fascicle (AFv) is mapped within the white matter of the supramarginal gyrus (area 40), the posterior part of the superior temporal gyrus (area 22), and the temporo-occipital region (area 37) (Figs 2, 3B, 4D and 5D).
The observations shown in Figures 1 and 2 also correspond to the Talairach coordinate space analysis as shown in Figures 4 and 5 for the SLF I, SLF II, SLF III and AFv. The trajectories and the topographic anatomy of the stem portion of these fiber pathways, in the four human subjects studied using DT-MRI, showed similarities to the observed trajectories and topography of the stem portion of SLF I, SLF II, SLF III and AF in the monkey using experimental techniques. In addition, compared to the monkey data, the present results showed that in the human the SLF I, SLF II and SLF III extend more posteriorly within the dorsal parietal regions and parieto-occipital border zones. These fiber fascicles also extend more anteriorly within the frontal association areas. This may be due to the fact that the parietal and frontal association regions are considerably expanded in the human.
Using DT-MRI we were able to define fiber pathways at the level of their stem portion (Makris et al., 1997) in cases where the stem portion of pathways have characteristic orientations that are contrasted from the orientations of adjacent components. However, to delineate the entire trajectory of a fiber tract, its origins and terminations must be traced as well. Although this is possible with experimental methods in non-human primates, it is not feasible for long fiber tracts in the human (Makris et al., 2002b). Therefore, regarding the specific origins and terminations of the SLF, we could extrapolate from the monkey experimental material. Taking into account the evolutionary expansion of associational cortical regions in the human, the topological similarities observed for the stem portions of the SLF I, SLF II, SLF III and AFv in the human subjects as compared to the monkey lend credence to the possibility that there may be similarities with respect to the origins and terminations of these pathways. It can be inferred that the SLF I in humans may originate from the superior and medial parietal cortex (superior parietal lobule areas 5 and 7 and precuneus area 7), run through the white matter of the superior parietal and frontal regions and terminate in the dorsal part of areas 6, 8 and 9 and the supplementary motor region (Fig. 3A). Likewise, SLF II may originate from the posterior–inferior parietal region (angular gurus — area 39), run through the central core of the white matter above the Sylvian fissure and terminate in the prefrontal region (areas 46, 6 and 8) (Fig. 3B). AF may connect the caudal superior temporal area 22 with the frontal lobe areas 8 and 46 (Fig. 3B). In contrast, SLF III may originate from the supramarginal gyrus of the inferior parietal lobule (area 40), occupy the white matter of the pericentral and frontal opercular regions and connect preferentially with area 44 (pars opercularis) and ventral area 6 of the frontal lobe and to a lesser degree with area 46 (Fig. 3C). It should be pointed out that these connections may be bidirectional in nature in humans as has been shown in monkeys (Petrides and Pandya, 2002).
Functional Role of Subdivisions of SLF
Given that DT-MRI offers a method to delineate and measure the four subcomponents of SLF, it is worth reviewing the functional role of this fiber system to aid in reasoning based on quantitative observations of these structures. Inference about the role of SLF in humans comes from multiple sources such as the course of its fiber trajectories, non-human primate studies, lesion-deficit correlations in humans as well as the known functional role of the cortical areas that are interconnected by these fiber pathways derived from functional neuroimaging.
SLF I
Several studies have shown that the superior parietal lobule codes the location of body parts in a body-centered coordinate system (e.g. Duffy and Birchfiel, 1971; Sakata et al., 1973; Mountcastle et al., 1975; Lacquaniti et al., 1995). Therefore, SLF I, by virtue of its interconnection with medial and superior parietal regions, with M II and with the dorsal premotor region, can contribute to the regulation of higher aspects of motor behavior. Lesions of the dorsal premotor regions in humans and monkeys result in severe deficits in conditional associative tasks in which different competing motor acts must be selected on the basis of appropriate conditional rules (Petrides, 1982, 1987; Halsband and Passingham, 1982; Petrides and Pandya, 2002).
SLF II
It has been shown that the caudal part of the inferior parietal lobule plays a major role in visual and oculomotor aspects of spatial function in monkeys (Mountcastle et al., 1975; Hyvarinen and Shelepin, 1979; Mesulam, 1981; Posner et al., 1984; Andersen and Gnadt, 1989; Goldberg and Segraves, 1989; Bisley and Goldberg, 2003). Moreover, humans with damage in the caudal inferior parietal area exhibit severe impairment in spatial attention (e.g. Mesulam, 1981; Posner et al., 1984). Therefore, SLF II can be viewed as a major link providing the prefrontal cortex with information from the parietal lobe concerning the perception of the visual space. Since the SLF II pathway as mentioned above in humans is bidirectional, the fibers originating from the prefrontal cortex and directed back to the posterior parietal region could provide a means by which the prefrontal cortex can regulate the focusing of attention in different parts of space. In addition, damage to SLF II could result in disorders of spatial working memory by virtue of interrupting relationships with prefrontal area 46 (Preuss and Goldman-Rakic, 1989; Petrides and Pandya, 2002).
SLF III
In monkeys, SLF III connects the rostral part of the inferior parietal lobule with the lateral inferior frontal lobe in a bidirectional way (Preuss and Goldman-Rakic, 1989; Petrides and Pandya, 2002). The rostral portion of the inferior parietal lobule has been shown to receive input from the ventral precentral gyrus (Jones and Powell, 1970; Pandya and Seltzer, 1982) and its neurons exhibit complex somatosensory responses related to the face and arm in monkeys (Hyvarinen and Shelepin, 1979; Leinonen et al., 1979a,b; Robinson and Burton, 1980; Taira et al., 1990). Therefore, SLF III probably provides the ventral premotor region and the adjacent area 44 with higher order somatosensory input. In humans, the gestural impairments observed in clinical syndromes of ideomotor apraxia are often the result of lesions of the rostral inferior parietal cortex or of the underlying white matter (De Renzi, 1989). The possible connections between frontal area 44 (pars opercularis) and the supramarginal gyrus (area 40) via SLF III suggest that SLF III may have a role in the articulatory component of language. The bidirectional connections between the inferior parietal lobule and the ventral prefrontal area 46 via this fiber pathway may be critical for monitoring orofacial and hand actions since this region has been shown to play a role in working memory (Preuss and Goldman-Rakic, 1989; Petrides, 1994, 1996; Petrides and Pandya, 2002).
AF
The fibers of the arcuate fascicle connect the caudal part of the superior temporal gyrus (area Tpt) with the dorsal part of prefrontal area 8 in the monkey. These fibers run contiguously with the fibers of SLF II. Observations using neuroimaging along with the monkey data indicate that in humans the AF likely has a similar trajectory. Through this pathway the caudal dorsolateral prefrontal cortex may receive auditory spatial information. There is evidence that neurons in area Tpt respond selectively to the sound source (Leinonen et al., 1980). Numerous neuroimaging as well as anatomical and physiological observations in both humans and monkeys are consistent with these findings (Petrides and Pandya, 1988; Hackett et al., 1999; Kaas and Hackett, 1999; Romanski et al., 1999a,b; Kaas and Hackett, 2000; Rauschecker and Tian, 2000; Hackett et al., 2001; Morosan et al., 2001). Like SLF II, which may provide a means for visuospatial interaction between the prefrontal cortex and the posterior parietal region, AF by linking the frontal and temporal cortices may be viewed as providing a means by which the prefrontal cortex can receive and modulate audiospatial information (Petrides and Pandya, 2002).
Quantitative Analysis
In the present study we performed measurements of biophysical parameters for anisotropy such as FA and LA, and of volume and of symmetry for SLF I, SLF II, SLF III and AFv. FA ranged from 0.36 to 0.50 on the left and from 0.37 to 0.50 on the right, whereas LA ranged from 0.22 to 0.35 on the left and from 0.22 to 0.34 on the right. The overall FA and LA for SLF (all four subcomponents combined) were 0.44 and 0.29 respectively. The FA and LA values for the stems of the four subcomponents of SLF were similar to the FA and LA reported in other studies of different fiber tracts in the normal human brain. Pierpaoli and Basser reported FA and LA values of 0.46 and 0.28 respectively in subcortical white matter (Pierpaoli and Basser, 1996a), and Pierpaoli et al. (1996) showed an LA of 0.31 in the centrum semiovale. Klingberg et al. (2000) showed mean unscaled fractional anisotropy values in temporoparietal white matter that ranged from 0.38 to 0.59. In a study by Virta et al. (1999), the LA ranged from 0.30 to 0.53 across the different locations of the corticospinal tract. In a previous study of the cingulum bundle we have shown that FA and LA values of this corticocortical association pathway ranged from 0.45 to 0.54 and from 0.29 to 0.43 respectively (Makris et al., 2002a). Similarly Rose et al. (2000) reported LA values for the corticospinal tract of 0.39, for the cingulum bundle of 0.36, and for the superior longitudinal fasciculus of 0.46. Thus, it seems that our results of FA and LA for the subcomponents of SLF are in agreement with the data reported for other fiber systems.
The overall volume of SLF (all four subcomponents combined) was 32.21 cm3. These values should be contrasted with measurements derived from purely topographic, constrained methods such as ‘white matter parcellation’ (Makris et al., 1999). Specifically, the white matter of the superior sagittal stratum sector or ‘Ss total’ as measured in 20 healthy adult subjects using T1-weighted MRI was estimated to be 28.42 cm3. This corresponds to ∼7% of total cerebral white matter. The superior sagittal stratum sector corresponds approximately to the SLF and these results are comparable in magnitude, although they reflect different underlying methodologies and anatomic considerations. The coefficient of variation (CV) is large for volumes (27% for total SLF) and more stable for anisotropy interpretations (5% for total fractional anisotropy). This is in part due to the low number of subjects used in the present study (i.e., N=4), combined with the large volumetric variation in the general population in specific white matter regions [superior strata regions, which include the SLF, CV range 12–70% (Makris et al., 1999)]. Due to the small number of subjects in this report, however, care should be taken in interpretation of the population variance of these volumetric observations.
Of the four subcomponents of SLF, SLF III showed leftward asymmetry. Our overall measurements on the linearity of the four subcomponents of SLF showed a slight total leftward asymmetry of this fiber system. These results, although representative of a small group of subjects, are consistent with the possibility that SLF III may be more closely related to language.
DTI Tractography of SLF
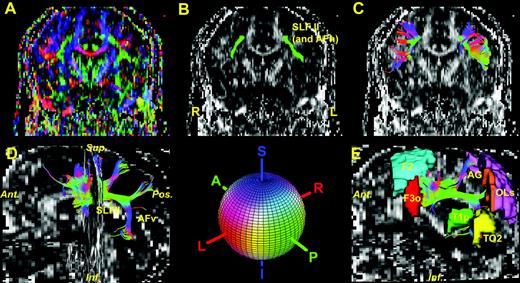
We used the DTI Task Card software (Massachusetts General Hospital) to obtain SLF I, SLF II, SLF III and AFv. The algorithm used by the software was a streamline method that develops fiber tracts by following the direction of the principle eigenvector at each step starting from a seed point (Mori et al., 1999; Lori et al., 2002). Figure 6 illustrates the results of this tractographic approach in one of the brains analyzed in this study. Of the four subdivisions of SLF we were able to delineate only SLF II (including AFh) and AFv. In Figure 6A, the color fractional anisotropy map or PEM is shown in a coronal section passing through the mid-thalamus. The grayscale fractional anisotropy map of the identical coronal section is used as background in Figure 6B,C. In Figure 6B, one ROI for each hemisphere was selected as seed locations to initiate the fiber tracking process. These two ROIs were strategically placed on the stem of SLF II and AFh based on the fractional anisotropy color map, following the identical criteria that we used to segment SLF II and AFh. It should be pointed out that anatomically driven selection of seed locations and a priori anatomical knowledge of the tracts are necessary for the successful delineation and interpretation of a fiber pathway using tractography. In Figure 6C, the rostral portion of SLF II in each hemisphere is shown as resulted from the fiber tracking process of neighboring voxels that had a primary diffusion orientation close (as determined by an angular threshold) to the orientation of the seed voxel. The color gives the orientation of the eigenvector as shown in the colored sphere. In Figure 6D, three-dimensional representations of SLF II and AFv are shown. In Figure 6D, SLF II (including AFh) and AFv are contrasted against a background consisting of a fractional anisotropy map of a mid-sagittal plane. The fractional anisotropy map of a coronal plane was added for reference. The stem of SLF II and AFh course as a compact structure rostrally, whereas caudally there is a bifurcation, giving rise to the stem of the vertical part of the arcuate fasciculus (AFv) ventrally, and dorsally to the stem of the parietal projection of SLF II. The cortical regions related to SLF II and AFv were added in Figure 6E. These are represented by the middle frontal gyrus (F2) and the inferior frontal gyrus, pars opercularis (F3o) in the frontal lobe, by the angular gyrus (AG) in the parietal lobe, by the posterior part of the superior temporal gyrus (T1p) and the superior temporo-occipital transition region (TO2) in the temporal lobe, and by the dorsolateral occipital region (OLs) in the occipital lobe. While these findings seem to be generally in agreement with what we presented in this study as a result of extrapolation from the monkey autoradiographic material, there are some considerations that should be raised. First, tractography is a versatile tool for elucidating trajectory of fiber pathways but less so for their volumetric analysis (Lori et al., 2002). One important component for this is the dependence of the details of the tracts on the specific parameters such as anisotropy and angular thresholds as well as ROI selection. Second, the size of a fiber bundle plays an important role in its identification. For instance, the streamline algorithms tend to follow the way of the major bundle. This interrupts fiber tractographic identification in regions where large bundles such as the corticospinal tract are predominating over small tracts such as SLF I. This does affect the fiber pathway volumetric analysis as well; however, discrete portions of the smaller bundle may be still identifiable and contribute to the volumetry of the tract's stem. Finally, tractography as well as segmentation for volumetry of fiber pathways are heavily relying on a priori knowledge of the anatomical and topographical details of the bundles.
Illustration of tractographic results for SLF II (including AFh) and AFv. (A) The color fractional anisotropy (fractional anisotropy) map or principal eigenvector map (PEM) in a coronal section. The grayscale FA map of the identical coronal section is used as background in (B) and (C). In (B), one region of interest (ROI) (shown in green), which is the SLF II (including the AFh) for each hemisphere was selected as seed location to initiate the fiber tracking process. In (C), the rostral portion of SLF II in each hemisphere is shown as resulted from the fiber-tracking process. The color gives the orientation of the eigenvector as shown in the colored sphere. Red is right–left, green is anterior–posterior and blue is superior–inferior orientations. (D) Three-dimensional representations of SLF II and AFv. SLF II (including AFh) and AFv are contrasted against a background consisting of a fractional anisotropy map of a mid-sagittal plane. The fractional anisotropy map of a coronal plane was added for reference. The cortical regions related to SLF II and AFv were added in (E). Abbreviations, AFh, horizontal part of arcuate fascicle; AFv, vertical part of arcuate fascicle; AG, angular gyrus; F2, middle frontal gyrus; F3o, inferior frontal gyrus, pars opercularis; OLs, lateral occipital cortex, superior; SLF, superior longitudinal fascicle; T1p, superior temporal gyrus, posterior; TO2, middle temporal gyrus, temporooccipital.
The aim of the present study was the identification and volumetric analysis of the four subdivisions of SLF. Therefore, we concentrated on the segmentation of the orientation information rather than trying to identify the presence of the pathways from a purely tractographic perspective.
In conclusion, in this study we have identified the location of SLF and its four subdivisions in the human brain. According to our observations there are four major subcomponents of the SLF. These four components have been discerned using knowledge of similar pathways in non-human primates observed with experimental techniques. In classical behavioral neurology, as well as in current studies in cognitive neuroscience and in human neuroanatomy, the SLF fiber system has been considered a single entity and not as composed of distinct subdivisions. In addition, the term arcuate fasciculus has been used interchangeably with superior longitudinal fasciculus. Historically, SLF or the AF has been central to the neurobiological interpretation of higher brain function generally and for language and language disorders in particular (e.g. Wernicke, 1874; Geschwind, 1965a,b; Lichtheim, 1884; Heilman et al., 1970; Goodglass, 1993). Similarly, in recent years SLF has been investigated in a number of anatomical (Curnes et al., 1988; Shen et al., 1991; Aboitiz and Garcia, 1997; Mori et al., 1999; Axer et al., 2000; Catani et al., 2002; Mamata et al., 2002; Hagmann et al., 2003), functional (Chertkow and Murtha, 1997, Duffau et al., 2002), developmental (Okuda, 1994; Schmithorst et al., 2002), cognitive (Damasio and Damasio, 1980; Caplan, 1987, 1992; Kosslyn and Koenig, 1992), and clinical (Naeser and Hayward, 1979; Tanabe et al., 1987, 1989; Whittle and Fraser, 1991; Demeurisse and Capon, 1991; Kosslyn et al., 1993; Shuren et al., 1995; Pramstaller and Marsden, 1996; Pujol et al., 1997; Saito et al., 1997; Nass et al., 1998; Anderson et al., 1999; Pujol et al., 2000; Ikeda et al., 2001; Rose et al., 2000; Mori, 2002; Catani et al., 2003) studies using available neuroimaging techniques. In terms of its volume, SLF may be the major cortical association fiber pathway in the human brain. It interconnects frontal, temporal and parietal association areas, which emphasizes its centrality to many associative or higher brain functions. Thus, clarification of its anatomy is necessary in order to correlate structural and functional parameters more precisely in cognitive investigations. The segregation of this fiber system into four components in the human in vivo with different topography and potentially different functional affiliations may provide a finer level of analysis for human clinical studies. Such novel understanding of the anatomy of the SLF fiber system in humans will increase specificity in investigations of structural–functional and anatomical–clinical relationships and will extend the functional characterization of SLF beyond the language modality, namely to the domain of other higher cortical functions such as memory, attention, and executive as well as visuospatial and audiospatial processing.
Human Research Statement
The experiments undertaken in this paper were performed with the understanding and written informed consent of each subject.
The authors gratefully acknowledge Dr Edward H. Yeterian, Mr George M. Papadimitriou, Mr Joseph J. Normandin and Mr James D. Howard for their valuable contributions to the preparation of this manuscript. Preparation of this article was supported in part by grants from: the National Association for Research in Schizophrenia and Depression (NARSAD), and the Amyotrophic Lateral Sclerosis Association (ALSA) to N.M.; the Fairway Trust to D.K.; the National Center for Research Resources (P41RR14075), and the National Institutes of Health (R01-NS38477) to A.G.S., and the Mental Illness and Neuroscience Discovery (MIND) Institute.
References
Anderson JM, Gilmore R, Roper S, Crosson B, Bauer RM, Nadeau S, Beversdorf DQ, Cibula J, Rogish M, 3rd, Kortencamp S, Hughes JD, Gonzalez Rothi LJ, Heilman KM (
Axer H, Berks G, Keyserlingk DG (
Basser PJ, Pierpaoli C (
Basser PJ, Mattiello J, LeBihan D (
Bisley JW, Goldberg ME (
Brodmann K (
Brodmann K (
Caplan D (
Catani M, Howard RJ, Pajevic S, Jones DK (
Catani M, Piccirilli M, Cherubini A, Tarducci R, Sciarma T, Gobbi G, Pelliccioli G, Petrillo SM, Senin U, Mecocci P (
Caviness VS, Jr, Makris N, Meyer JW, Kennedy DN (
Curnes JT, Burger PC, Djang WT, Boyko OB (
Demeurisse G, Capon A (
Duffau H, Capelle L, Sichez N, Denvil D, Lopes M, Sichez JP, Bitar A, Fohanno D (
Duffy FH, Burchfiel JL (
Filipek PA, Richelme C, Kennedy DN, Caviness VS, Jr (
Galaburda AM, Corsiglia J, Rosen GD, Sherman GF (
Hackett TA, Stepniewska I, Kaas JH (
Hackett TA, Preuss TM, Kaas JH (
Hagmann P, Thiran JP, Jonasson L, Vandergheynst P, Clarke S, Maeder P, Meuli R (
Halsband U, Passingham R (
Heilman KM, Pandya DN, Geschwind N (
Heimer L (
Hyvarinen J, Shelepin Y (
Ikeda A, Matsumoto R, Ohara S, Kunieda T, Shirakashi Y, Kaji R, Fukuyama H, Shibasaki H (
Jones EG, Powell TPS (
Kaas JH, Hackett TA (
Kaas JH, Hackett TA (
Klingberg T, Hedehus M, Temple E, Salz T, Gabrieli JD, Moseley ME, Poldrack RA (
Kosslyn SM, Daly PF, McPeek RM, Alpert NM, Kennedy DN, Caviness VS, Jr (
Lacquaniti F, Guigon E, Bianchi L, Ferraina S, Caminiti R (
Leinonen L, Nyman G (
Leinonen L, Hyvarinen J, Sovijarvi AR (
Leinonen L, Hyvarinen J, Nyman G, Linnankoski I (
Lori NF, Akbudak E, Shimony JS, Cull TS, Snyder AZ, Guillory RK, Conturo TE (
Makris N, Pandya DN, Normandin JJ (
Makris N, Meyer JW, Bates JF, Yeterian EH, Kennedy DN, Caviness VS (
Makris N, Papadimitriou GM, Worth AJ, Jenkins BG, Garrido L, Sorensen AG, Wedeen V, Tuch DS, Wu O, Cudkowicz ME, Caviness VS, Jr, Rosen B, Kennedy DN (
Makris N, Worth AJ, Sorensen AG, Papadimitriou GM, Wu O, Reese TG, Wedeen VJ, Davis TL, Stakes JW, Caviness VS, Kaplan E, Rosen BR, Pandya DN, Kennedy DN (
Mamata H, Mamata Y, Westin CF, Shenton ME, Kikinis R, Jolesz FA, Maier SE (
Mesulam MM (
Meynert T (
Mori S (
Mori S, Crain BJ, Chacko VP, van Zijl PC (
Morosan P, Rademacher J, Schleicher A, Amunts K, Schormann T, Zilles K (
Mountcastle VB, Lynch JC, Georgopoulos A, Sakata H, Acuna C (
Naeser MA, Hayward RW (
Nass R, Leventhal F, Levine B, Lebron D, Maxfield C, McCaul P, George A, Allen J (
Okuda Y (
Pajevic S, Pierpaoli C (
Pandya DN, Seltzer B (
Petrides M (
Petrides M (
Petrides M (
Petrides M, Pandya DN (
Petrides M, Pandya DN (
Petrides M, Pandya DN (
Pierpaoli C, Basser PJ (
Pierpaoli C, Basser PJ (
Pierpaoli CJ, Basser PJ, Barnett A, Di Chiro G (
Posner MI, Walker JA, Friedrich FJ, Rafal RD (
Poupon C, Clark CA, Frouin V, Regis J, Bloch I, Le Bihan D, Mangin J (
Preuss TM, Goldman-Rakic PS (
Pujol J, Bello J, Deus J, Marti-Vilalta JL, Capdevila A (
Pujol J, Bello J, Deus J, Cardoner N, Marti-Vilalta JL, Capdevila A (
Rademacher J, Galaburda AM, Kennedy DN, Filipek PA, Caviness VS, Jr (
Rauschecker JP, Tian B (
Robinson CJ, Burton H (
Romanski LM, Bates JF, Goldman-Rakic PS (
Romanski LM, Tian B, Fritz J, Mishkin M, Goldman-Rakic PS, Rauschecker JP (
Rose SE, Chen F, Chalk JB, Zelaya FO, Strugnell WE, Benson M, Semple J, Doddrell DM (
Saito Y, Kita Y, Bando M, Nagura H, Yamanouchi H, Ishii K (
Sakata H, Takaoka Y, Kawarasaki A, Shibutani H (
Schmithorst VJ, Wilke M, Dardzinski BJ, Holland SK (
Schnopfhagen F (
Shen WC, Yang CF, Chang CY, Ho WL (
Shuren JE, Schefft BK, Yeh HS, Privitera MD, Cahill WT, Houston W (
Sorensen AG, Wu O, Copen WA, Davis TL, Gonzalez RG, Koroshetz WJ, Reese TG, Rosen BR, Wedeen VJ, Weisskoff RM (
Taira M, Mine S, Georgopoulos AP, Murata A, Sakata H (
Tanabe H, Sawada T, Inoue N, Ogawa M, Kuriyama Y, Shiraishi J (
Tanabe H, Ikeda M, Murasawa A, Yamada K, Yamamoto H, Nakagawa Y, Nishimura T, Shiraishi J (
Virta A, Barnett A, Pierpaoli C (
Author notes
1Harvard Medical School Departments of Neurology and Radiology Services, Center for Morphometric Analysis, HST A. Martinos Center, Massachusetts General Hospital, Boston, MA 02129, USA, 2Boston University School of Medicine, Department of Anatomy and Neurobiology, Boston, MA 02215, USA and 3Harvard Medical School Departments of Neurology and Radiology Services, HST A. Martinos Center, Massachusetts General Hospital, Boston, MA 02129, USA