


Abstract
Event-related functional magnetic resonance imaging was used to investigate brain processing of the signals ascending from peripheral C and Aδ fibers evoked by phasic laser stimuli on the right hand in humans. The stimulation of both C and Aδ nociceptors activated the bilateral thalamus, bilateral secondary somatosensory cortex, right (ipsilateral) middle insula, and bilateral Brodmann's area (BA) 24/32, with the majority of activity found in the posterior portion of the anterior cingulate cortex (ACC). However, magnitude of activity in the right (ipsilateral) BA32/8/6, including dorsal parts in the anterior portion of the ACC (aACC) and pre-supplementary motor area (pre-SMA), and the bilateral anterior insula was significantly stronger following the stimulation of C nociceptors than Aδ nociceptors. It was concluded that the activation of C nociceptors, related to second pain, evokes different brain processing from that of Aδ nociceptors, related to first pain, probably due to the differences in the emotional and motivational aspects of either pain, which are mainly related to the aACC, pre-SMA, and anterior insula.
Introduction
Generally, acute pain is classified as first and second pain associated with rapidly conducting Aδ fibers and slowly conducting unmyelinated C fibers, respectively. First pain aims at achieving relative safety from the source of injury, whereas second pain, with its strong affective component, attracts longer lasting attention and initiates behavioral responses in order to limit further injury and optimize recovery (Wall 1979; Ploner and others 2002). Accordingly, the distinct brain representations for first and second pain should reflect distinct biological functions of both sensations.
Because a phasic painful laser pulse can produce brain responses related to first pain (Mor and Carmon 1975), pain perception in humans has been intensively investigated in neuroimaging studies using positron emission tomography (PET) and functional magnetic resonance imaging (fMRI). Using conventional laser stimuli, these studies showed activations in multiple regions such as the primary somatosensory cortex (SI), secondary somatosensory cortex (SII), insula cortex, and cingulate cortex (Svensson and others 1997; Xu and others 1997; Mauguiere and others 1999; Sawamoto and others 2000; Bingel and others 2002; Bornhovd and others 2002; Buchel and others 2002; Bingel, Glascher, and others 2004; Bingel, Lorenz, and others 2004). However, the differential brain responses to signals ascending from peripheral Aδ and C fibers are unclear and remain to be investigated because these neuroimaging studies only investigated brain processing on the activation of Aδ nociceptors. Although painful laser pulses activate concomitantly Aδ and C nociceptors, it was very difficult or impossible to activate C nociceptors independently using laser stimulation (Bromm and Treede 1984).
To examine brain processing related to the activation of C nociceptors, capsaicin injection has been employed in a few neuroimaging studies using PET and fMRI. However, capsaicin is associated with the stimulation of not only C nociceptors but also Aδ nociceptors (Holzer 1991; Szallasi 1994), and the responses it evokes reflect a mixture of bottom–up and top–down processes and complex pain-coping strategies, as well as perceptual and physiological phenomena like temporal summation (Price and others 1977) and wind up (Mendell and Wall 1965) because capsaicin induces long-lasting tonic pain. Therefore, using phasic (short lasting) stimulation to selectively activate C nociceptors is more suitable to the study of brain processing based on identification of the onset period for laser stimuli and fMRI scans than tonic capsaicin-induced stimulation.
Recently, a Belgian group (Bragard and others 1996; Opsommer and others 1999) developed a new method for selectively stimulating C nociceptors using a laser pulse applied to a tiny area of skin and succeeded in recording laser-evoked potentials (LEPs) related to the activation of C nociceptors (Plaghki and Mouraux 2003). The physiological background of this method is that the C nociceptors in the skin have a higher density than the Aδ nociceptors (Ochoa and Torebjork 1989; Schmidt and others 1994; Treede and others 1994). We adopted this new approach by arranging the stimulus method. We used an aluminum plate with many holes whereas the Belgian group used a plate with 1 hole attached at the top of the laser stimulation probe. We concluded that this method selectively activates C nociceptors based on studies using microneurography (Qiu and others 2003), electroencephalography (EEG) (Qiu and others 2001, 2002; Tran and others 2001; Tran and others 2003), and magnetoencephalography (Tran and others 2002; Qiu and others 2004).
In this study, we used fMRI to identify brain activity evoked by the stimulation of C nociceptors using an aluminum plate with numerous holes in healthy human subjects. We also used fMRI following the activation of Aδ nociceptors with a conventional method (without using the aluminum spatial filter) to compare the results between the 2 methods. This procedure should demonstrate the distinct brain responses reflecting different biological functions of both first and second pain.
Methods
Subjects
Thirteen healthy male volunteers (1 left handed) participated in this study. They ranged in age from 25 to 39 (mean ± standard deviation: 30.9 ± 4.3). This study was approved by the Ethics Committee at our Institute, and all participants gave their informed consent. None of the subjects suffered from diseases that might affect normal somatosensory and pain perception. During scanning, 1 investigator stayed with the subject in the scanner room and applied the laser stimuli to the dorsum of the right hand.
Stimulation of C and Aδ Nociceptors
A Tm:YAG laser stimulator (Carl Baasel Lasertech, Starnberg, Germany) was used to apply brief radiant pulses to the skin of the subjects with a wavelength of 1960 nm, a pulse duration of 1 ms, and a spot diameter of 3 mm. For stimulating C nociceptors, we used a thin aluminum plate attached to the top of the stimulus probe (distal end of laser optical fiber) as a spatial filter. This filter was 0.1 mm in depth, and in an area of 10 × 10 mm2 on this plate, parallel lines were drawn every 1 mm, giving 11 × 11 intersections. A total of 121 (11 × 11) thin holes were drilled at these intersections, each with a diameter of 0.4 mm, corresponding to an area of 0.125 mm2 for each hole. The laser pulse penetrated 7–11 holes on average. This aluminum spatial filter was placed as close as possible (less than 2 mm) above the skin to reduce the effect of diffraction. The principle of this method was based on that of previous studies (see Kakigi and others 2003; Plaghki and Mouraux 2003). For stimulating Aδ nociceptors, we used conventional laser stimuli without using the aluminum spatial filter. Because stimulus duration was very short, 1 ms, subjects felt a sharp (Aδ fibers stimulation) and burning or dull (C fibers stimulation) pain for a short period.
Before fMRI scanning, we determined the stimulus intensity for each subject by recording LEPs by averaging EEG. Bragard and others (1996) used 2 different laser strengths for activating C nociceptors, one weaker than and one the same as that for Aδ nociceptors, and recorded similar LEP findings between them. However, to minimize the effect of a difference of laser strength, we used the same laser strength for activating C and Aδ nociceptors, though the energy absorbed in the skin might not be exactly the same because of the spatial filter used for activating C nociceptors. The laser strength was determined as the weakest that could evoke clear LEPs following the stimulation of both C (using a thin aluminum plate) and Aδ (conventional method) nociceptors in each subject to minimize skin damage and discomfort (Qiu and others 2004). The mean intensity was 159.6 mJ, ranging from 145.0 to 180.0 mJ. The mean peak latency of the main positive component of LEPs following the stimulation of Aδ and C nociceptors was 351.1 and 932.2 ms, respectively. Using this procedure, we had confirmed that the present stimulus method was appropriate before recording fMRI.
Experimental Paradigm and Imaging Acquisition
The experiment was performed on 2 different days, with the second experiment performed 7 days after the first. In the first experiment, the 13 subjects were randomly separated into 2 groups, one assigned to the examination that stimulated C nociceptors, the other assigned to the examination that stimulated Aδ nociceptors. During the second experiment, these groups were switched. The event-related (single-event) design was used in this study. During the fMRI scans, the laser for either Aδ or C stimulation was applied to the right hand of subjects. The interstimulus interval between adjacent stimuli was either 14, 16, or 18 s, and these intervals were controlled with stimulus presentation software (Presentation 0.50, Neurobehavioral Systems, Albany, California). The fMRI scans were acquired using blood oxygenation level–dependent contrast T2*–weighted gradient echo. A total of 248 fMRI scans per session were acquired using echo-planar imaging sequences (time of repetition [TR], 2 s; echo time [TE], 30ms; flip angle [FA] 75; field of view [FOV] 192 mm; in-plane resolution, 3.0 × 3.0 mm; 32 slices of 3-mm thickness covering the whole cerebrum) on a 3.0-T magnetic resonance scanner with a standard head coil (Allegra; Siemens, Erlangen, Germany). The interleaved (first slice = bottom) scanning sequence was used. The images were oriented slightly tilted towards the AC-PC line and aligned so that the sample included whole brain. A high-resolutional T1-weighted anatomical brain image of each subject was obtained using an magnetization-prepared rapid gradient-echo sequence (Mugler and Brookeman 1990) with the following parameters: TR = 2500 ms, TE = 4.38 ms, FA = 8°, FOV = 230 × 230 mm2, resolution = 0.9 × 0.9 mm2.
Image Processing and Statistical Analysis
Imaging processing and statistical analyses were performed using statistical parametric mapping (SPM99; Wellcome Department of Cognitive Neurology, London, UK) (Friston and others 1995; Worsley and Friston 1995) implemented in Matlab (Mathworks, Sherborn, Massachusetts). The first 8 volumes of each fMRI session were discarded because of unsteady magnetization and the remaining 240 volumes per session (480 volumes per subject) were used for analysis. We initially corrected the differences in slice timing within each volume. To remove the motion artifacts, all volumes were then realigned to the first functional image of each session (Friston and others 1994). After being coregistered with a T1-weighted structural volume, they were normalized in the functional scans to the standard stereotaxic space (Montreal Neurological Institute [MNI] template). Then, the images were spatially smoothed using an isotropic Gaussian kernel with a full-width half maximum of 8 mm. Because the event-related (single-event) design was used in this study, specific effects for Aδ- or C-related sensations were estimated for each subject using a general linear model with a regressor waveform assuming the hemodynamic response (HDR) function beginning at the onset of each laser stimulus. To make statistic inferences at the population level, individual data were then summarized and incorporated into a random-effect model. The threshold was set at P < 0.001, uncorrected for multiple comparisons (Friston and others 1998).
Results
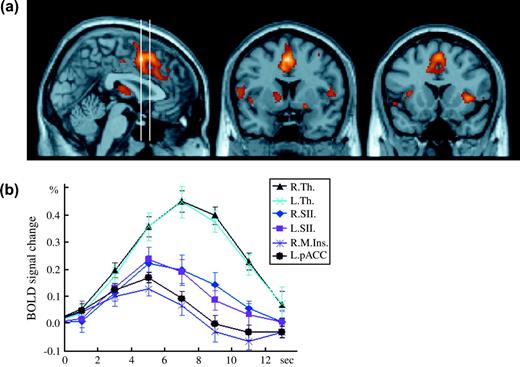
Following the stimulation of C nociceptors, the bilateral thalamus, bilateral SII, bilateral middle/anterior insular cortex, bilateral posterior portion of the anterior cingulate cortex (pACC), dorsal parts of the anterior portion of the ACC (aACC), and pre-supplementary motor area (pre-SMA) were significantly activated (Fig. 1a). The HDRs in the bilateral thalamus, bilateral SII, right (ipsilateral) middle insula, and left pACC peaking at 5 or 7 s following stimulation are shown in Figure 1b.
The brain-activated regions and HDRs following C nociceptor stimulation. (a) 1 sagittal (x = 2, left panel) and 2 coronal (y = 6 and 16 for the middle and right panels, respectively) images showing the significant activation to C nociceptor stimulation. Two vertical bars in the left panel indicate the sagittal positions of the 2 coronal planes. (b) Time course of HDRs in the activated regions was illustrated. R. = right (ipsilateral to the stimulation), L. = left (contralateral to the stimulation), M. = middle part, Th. = thalamus, SII = secondary somatosensory cortex, Ins. = insula, pACC = posterior portion of the anterior cingulate cortex. Error bars indicate standard deviation.
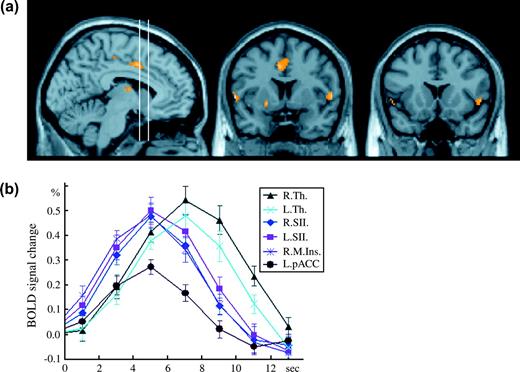
Following Aδ nociceptor stimulation, the bilateral thalamus, bilateral SII, right (ipsilateral) middle insula, and bilateral pACC were significantly activated (Fig. 2a). The HDRs in the bilateral thalamus, bilateral SII, right middle insula, and left pACC peaking at 5 or 7 s following stimulation are shown in Figure 2b. Overall, the time course of HDRs to the activation of C nociceptors was similar with the time resolution of the present fMRI method. The peak of HDRs in these activated regions showed significant differences between Aδ and C nociceptor stimulation. Activity was significantly stronger following the stimulation of Aδ nociceptors than C nociceptors in the right SII (P < 0.0001), left SII (P < 0.05), right insular (P < 0.01), and left pACC (P < 0.01) (paired t-test). In contrast, there were no significant differences in the bilateral thalamus (P = 0.40 for right thalamus and P = 0.52 for left thalamus) (paired t-test).
The brain regions activated and HDRs following Aδ nociceptor stimulation. (a) 1 sagittal (x = −6, left panel) and 2 coronal (y = 6 and 16 for the middle and right panels, respectively) images showing the significant activation to Aδ nociceptor stimulation. Two vertical bars in the left panel indicate the sagittal positions of the 2 coronal planes. To make a comparison with Figure 1 easier, the positions of the 2 coronal planes were set identical to those in the previous figure. (b) Time course of HDRs in the activated regions was illustrated. R. = right (ipsilateral to the stimulation), L. = left (contralateral to the stimulation), Th. = thalamus, SII = secondary somatosensory cortex, M. Ins. = middle insula, pACC = posterior portion of the anterior cingulate cortex. Error bars indicate standard deviation.
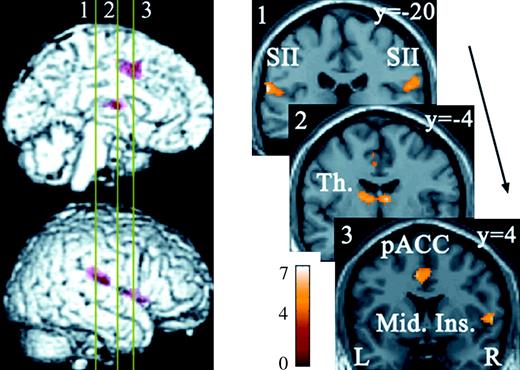
To identify the activity common to and differing between C and Aδ nociceptor stimulation, we used a conjunction analysis in the SPM analysis (Price and Friston 1997; see also Friston and others [2005] and Nichols and others [2005] for the recent discussion on conjunction analysis). The bilateral SII, bilateral thalamus, right (ipsilateral) middle insula, and bilateral Brodmann's area (BA) 24/32 with the majority of activity occurring in the pACC were activated by both C and Aδ nociceptor stimulation (Table 1 and Fig. 3). We then made a direct comparison between C and Aδ nociceptor stimulation. The activation of the right (ipsilateral) BA32/8/6 including dorsal parts of the aACC and pre-SMA and the bilateral anterior insula was significantly greater following C nociceptor stimulation than Aδ nociceptor stimulation (P < 0.001) (Table 2 and Fig. 4). By contrast, there were no regions where activity was significantly stronger following the stimulation of Aδ nociceptors than C nociceptors. The activated regions in ACC and pre-SMA are shown in Figure 5. We used the nomenclature based on Devinsky and others (1995) and Kwan and others (2000) to classify the subregions in the ACC, anterior/posterior and dorsal/ventral portion (Buchel and others 2002).
Brain regions commonly activated by C and Aδ nociceptor stimulation. Numbered bars in the left panel indicate locations of coronal slices in the right panel. Activated regions overlaid on an anatomically normalized MRI (MNI template) with their corresponding y coordinates (right side). SII = secondary somatosensory cortex, Th. = thalamus, pACC = posterior portion of the anterior cingulate cortex, Mid. Ins. = middle insula. MNI coordinates in Table 1.
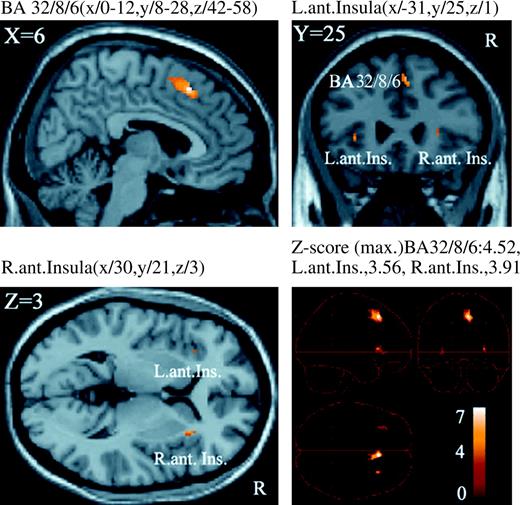
Brain regions differentially activated by C nociceptor stimulation. The activity in these areas was significantly stronger following the stimulation of C nociceptors than Aδ nociceptors (P < 0.001, uncorrected) and overlaid on an anatomically normalized MRI (MNI template). BA = Brodmann's area, Ant. Ins. = anterior insula, L. = left, R. = right. MNI coordinates in Table 2.
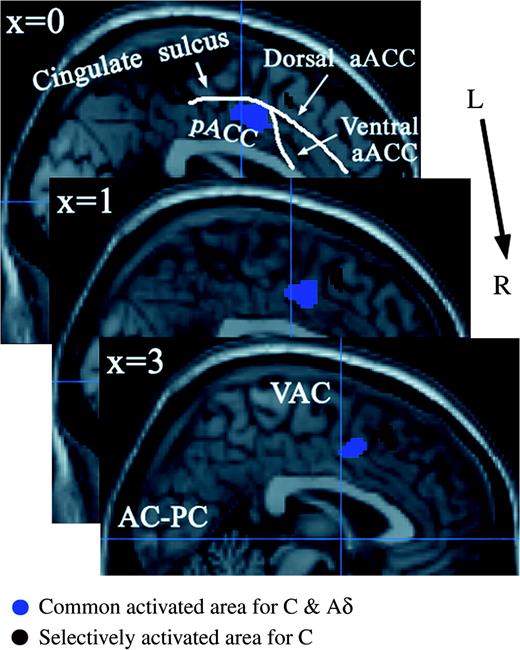
Activations in the ACC and pre-SMA overlaid on an anatomically normalized MRI (MNI template). These are shown from left (top part of the image) to right (bottom part of the image) with their corresponding MNI template x coordinates. The blue vertical line indicates the line through the anterior commissure (VAC). aACC = anterior portion of the anterior cingulate cortex, pACC = posterior portion of the anterior cingulate cortex.
Coordinates (MNI) of regions activated by both C and Aδ nociceptor stimulation
| Brain region (side) | x | y | z | Z-score |
|---|---|---|---|---|
| Thalamus | ||||
| Ipsilateral | 8 | −6 | 12 | 4.14 |
| Contralateral | −12 | −4 | 14 | 4.02 |
| SII | ||||
| Ipsilateral | 62 | −20 | 18 | 4.15 |
| Contralateral | −64 | −26 | 18 | 4.42 |
| Right middle insula | ||||
| Ipsilateral | 58 | 4 | 4 | 4.12 |
| BA24/32 (pACC) | ||||
| Contralateral | −6 | 4 | 42 | 4.02 |
| Ipsilateral | 2 | 10 | 48 | 3.73 |
Coordinates (MNI) of specifically activated regions for C nociceptor stimulation
| Brain region (side) | x | y | z | Z-score |
|---|---|---|---|---|
| BA32/8/6 | ||||
| Midline, Ipsilateral | 6 | 22 | 50 | 4.52 |
| Anterior insula | ||||
| Ipsilateral | 30 | 21 | 3 | 3.91 |
| Contralateral | −31 | 25 | 1 | 3.56 |
| Brain region (side) | x | y | z | Z-score |
|---|---|---|---|---|
| BA32/8/6 | ||||
| Midline, Ipsilateral | 6 | 22 | 50 | 4.52 |
| Anterior insula | ||||
| Ipsilateral | 30 | 21 | 3 | 3.91 |
| Contralateral | −31 | 25 | 1 | 3.56 |
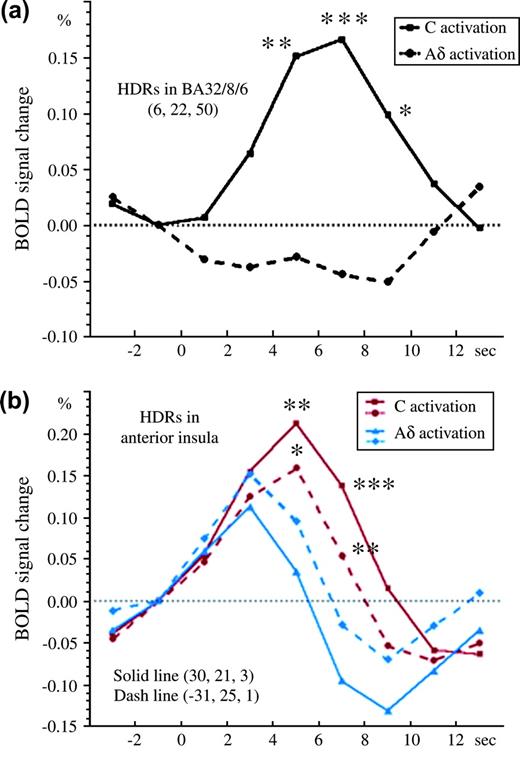
The time course of HDRs in the 2 regions where C nociceptors were activated more than Aδ nociceptors, the right (ipsilateral) BA32/8/6 and bilateral anterior insula, is shown in Figure 6. There were differences following Aδ nociceptor stimulation between these 2 regions. Activated Aδ nociceptors in BA32/8/6 were almost absent, indicating that this region was selectively activated following C nociceptor stimulation and is probably related to second pain. The activity was significantly stronger following the stimulation of C nociceptors than Aδ nociceptors in the time period, 5–9 s, poststimulation (P < 0.05) (Fig. 6a). However, the bilateral anterior insula was also activated by Aδ nociceptor stimulation, though to a significantly lesser degree than following C nociceptor stimulation. The HDR peaked at 3 s following Aδ nociceptor stimulation, gradually decreased afterward, and then returned to the baseline level at 6 s. By contrast, HDR peaked at 7 s following C nociceptor stimulation, and a significant difference was found between the 2 stimulus conditions at 5 and 7 s poststimulation (P < 0.05) (Fig. 6b). Therefore, this region is considered to be important for both C and Aδ nociceptor stimulation but is more specifically activated by C nociceptor stimulation, probably related to second pain.
Time course of the HDRs in the BA32/8/6 and bilateral anterior insula following stimulation of C and Aδ nociceptors. (a) In the right (ipsilateral) BA32/8/6, the HDR following Aδ nociceptor stimulation was almost below the baseline, whereas that following C nociceptor stimulation was very large. The difference between them, 5–9 s, after stimulation was significant. (b) In the bilateral anterior insula cortex (solid/dashed line = right/left anterior insula), the HDR following Aδ nociceptor stimulation peaked at 3 s, rapidly decreased thereafter, and had returned to the baseline level at 6 s. By contrast, the HDR following C nociceptor stimulation was large for a long period, peaking at 5 s, and the difference between 5 and 7 s after stimulation was significant (the paired t-test was calculated from red solid to blue solid lines and red dashed to blue dashed lines) (*P < 0.05, **P < 0.01, ***P < 0.001).
Discussion
In the present fMRI study, we found that the activity in the right (ipsilateral) BA32/8/6, including the dorsal parts of the aACC and pre-SMA, and the bilateral anterior insula was significantly stronger following the stimulation of C nociceptors than Aδ nociceptors, though several regions were activated by both stimuli.
This is the first neuroimaging study to use the phasic stimulation of C nociceptors. As a method for the tonic stimulation of C nociceptors, the injection of capsaicin is commonly used, and a few studies using PET (Andersson and others 1997; Iadarola and others 1998; May and others 1998) and fMRI (Baron and others 1999) reported that the thalamus, striatum, SI, SII, insula cortex, cingulate cortex, prefrontal cortex, and SMA were activated in normal healthy subjects. Activity in the insular cortex was also identified by fMRI following touch stimulation of C fiber tactile afferents in a unique patient lacking large myelinated afferents (Olausson and others 2002). In the present study, the bilateral thalamus, bilateral SII, bilateral middle/anterior insula, bilateral ACC, and pre-SMA were activated, consistent with previous studies using capsaicin-induced pain. By contrast, no activation of the SI or prefrontal cortex was found. Because capsaicin-induced pain is a tonic pain reflecting a mixture of bottom–up and top–down processes and complex pain-coping strategies, the difference in regions activated obtained with the capsaicin injection and our method was probably caused by the difference in the method of stimulation used. However, the finding that the activity in the right (ipsilateral) BA32/8/6, including the dorsal parts of the aACC and pre-SMA, and the bilateral anterior insula, particularly the former, was significantly stronger following stimulation of C nociceptors than Aδ nociceptors was novel.
Following the stimulation of Aδ nociceptors in the present study, the bilateral thalamus, bilateral SII, right (ipsilateral) middle insula, and pACC were activated, consistent with recent neuroimaging studies using PET and fMRI following stimulation with CO2 or a Tm:YAG laser. However, a German group (Bingel and others 2002; Bornhovd and others 2002; Buchel and others 2002; Bingel, Glascher, and others 2004; Bingel, Lorenz, and others 2004) reported that many regions involving the SI, hippocampus, amygdala, prefrontal cortex, SMA, motor cortex, putamen, red nucleus, brainstem, and cerebellum were also activated in addition to the regions identified in the present study. We consider the difference between their findings and ours to be mainly due to the method of analysis because the German group used a fix-effect model whereas we used a random-effect model during the group analysis with uncorrected values and set the threshold at P < 0.001. In any case, the areas important for pain perception may be those where both groups identified activity.
We found activity in the pACC following the stimulation of both Aδ and C nociceptors and in the dorsal part of the aACC following the stimulation of only C nociceptors. Hutchison and others (1999) detected activity in the pACC following painful thermal stimulation using single-neuron recordings in conscious subjects. Buchel and others (2002) demonstrated that the pACC is associated with pain intensity, and dorsal parts of the aACC are associated with cognitive processing like attention and working memory and stimulus awareness related to pain. In addition, the dorsal ACC also plays important roles in cognition, motor control, and emotional processing (Bush and others 2002). Therefore, our findings indicate that the activation of the dorsal parts of the aACC through the stimulation of C nociceptors, probably related to second pain, is closely related to the cognitive aspect of pain as compared with the stimulation of the Aδ nociceptors (first pain). Recently, Bush and others (2000) and Vogt and others (2003) reviewed anatomical and physiological findings of cingulate cortex. Bush and others (2000) separated ACC into 2 parts by their roles; the more anterior part plays a main role for emotional tasks and the posterior part does so for tasks. The activated region found in the present study was consistent with the emotional region reported by them; Vogt and others (2003) also separated the cingulate cortex into 3 parts: noxious thermal region, emotional region, and nonemotional region, and the activated region found in the present study was consistent with the noxious region and emotional region reported by them, mainly the former.
Activation in the SMA has been reported following various noxious stimulations such as heat (Coghill and others 1994; Kwan and others 2000), cooling (Kwan and others 2000), CO2 laser (Svensson and others 1997), ethanol injection (Hsieh and others 1996), and thermal grill (Craig and others 1996). Kwan and others (2000) reported fMRI study of the activation of the ACC and surrounding medial wall using innocuous and noxious thermal-related stimuli and motor-related stimuli and noxious stimuli activated mainly aACC, pACC, and SMA proper and modestly pre-SMA too. Picard and Strick (2001) reviewed imaging studies of the premotor cortex and concluded that it might be more appropriate to consider the pre-SMA as a functional component of the prefrontal cortex rather than as a premotor area. Because the dorsal parts of the aACC is also considered as a cognitive region (Bush and others 2002), it seems appropriate that both pre-SMA and caudal division of ACC play a main role for cognitive function for second pain perception.
Studies of lesions in animals and humans, functional imaging related to attention and emotion, and opioid-binding experiments have shown that the anterior insula is coactivated with the ACC to reflect active modulation by the affective agent of pain perception (Peyron and others 2000; Schnizler and Ploner 2000; Craig 2002). Our finding that the activity in the bilateral anterior insular cortex was significantly stronger following the stimulation of C nociceptors than Aδ nociceptors, which is probably related to second pain, reflects greater attention and behavioral motivation as compared with first pain (Aδ nociceptor stimulation).
It is obvious that first pain and second pain are experienced differently probably because of several anatomical and physiological differences. In the dorsal horn of the spinal cord, lamina II is the input nucleus for C nociceptors and laminae I and V are major output nuclei for Aδ nociceptors (Willis 1985). Since Melzack and Casey (1968) divided the nociceptive system into lateral (sensory-discriminative aspects of pain) and medial (affective-motivational aspects of pain) systems, the supraspinal parts of the nociceptive system have been investigated by a large number of functional imaging studies (see review by Treede and others 1999). However, the difference of activated brain regions between Aδ and C nociceptor stimulation remained to be investigated. We found that the activity in the bilateral insula and dorsal parts of the ACC and pre-SMA was significantly greater following stimulation of C nociceptors than Aδ nociceptors in this study. These findings may indicate that the C nociceptors play a more important role in the medial system, whereas the Aδ nociceptors play a more important role in the lateral system, the sensory–discriminative aspects of pain.
In conclusion, our findings seem to suggest that the differences in brain activity between first and second pain perception probably reflect distinct biological functions of the 2 sensations as found in this study. It is considered that first pain aims at achieving relative safety from the source of injury, whereas second pain, with its strong affective component, attracts longer lasting attention and initiates behavioral responses to limit further injury and optimize recovery (Wall 1979). Therefore, dorsal parts of the aACC, pre-SMA, and anterior insular cortex should play some role in the perception of second pain.
Funding to pay the Open Access publication charges for this article was provided by the Ministry of Education, Culture, Sports, Science and Technology, Japan, and by the Japanese Science and Technology Agency.
This study was supported by Japan Space Forum, and Grant-in-Aid for Scientific Research on Priority Areas—Higher-Order Brain Functions—from The Ministry of Education, Culture, Sports, Science and Technology, Japan.
References
Andersson JL, Lilja A, Hartvig P, Langstrom B, Gordh T, Handwerker H, Torebjork E.
Baron R, Baron Y, Disbrow E, Roberts TP.
Bingel U, Glascher J, Weiller C, Buchel C.
Bingel U, Lorenz J, Glauche V, Knab R, Glascher J, Weiller C, Buchel C.
Bingel U, Quante M, Knab R, Bromm B, Weiller C, Buchel C.
Bornhovd K, Quante M, Glauche V, Bromm B, Weiller C, Buchel C.
Bragard D, Chen CAN, Plaghki L.
Bromm B, Treede RD.
Buchel C, Bornhovd K, Quante M, Glauche V, Bromm B, Weiller C.
Bush G, Luu P, Posner MI.
Bush G, Vogt BA, Holmes J, Dale AM, Greve D, Jenike MA, Rosen BR.
Coghill RC, Talbot JD, Evans AC, Meyer E, Gjedde A, Bushnell MC, Duncan GH.
Craig AD.
Craig AD, Reiman EM, Evans A, Bushnell MC.
Devinsky O, Morrell MJ, Vogt BA.
Friston KJ, Fletcher P, Josephs O, Holmes A, Rugg MD, Turner R.
Friston KJ, Holmes AP, Poline JB, Grasby PJ, Williams SC, Frackowiak RS, Turner R.
Friston KJ, Holmes AP, Worsley KJ, Poline JP, Frith, CD, Frackowiak RSJ.
Holzer P.
Hsieh J-C, Ståhle-Bäckdahl M, Hägermark O, Stone-Elander S, Rosenquist G, Ingvar M.
Hutchison WD, Davis KD, Lozano AM, Tasker RR, Dostrovsky JO.
Iadarola MJ, Berman KF, Zeffiro TA, Byas-Smith MG, Gracely RH, Max MB, Bennett GJ.
Kakigi R, Tran TD, Qiu Y, Wang X, Nguyen TB, Inui K, Watanabe S, Hoshiyama M.
Kwan CL, Crawley AP, Mikulis DJ, Davis KD.
Mauguiere F, Frot M, Peyron R, Garcia-Larrea L, Laurent B, Michel D.
May A, Kaube H, Buchel C, Eichten C, Rijntjes M, Juptner M, Weiller C, Diener HC.
Melzack R, Casey KL.
Mendell LM, Wall PD.
Mugler JP, Brookeman JR.
Nichols T, Brett M, Andersson J, Wager T, Poline JB.
Ochoa J, Torebjork E.
Olausson H, Lamarre Y, Backlund H, Morin C, Wallin BG, Starck G, Ekholm S, Strigo I, Worsley K, Vallbo AB, Bushnell MC.
Opsommer E, Masquelier E, Plaghki L.
Peyron R, Laurent B, Garcia-Larrea L.
Plaghki L, Mouraux A.
Ploner M, Gross J, Timmermann L, Schnitzler A.
Price CJ, Friston KJ.
Price DD, Hu JW, Dubner R, Gracely RH.
Qiu Y, Fu Q, Wang X, Tran TD, Inui K, Iwase S, Kakigi R.
Qiu Y, Inui K, Wang X, Nguyen BT, Tran TD, Kakigi R.
Qiu Y, Inui K, Wang X, Tran TD, Kakigi R.
Qiu Y, Inui K, Wang X, Tran TD, Kakigi R.
Sawamoto N, Honda M, Okada T, Hanakawa T, Kanda M, Fukuyama H, Konishi J, Shibasaki H.
Schmidt RF, Schaible HG, Messlinger K, Heppelmann B, Hanesch U, Pawlak M.
Schnitzler A, Ploner M.
Svensson P, Minoshima S, Beydoun A, Morrow TJ, Casey KL.
Szallasi A.
Tran TD, Inui K, Hoshiyama M, Lam K, Kakigi R.
Tran TD, Inui K, Hoshiyama M, Lam K, Qiu Y, Kakigi R.
Tran TD, Lam K, Hoshiyama M, Kakigi R.
Treede RD, Kenshalo DR, Gracely RH, Jones AK.
Treede RD, Meyer RA, Lesser RP.
Vogt BA, Berger GR, Derbyshire SWG.
Author notes
1Department of Integrative Physiology and 2Division of Cerebral Integration, National Institute for Physiological Sciences, Myodaiji, Okazaki 444-8585, Japan, 3Department of Physiological Sciences, School of Life Sciences, The Graduate University for Advanced Studies, Hayama, Kanagawa 240-0193, Japan and 4SORST and 5RISTEX, Japan Science and Technology Corp Agency (JST), Kawaguchi 332-0012, Japan