


Abstract
We investigated the prevalence and specificity of category-selective regions in human visual cortex. In the broadest survey to date of category selectivity in visual cortex, 12 participants were scanned with functional magnetic resonance imaging while viewing scenes and 19 different object categories in a blocked-design experiment. As expected, we found selectivity for faces in the fusiform face area (FFA), for scenes in the parahippocampal place area (PPA), and for bodies in the extrastriate body area (EBA). In addition, we describe 3 main new findings. First, evidence for the selectivity of the FFA, PPA, and EBA was strengthened by the finding that each area responded significantly more strongly to its preferred category than to the next most effective of the remaining 19 stimulus categories tested. Second, a region in the middle temporal gyrus that has been reported to respond significantly more strongly to tools than to animals did not respond significantly more strongly to tools than to other nontool categories (such as fruits and vegetables), casting doubt on the characterization of this region as tool selective. Finally, we did not find any new regions in the occipitotemporal pathway that were strongly selective for other categories. Taken together, these results demonstrate both the strong selectivity of a small number of regions and the scarcity of such regions in visual cortex.
Introduction
Investigations of the primate brain have revealed a patchwork of distinct visual areas (Van Essen and others 1992; Tootell and others 2003), with multiple retinotopic representations in the occipital lobe, and visual areas that respond to increasingly complex visual features in more anterior regions along the ventral occipitotemporal surface. To what extent are the representations in these anterior regions organized along category-specific boundaries? In the present study, we used functional magnetic resonance imaging (fMRI) to test whether the cortical structures responsible for human visual recognition contain category-specific regions, each specialized for the perceptual analysis of a distinct class of stimuli. This question is part of a broader debate on the degree to which the functional architecture of the mind and brain is “domain specific” (e.g., Pinker 1997; Fodor 2000).
Key evidence bearing on the domain specificity of visual recognition has come from patients with focal brain damage. Prosopagnosic patients, for example, are severely impaired at recognizing faces but largely normal in most other visual abilities (Farah 2004). The opposite pattern, of preserved face recognition with impaired object recognition, has also been demonstrated (Moscovitch and others 1997). This double dissociation is evidence that different mechanisms are involved in the recognition of faces and other classes of objects (Kanwisher 2000; but see Gauthier and others 1999). Numerous other selective deficits have also been reported, including deficits for living versus nonliving objects (Warrington and Shallice 1984) as well as more specific impairments for categories such as fruits and vegetables (Hart and others 1985) or musical instruments (e.g., Dixon and others 2000). However, on the whole, these deficits seem better described as semantic or lexical rather than purely visual in nature, suggesting that they reflect the organization of semantic knowledge rather than visual object representations per se (for review, see Farah 2004). Further, because lesions are unlikely to accidentally follow the borders of functionally distinct cortical areas, pure cases of category-specific perceptual deficits will be rare even if the normal brain contains numerous highly specialized domain-specific “modules”.
Functional neuroimaging techniques can avoid some of the ambiguities of patient studies by measuring the degree to which specific regions in the healthy brain are selectively activated by particular object categories. Neuroimaging studies in humans have identified several focal regions in extrastriate cortex that are selectively responsive to specific high-level categories. In particular, fMRI has revealed regions that respond selectively to faces (occipital face area [OFA] and fusiform face area [FFA]; Puce and others 1996; Kanwisher and others 1997), bodies (extrastriate body area [EBA]; Downing and others 2001), and scenes (parahippocampal place area [PPA]; Aguirre and others 1998; Epstein and Kanwisher 1998). Each of these regions is anatomically consistent within (Peelen and Downing 2005a) and across (Hasson and others 2004) subjects, and each is relatively spatially circumscribed (Spiridon and others 2005). Furthermore, several reports have shown an increased response to handheld tools, relative to animals, in the middle temporal gyrus (MTG) (middle temporal gyrus tool area or [MTG-TA]; Chao, Haxby, and Martin 1999; Beauchamp and others 2003).
Here we scanned subjects with fMRI while they viewed images from 20 different stimulus categories, in order to address 3 questions. First, to what extent are the previously described category-specific regions genuinely selective for stimuli from a single category? Second, to what extent does activity in these regions differ for different nonpreferred categories? Finally, do similarly selective regions exist in the occipitotemporal pathway for other categories?
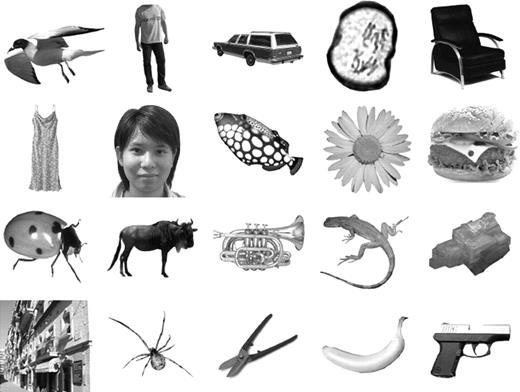
To answer these questions, we measured the brain activity elicited when participants view faces, scenes, human bodies, tools, and 16 other object categories (Fig. 1; see also Supplementary Fig. 1). The stimulus categories were selected on several grounds. Some were included because they have been used in previous fMRI and event-related potential (ERP) (e.g., Allison and others 1999) experiments that investigated category selectivity (bodies, faces, scenes, tools, mammals, chairs [Ishai and others 1999], cars, birds [Gauthier and others 2000]). Others were selected on the basis of neuropsychological impairments that are apparently selective for specific categories such as musical instruments (Dixon and others 2000) and fruits and vegetables (Caramazza and Mahon 2003). Still other categories were included to provide a broad range of stimuli on both sides of the “animate/inanimate” distinction (e.g., birds, reptiles, fish, insects, spiders; musical instruments, rocks, weapons, prepared foods, clothes). Finally, several categories (chairs, cars, tools, clothes, prepared foods, fruits, and vegetables) were included because their high familiarity in daily life enables us to test whether frequent experience with a particular category can lead to focal cortical selectivity for that category.
One example stimulus from each of the 20 categories tested. From top to bottom and left to right, these were birds, bodies, cars, cells, chairs, clothes, faces, fish, flowers, foods, insects, mammals, instruments, reptiles, rocks, scenes, spiders, tools, vegetables and fruits, and weapons. The stimuli used in the experiments were in full color. See Supplementary Figure 1 for further examples of the stimuli.
Testing a wide variety of stimulus conditions is important for 2 reasons. First, arguments for the selectivity of a cortical region increase in strength with the number of stimulus categories that have been tested (Földiák and others 2004). Demonstrating that a cortical region responds more strongly to 1 category than to 2 others is much less compelling evidence for selectivity than finding that a cortical region responds more strongly to 1 category than to each of the 19 other categories. Second, measuring the response of each voxel in the occipitotemporal pathway to each of the 20 stimulus categories provides a unique opportunity to discover new category-selective cortical regions.
We report several key analyses, all of which were focused on occipitotemporal cortex. First, we performed individual-subject region of interest (ROI) analyses to identify the FFA, PPA, EBA, and MTG-TA. Characterizing the profile of response to nonpreferred categories in each of these regions allowed us to address the first 2 goals of this study: 1) to what extent are these ROIs genuinely selective for their preferred category? and 2) does the activity in these ROIs vary among nonpreferred categories? Second, to search for new category-selective regions, we performed whole-brain group-average analyses comparing the response elicited by each individual category with the average of the remaining 19 categories. Finally, we performed an analysis comparing the response to the superordinate sets of animate versus inanimate classes.
Materials and Methods
Subjects
Twelve healthy adult volunteers were recruited from the University of Wales, Bangor community. Participants satisfied all requirements in volunteer screening and gave informed consent approved by the School of Psychology at the University of Wales, Bangor, and the North West Wales Health Trust. Participation was compensated at £20 per session.
Materials
Twenty stimulus categories were tested: human faces, human bodies (without heads), outdoor scenes, handheld tools, mammals, fish, fruits and vegetables, reptiles, spiders, rocks and crystals, musical instruments, cars, insects, microbes, birds, weapons, flowers, prepared foods, clothes, and chairs (see Fig. 1 and Supplementary Fig. 1 for examples). Forty full-color 400 × 400–pixel exemplars of each category were tested. For 8 subjects, the exemplars for each category were divided into 2 sets of 20 each, so that in half of the scans, 1 set was used, and the other set was used in the other half of the scans. For the remaining 4 subjects, the stimuli for each block of each condition were sampled without replacement from the full set of 40 images. Stimulus presentation was controlled from a Macintosh iBook laptop running the Psychophysics Toolbox package (Brainard 1997) in Matlab (Mathworks, Natick, MA, USA).
We did not attempt to control these stimuli on low-level features such as contrast and complexity. Our goal was to screen for potential highly selective candidate regions, which, if found, would require further investigation.
Design
Participants passively viewed images from all 20 categories in a single scanning session. The categories were divided into 3 sets. Set 1 included faces, human bodies without heads, scenes, and tools. Set 2 tested images of mammals, fish, fruits and vegetables, reptiles, spiders, rocks and crystals, musical instruments, and cars. Set 3 tested insects, microbes, birds, weapons, flowers, prepared food, clothes, and chairs.
Each set was tested four times in a session for a total of 12 functional scans. (4 participants completed only 7–10 scans due to fatigue or technical difficulties, but all participants completed at least 2 scans for each of the 3 sets). Scans from the 3 sets were interleaved to reduce between-scan adaptation to stimuli. There were twenty-one 15-s blocks per scan. Blocks 1, 6, 11, 16, and 21 were a fixation-only baseline condition. Each of the remaining blocks comprised presentation of 20 exemplars from a single category. Block order was counterbalanced as in previous studies (Downing and others 2001). Within a block, each stimulus was presented for 300 ms, with an inter-stimulus interval (ISI) of 450 ms, during which a central fixation point appeared on the screen. All stimuli were presented on a white background on a screen positioned near the subjects' feet. Images were viewed through an angled mirror attached to the head coil.
Data Acquisition
A 1.5-T Philips magnetic resonance imaging (MRI) scanner with a standard birdcage head coil was used. For functional imaging, a single-shot echo-planar imaging (EPI) sequence was used (T2*-weighted, gradient echo sequence, repetition time (TR) = 3000, echo time (TE) = 50 ms, flip angle = 90°). The scanned area included 30 axial slices, either 4- or 5-mm thick, with no gap, at 64 × 64–voxel in-plane resolution, which covered the whole cerebral cortex and most of the cerebellum.
Data Preprocessing
Preprocessing and statistical analysis of MRI data were performed using BrainVoyager 4.9 (Brain Innovation, Maastricht, The Netherlands). Three dummy volumes were acquired before each scan in order to reduce possible effects of T1 saturation. For the same reason, the first 2 volumes of each scan were not included in the analyses. Functional data were motion corrected, low-frequency drifts were removed with a temporal high-pass filter (0.006 Hz), and spatial smoothing was applied with a 6-mm full width at half maximum filter. Functional data were manually coregistered with three-dimensional (3D) anatomical T1 scans (1 × 1 × 1.3–mm resolution). The 3D anatomical scans were transformed into Talairach space (Talairach and Tournoux 1988), and the parameters for this transformation were subsequently applied to the coregistered functional data.
Data Analysis
The data were analyzed both within individual subjects and in aligned group analyses, which are described in turn.
Individual-Subject Analyses
The data were submitted to a general linear model, with 1 predictor (convolved with a standard model of the hemodynamic response function) for each category. Regressors were also included to account for differences in global signal across scans. Parameter estimates were determined for the regressors for each category in each voxel. These parameter estimates, which characterize the extent to which a region was activated by a given category, were used as the basis for the further analyses described subsequently.
We attempted to define the OFA, FFA, PPA, EBA, and MTG-TA in each participant individually. Each preferred category (faces, scenes, bodies, or tools, respectively) was contrasted against the average of all 19 remaining categories. We used a split-half analysis so that all the data contributed to the analysis, but the data used to define and test ROIs were independent. For each participant, the data from Set 1 were divided into halves, with runs from 1 counterbalancing order comprising the first half and runs from the other counterbalancing order comprising the second half. One half was used to define the ROI, and the other half of the data was used to provide an unbiased estimate of the response of the ROI to all 20 categories. Likewise, the second half of Set 1 was used to define ROIs, and the remaining data were used to provide activation measures. The data from each analysis of one half of the data were averaged within subjects before being submitted to the overall analysis of variance (ANOVA). Where a robust ROI could not be identified with both halves of the data, the results from the ROI defined by one half were analyzed.
For each ROI in each subject, the most significantly activated voxel was identified within a restricted part of cortex based on previously reported anatomical locations and mean Talairach coordinates (e.g., Kanwisher and others 1997; Chao, Haxby, and Martin 1999; Epstein and others 1999; Peelen and Downing 2005a)—FFA: 40, −55, −10; left PPA: −28, −39, −6; right PPA: 20, −39, −5; EBA: 46, −70, −1; MTG-TA: −47, −55, 3. ROIs were defined as the set of contiguous voxels that were significantly activated (P < 0.05 uncorrected) within 9 mm in the anterior/posterior, superior/inferior, and medial/lateral direction of this peak voxel. This procedure was adopted for 3 reasons: 1) to ensure that regions were defined objectively, 2) to ensure that they were segregated from nearby selective activations (such as the OFA, which borders the FFA), and 3) to roughly equate the number of voxels included across different ROIs. Note also that the relatively lenient statistical criterion for including voxels in the ROI results in a relatively conservative estimate of the selectivity of an ROI. For each ROI in each subject, the magnitude of the response to all conditions was quantified, averaging across the voxels in that ROI.
Group Analyses
In addition to the analyses of individual subject data, group analyses were conducted. Our general strategy was to adopt relatively liberal statistical criteria in order to maximize sensitivity to any selective regions should they exist (i.e., to minimize Type II errors). Thus, any apparently selective region identified from these analyses would require further confirmation with stricter criteria and more directed hypothesis testing, as in our previous examinations of selective regions (e.g., Epstein and Kanwisher 1998; Tong and others 2000; Downing and others 2001).
Whole-brain contrasts were performed with a random effects group-average model and tested at an uncorrected threshold of P < 0.001 (exceptions are noted in Supplementary Table 1). Regions that survived a whole-brain Bonferroni-corrected threshold of P < 0.05 are also indicated. ROIs from the group-average analyses were defined as contiguous sets of significantly activated voxels. To maximize sensitivity to possible category-selective regions, the full data set was used to identify and characterize the response properties of clusters in the group-average analysis. As a result, the selectivity of these clusters may be overestimated.
Results
Faces, Scenes, Bodies, and Tools
The right FFA was defined in 11/12 individual participants. The right OFA was identified robustly in only 7/12 participants (and in both halves of the data in only 4/12) and was therefore not analyzed further due to lack of statistical power. The PPA was defined bilaterally in 12/12, the left and right EBA were defined in 12/12 participants each, and the left MTG-TA was defined in 12/12. The average spatial coordinates of the peaks of these regions (in Talairach space) corresponded well with the previously identified locations of these regions: right FFA [37, −46, −16], left PPA [−22, −47, −4], right PPA [23, −45, −5], left EBA [−45, −69, 4], right EBA [45, −67, 5], left MTG-TA [−50, −57, −1]. The pattern of responses in these regions to all 20 categories, averaged across individually defined ROIs, is given in Figures 2–7. Note that these response magnitudes are calculated from data that are independent of those used to functionally define each region and therefore provide an unbiased estimate of the magnitude of each region's response to each of the 20 stimulus categories.
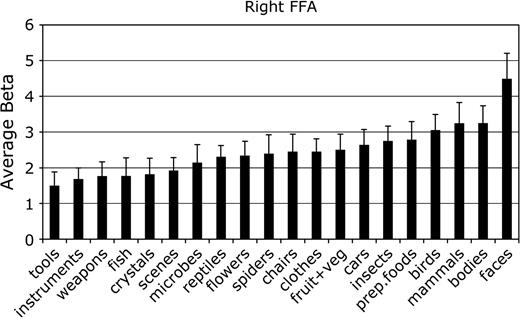
Mean parameter estimate of the response to each category in the FFA. Each ROI was identified individually in each subject. The data sets used to define the ROIs were independent from those used to produce the values in this figure and in Figures 3–7. Error bars reflect the standard error of the mean.
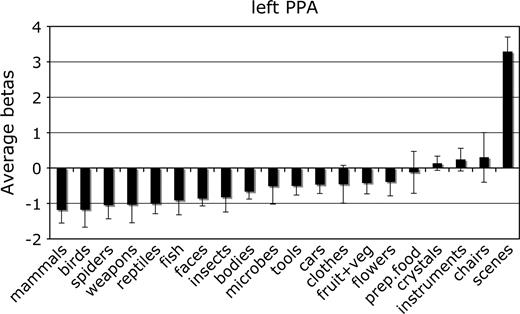
Mean parameter estimate of the response to each category in the left hemisphere PPA. Conventions as in Figure 2.
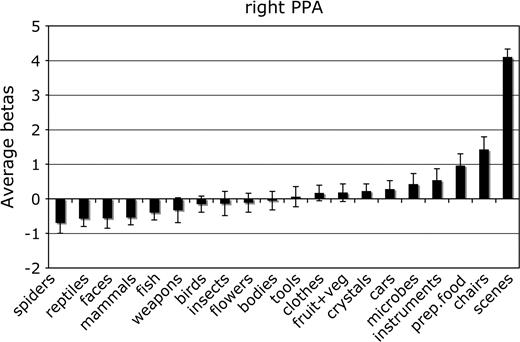
Mean parameter estimate of the response to each category in the right hemisphere PPA. Conventions as in Figure 2.
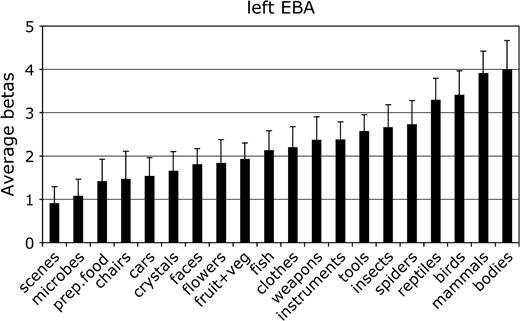
Mean parameter estimate of the response to each category in the left hemisphere EBA. Conventions as in Figure 2.
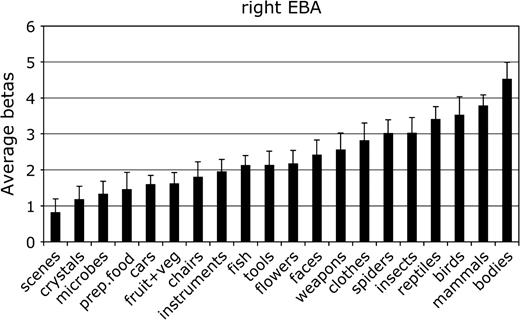
Mean parameter estimate of the response to each category in the right hemisphere EBA. Conventions as in Figure 2.
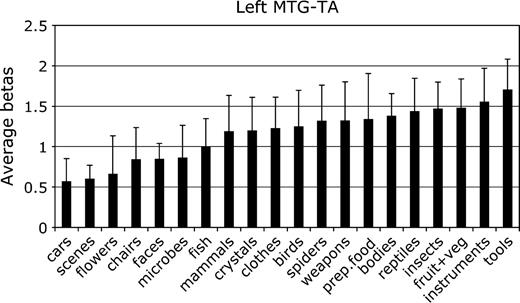
Mean parameter estimate of the response to each category in the left hemisphere MTG-TA. Conventions as in Figure 2.
For each ROI, we tested whether the response in that region to its preferred category was significantly greater than to the second most effective category. This difference was significant in the right FFA, F1,11 = 7.8, P < 0.05; the left and right PPA, F1,11 = 24.0 and 80.0, respectively, both P < 0.001; and the right EBA, F1,11 = 5.9, P < 0.05. The difference between bodies and birds did not reach significance in the left EBA, F1,11 < 1.0, not significant (NS), confirming previous evidence that body selectivity is stronger in the right than in the left hemisphere EBA (Downing and others 2001).
In the left MTG-TA, the highest response was to tools. This response neither was not significantly greater than that to the second highest category (instruments), F1,11 < 1, NS nor was it significantly greater than the response to the third- and fourth-ranking categories (fruits and vegetables, insects), both F1,11 < 1.1, P > 0.30. The response to tools was marginally greater than to the next-ranking category, reptiles, F1,11 = 2.9, P = 0.12. In a second analysis, we reasoned that tool selectivity might be stronger in those subjects in whom an MTG-TA ROI could be robustly identified in both separate halves of the data from the split-half analysis (see Materials and Methods). In this group, however, we found no significant differences between tools and the next two highest categories (bodies and fruits and vegetables), both F1,6 < 1.4, P values > 0.29. There was a significant difference, however, between tools and reptiles, F1,6 = 7.1, P < 0.05, and tools and mammals, F1,6 = 13.6, P = 0.01.
Finally, in a third analysis of tool specificity, we tested whether a broader localizer might identify a more robust and selective MTG-TA. Specifically, we performed split-half within-participant ROI analyses comparing the mean activation to tools, weapons, and musical instruments with the mean activation to mammals, birds, and reptiles. In this contrast, all the positively weighted items are manipulable, inanimate objects, and all the negatively weighted items are animals (cf., Chao, Haxby, and Martin 1999). In this analysis, we found a robust left MTG-TA in 8/12 participants (mean of peak coordinates: −49, −60, 4). The average response profile of the ROIs from this analysis is given in Supplementary Figure 2. The maximal response in this region was to weapons, followed by tools and fruits and vegetables. Neither tools nor weapons produced a significantly greater response than fruits and vegetables, both F1,7 < 1, NS. Thus, although this region does respond more strongly to some tools (broadly construed) than to some nontools, it does not respond systematically more to all tools than to all nontools.
We also tested the response pattern to nonpreferred stimuli in each ROI with a one-way ANOVA. For example, for the FFA, we tested for significant differences among the responses to non–face stimuli. Significant differences were found among nonpreferred categories in all ROIs—right FFA: F18,180 = 3.5, P < 0.001; left PPA: F18,198 = 3.2, P < 0.001; right PPA: F18,198 = 7.1, P < 0.001; left EBA: F18,198 = 10.0, P < 0.001; right EBA: F18,198 = 10.7, P < 0.001; and left MTG-TA: F18,198 = 1.8, P < 0.05.
The preceding analyses were repeated with the variation that each ROI was identified individually with a contrast of the preferred category versus a single control category (tools for FFA, PPA, and EBA; faces for MTG-TA). The resulting ROIs were highly similar to those reported earlier in their response patterns and mean Talairach peak. The main statistical results (preferred category significantly greater than second-best responder in FFA, PPA, and EBA, but not in MTG-TA; significant variation in the response to nonpreferred categories) were also confirmed.
Group-average analyses of faces, scenes, bodies, and tools also produced several other activations (for details, see Supplementary Table 1). Faces activated right posterior superior temporal sulcus, as reported previously (Puce and others 1995; Kanwisher and others 1997). Face-selective activity was also evident in several foci in right prefrontal cortex, in common with tasks requiring working memory for faces (e.g., Haxby and others 2000), although there was no working memory demand in the present study (for preliminary reports of a similar finding, see also Behrmann and Avidan 2005). Aside from the EBA, bodies activated a region of the right fusiform gyrus, in a similar location to the FFA. We report fuller analyses of body-selective responses in the fusiform gyrus elsewhere (Peelen and Downing 2005b; Schwarzlose and others 2005). Aside from the PPA, the comparison of scenes against all other categories activated both the transverse occipital sulcus (Grill-Spector 2003; Levy and others 2004; Epstein and others 2005) and the medial posterior occipital cortex. The latter of these likely reflects the activation of one or more retinotopic visual areas: although all images were of the same size, the scene stimuli in particular filled more of the image frame than other categories (see Fig. 1 and Supplementary Fig. 1). Finally, similar to previous findings (Chao and Martin 2000), tools produced activations posterior to the central sulcus in the left hemisphere.
Other Categories—Group-Average Analyses
Whole-brain group-average contrasts of each category against the average of the remaining 19 produced numerous activations in a variety of regions. Although it is not practical to discuss all of these in detail, we will briefly describe several activations of interest, on the grounds of contact with previous findings, or apparently novel strong selectivity for the defining category. A list of all activated regions from the group-average analyses, along with the mean response to each category in each of these regions, can be found in Supplementary Table 1.
Several activations were found in posterior occipital regions. These likely reflect differences in low-level properties between images from different categories. The responses in these regions did not show strong selectivity for particular categories.
Prepared foods produced a number of activations outside visual cortex, notably in regions of left superior frontal sulcus, bilateral amygdala/anterior hippocampus, and bilateral postcentral gyrus/sulcus (see Supplementary Table 1). However, in none of these activations did the selectivity generalize strongly to the other category of edible items tested, fruits and vegetables. Thus, these food-related activations do not appear to be generally selective for all edible things. Further tests, ideally using individually identified ROIs, could test alternative hypotheses, for example, that these activations reflect the emotional or arousal-related responses to appetitive stimuli.
Musical instruments produced an activation near Heschl's gyrus, known to contain multiple auditory areas (Zatorre and others 2002). This may reflect activation of sound-processing regions by visual objects that are associated with musical sounds. It is possible, for example, that participants spontaneously imagined the sounds associated with the instruments and that the imagined sounds produce activity in a fashion similar to real sounds (Kraemer and others 2005). We performed an additional test in order to determine whether the activation produced by musical instruments in this study overlaps with the brain regions engaged by actual musical stimulation. Four subjects who did not participate in the present experiment were tested in a blocked-design experiment comparing blocks of classical music with blocks of silence. These regions fell anterior to the activation produced by musical instruments, and the 2 activations did not overlap, even at lenient statistical criteria. Thus, on this preliminary test, it appears that viewing musical instruments does not engage the same regions that are stimulated by hearing complex musical stimuli.
Finally, several regions showed apparently high selectivity for insects (e.g., in bilateral postcentral gyrus, left middle frontal gyrus, and left inferior parietal lobule; see Supplementary Table 1). Strikingly, the responses of these regions did not generalize to spiders, which, although formally classified as distinct from insects, are highly similar to them visually and structurally. Again, as noted earlier, further targeted follow-up studies would be necessary to disentangle alternate hypotheses about what aspects of insect stimuli—whether visual, semantic, emotional, or otherwise—engage these regions.
Several other group-average activations produced by a single category (compared with the remaining 19) were located near the FFA, PPA, or EBA (see Supplementary Table 1). These clusters generally showed maximal or near-maximal activation to faces, scenes, or bodies, even though they were defined by their high response to another category. For example, in contrasts testing mammals, birds, and clothes, activations overlapped or were adjacent to the right EBA. In each of these clusters, however, the response to human bodies was higher than the category used to define the region (mammals: F1,11 = 9.0, P < 0.05; clothes: F1,11 = 27.0, P < 0.001) or did not significantly differ from the highest response (birds: F1,11 = 2.5, P = 0.15). Prepared foods and chairs each produced activations near the PPA, but these regions showed equivalent (food: F1,11 = 1.3, P = 0.28) or higher (chairs: F1,11 = 43.3, P < 0.001) activation to scenes. Likewise, mammals produced an activation in the fusiform gyrus, but the response to mammals in this region was not greater than that to faces, F1,11 = 1.1, P = 0.32.
These findings, however, could be affected by intersubject variability in the location of category-selective activations. For example, it could be that at the group level, the activation to mammals coincides with the EBA, but at the individual level, there may be a separate region that responds maximally to mammals (and significantly more to mammals than to the second-ranking category). To test this possibility, we performed individual-subject split-half ROI localization for mammals and bodies (near the FFA), mammals, birds, and clothes (near the EBA), and prepared foods and chairs (near the PPA). In each case, the ROI was defined by contrasting the category of interest against the average of the remaining 19 categories. In these contrasts, the maximal responses in fusiform gyrus, parahippocampal gyrus, and posterior MTG were generally to faces, scenes, and bodies, respectively (for details, see Supplementary Table 2). In no case was the response to any category greater than that to faces, scenes, or bodies in the posterior fusiform, posterior parahippocampal, or posterior inferior temporal sulcus regions, respectively. The same pattern of results held when the analyses were repeated with ROIs defined using a single category (tools) as the baseline. In sum, in the cortex surrounding and including the FFA, PPA, and EBA, only 1 category (faces, scenes, or bodies, respectively) produced a significantly enhanced response relative to the next most effective stimulus.
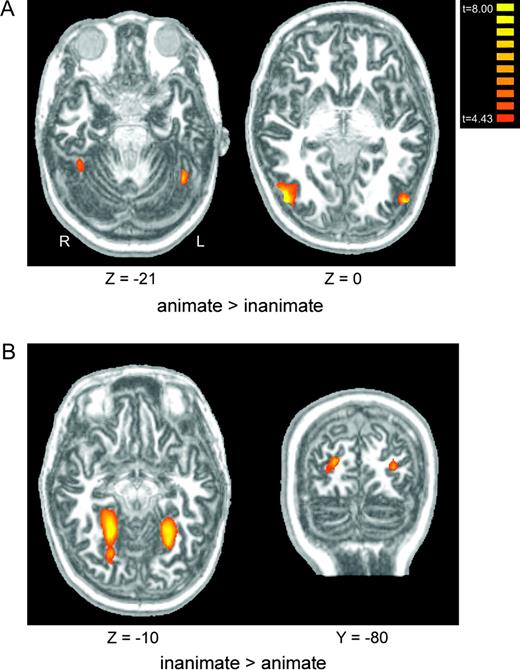
Finally, we performed a group-average contrast to test for a more general animate/inanimate division in visual cortical representations. Two bilateral regions responded more strongly to animate objects (bodies, faces, mammals, birds, fish, insects, spiders, and reptiles) than to inanimate objects (tools, crystals, musical instruments, cars, weapons, prepared foods, clothes, chairs, and fruits and vegetables). These regions partially coincided with the EBA and FFA in both the left and right hemisphere (Fig. 8A). Areas showing more activation to inanimate than animate objects included lingual/parahippocampal gyrus (overlapping the PPA) and transverse occipital sulcus (Fig. 8B). Thus, the activations generated by animate kinds appear to be limited to areas already known to respond strongly to images of the bodies and faces of humans, and, to a lesser extent, to other species. In contrast, the activations elicited generally by inanimate kinds appear common to some of those generated by scenes (see Supplementary Table 1). Previous studies of the PPA have already demonstrated that it responds very weakly to faces (Epstein and Kanwisher 1998); this low response appears to generalize to other biological kinds. The general biases for animate categories in the FFA and EBA, and for inanimate categories in the PPA, can also be seen in the response profiles shown in Figures 2–6. We find essentially the same results in a comparable (and mostly overlapping) contrast of living (birds, bodies, faces, fish, flowers, fruits and vegetables, insects, mammals, reptiles, and spiders) versus nonliving (cars, chairs, clothes, crystals, instruments, prepared food, tools, and weapons) categories.
(A) Regions responding more to animate than inanimate objects include bilateral fusiform gyrus (left) and bilateral MTG/superior temporal sulcus (right). (B) Regions responding more to inanimate than animate objects include bilateral parahippocampal gyrus (left) and bilateral transverse occipital sulcus (right).
Discussion
This study had 3 goals: to measure the selectivity of previously identified category-specific brain regions, to characterize the profile of response to nonpreferred categories in each of these areas, and to search for new selective regions in visual cortex. Our findings with respect to each of these goals are reviewed subsequently in turn.
Selectivity of Previously Identified Brain Regions
In the right FFA, bilateral PPA, and right EBA, the response to faces, scenes, and bodies (respectively) was significantly greater than to the second most effective stimulus. Thus, even when tested against a wide range of control categories, some of which are visually or semantically quite similar to these regions' preferred categories, the FFA, PPA, and EBA exhibit robust selectivity for their preferred category. These findings are based on analyses in which 1 data set is used to define each ROI, and an independent data set is used to measure the magnitude of response of that region to each of the stimulus categories, thus avoiding statistical biases in our estimates of response magnitudes. Ours is a more stringent test of category selectivity than has been conducted in prior studies where only a handful of stimulus conditions were tested. Accordingly, our data strengthen the evidence for the selectivity of each of these regions.
For the case of tools, we found a posterior occipitotemporal region in many subjects that responded strongly to tools and other manipulable inanimate objects (musical instruments and weapons). This region appears comparable with the MTG activation identified in previous work comparing tools and animals (Chao, Haxby, and Martin 1999). In each of the different contrasts used to identify the MTG-TA, it showed a generally elevated response to manipulable objects relative to animals (e.g., mammals). However, this selectivity was weaker than for the other ROIs and was contradicted by some notable exceptions—such as the high response to reptiles evident in Figure 7. Thus, the MTG-TA region does not appear to exhibit the strong category selectivity shown by the FFA, PPA, and EBA. However, given that complex moving stimuli broadly activate this general region (Beauchamp and others 2003), the MTG-TA may require moving objects to show selectivity comparable with that seen in other areas for static images.
Responses to Nonpreferred Categories
In each of the ROIs examined in detail here, the responses to nonpreferred categories varied significantly. That is, these regions did not respond in an all-or-none fashion to their preferred category but rather showed a systematic gradation of responses from most effective to least effective stimulus. The contrasts between animate and inanimate classes illustrated that one aspect of this gradation may be a general bias for animate kinds in the FFA and EBA and for inanimate kinds in the PPA. Intermediate activations of hypothetical modules, of the sort shown here, have been explained in a variety of ways. They could reflect 1) the partial but epiphenomenal engagement of a truly category-specific system by items outside that category (Kanwisher 2000), 2) a domain-general, process-specific system that is engaged to varying degrees by different kinds of stimuli (Gauthier 2000), 3) semantic or top-down associations between kinds (e.g., between faces and bodies; Cox and others 2004), 4) subsets of broad activation profiles spanning centimeters of cortex, with each object category coded by the entire profile of response (Haxby and others 2001), or 5) “partial voluming,” that is, pooling across distinct neural populations that are interleaved within a voxel but that each respond exclusively to a single stimulus category.
Recent work argues for the partial voluming account, at least for 1 region. The present experiments and earlier studies have found strong activation of the FFA and adjacent cortex by nonhuman animals (Chao, Martin, and Haxby 1999; Kanwisher and others 1999) and human bodies (Peelen and Downing 2005b; Spiridon and others 2005). Peelen and Downing (2005b) argued for overlapping but functionally separate selective representations of the human body and face in the posterior fusiform gyrus. This has been further supported by high-resolution fMRI (Schwarzlose and others 2005) showing very small, distinct, abutting patches of cortex, one selective for faces but not bodies and the other selective for bodies but not faces. Thus, the graded levels of activation of what appears to be a single “area” at standard scanning resolutions may, in fact, reflect small, intertwined populations of highly tuned, category-specific neurons (Quiroga and others 2005). Further studies at high resolution, along with parallel physiological investigations in monkeys, will help determine whether the graded responses in other cortical regions are also due to pooling across distinct neural populations, each exclusively selective for a single category.
Even if some positive nonpreferred responses remain in putative category-selective regions at higher resolution, the question remains whether these nonpreferred responses actually reflect functional engagement related to performing a perceptual task. Recent studies have approached this question by measuring the trial-by-trial correlation between fMRI responses and task performance (e.g., Grill-Spector and others 2004), demonstrating category-specific disruption from electrical stimulation of focal patches of cortex (Puce and others 1999; Mundel and others 2003), and testing whether disruption of neural activity with transcranial magnetic stimulation (TMS) produces category-specific deficits (Urgesi and others 2004). Further, the classic method of testing neurological patients may be helpful here: some regions that show overlapping activations in neuroimaging may be necessary for processing just one of the stimuli that activates that region, a possibility that could be tested with neuropsychological investigations.
Do Other Category-Selective Regions Exist?
Aside from the areas discussed earlier, we did not find other regions in visual cortex that are strongly selective for individual categories, nor for animate or inanimate kinds generally. It must be noted, however, that there are several reasons why category selectivity might have been missed with the present techniques. Other category-selective regions may exist at a grain that is below the voxel resolution used here or indeed below the resolution of any technique that relies on hemodynamics as the measure of neural activity. Addressing this will require further evidence from higher resolution fMRI studies (e.g., Grill-Spector and others 2005; Schwarzlose and others 2005), as well as from invasive single-neuron studies of human subjects (Kreiman and others 2000). Similarly, functional specialization may exist for some categories but not be anatomically localized. Diffuse networks of functionally independent neurons could in principle work coherently to represent a particular class of visual stimulus. Category selectivity may not be an entirely bottom-up feature of cortex, at least in some brain regions, but may depend on the current task being performed (Noppeney and others 2005) or on influences from other regions. Finally, of course, any survey of the kind reported here depends on the selection by the experimenter of stimulus kinds to test. The “natural kinds” that make up semantic categories may not be the same categories that the brain observes when carving up the problem of high-level vision. Despite these limitations, the present study represents the most comprehensive search for such regions to date, and it suggests that category-selective regions of the cortex on the scale of the FFA, PPA, and EBA are relatively rare.
Why does the cortex contain relatively large specialized regions for faces, places, and bodies but (apparently) not for other categories like food, chairs, or flowers? We can only speculate. Faces, bodies, and scenes share 3 properties, which are not all present in any of the other categories tested here. First, on the timescale of the evolution of the species, the representation of environments and conspecifics is likely to have been critical to survival. Second, during an individual's life span, each person is exposed extensively to other people and to his or her own spatial surroundings. Finally, in all 3 cases, the visual appearance of exemplars of the stimulus class is highly constrained. The many geometric constraints on the appearance of faces, bodies, and environments may make visual processing of these classes more amenable to “modular” analysis. Do focal neural specializations for a particular stimulus class tend to arise to the extent that all 3 of the above conditions are met?
A test of this conjecture is provided by the case of words, which does not meet our first condition. Intracranial recordings have revealed fast-evoked responses from the inferior temporal cortex that are selective to letter strings (Allison and others 1994; Nobre and others 1994). More recently, fMRI studies have indicated selectivity to some aspects of written letters (Polk and others 2002) or letter strings (e.g., Puce and others 1996; Cohen and Dehaene 2004) in posterior fusiform gyrus, particularly in the left hemisphere. Although the status of this region as a module for word-form recognition is still debated (Cohen and others 2002; Price and Devlin 2003, 2004; Cohen and Dehaene 2004), recent evidence provides powerful support for the idea that the selectivity of this region is shaped by experience (Baker and others 2005). This finding suggests that specific genetic/evolutionary predispositions for a given stimulus category may not be necessary for the brain to allocate a region to processing just stimuli of that class.
Conclusion
By testing the cortical response to 20 different stimulus categories, this study represents the broadest survey to date of category selectivity in visual cortex. The results demonstrate both the strong selectivity of a small number of cortical regions and the scarcity of such regions.
We thank R. Epstein, M. Hoerger, D. Linden, I. Morrison, O. Turnbull, and R. Ward for helpful discussions and T. Bedson and P. Birch for technical support. This work was supported by the Biotechnology and Biological Sciences Research Council BB/C502530/1 to PED, an Economic and Social Research Council studentship to AW-YC, and EY13455 and EY016231 to NK.
References
Aguirre GK, Zarahn E, D'Esposito M.
Allison T, McCarthy G, Nobre A, Puce A, Belger A.
Allison T, Puce A, Spencer DD, McCarthy G.
Baker C, Liu J, Wald L, Benner T, Kanwisher N.
Beauchamp MS, Lee KE, Haxby JV, Martin A.
Behrmann M, Avidan G.
Caramazza A, Mahon BZ.
Chao LL, Haxby JV, Martin A.
Chao LL, Martin A.
Chao LL, Martin A, Haxby JV.
Cohen L, Dehaene S.
Cohen L, Lehéricy S, Chochon F, Lemer C, Rivaud S, Dehaene S.
Cox D, Meyers E, Sinha P.
Dixon MJ, Piskopos M, Schweizer TA.
Downing PE, Jiang Y, Shuman M, Kanwisher N.
Epstein R, Kanwisher N.
Epstein R, Harris A, Stanley D, Kanwisher N.
Epstein RA, Higgins JS, Thompson-Schill SL.
Földiák P, Xiao D, Keysers C, Edwards R, Perrett DI.
Gauthier I.
Gauthier I, Behrmann M, Tarr MJ.
Gauthier I, Skudlarski P, Gore JC, Anderson AW.
Grill-Spector K, Knouf N, Kanwisher N.
Grill-Spector K, Sayres A, Ress D.
Hart J, Berndt RS, Caramazza A.
Hasson U, Nir Y, Levy I, Fuhrmann G, Malach R.
Haxby JV, Petit L, Ungerleider LG, Courtney SM.
Haxby JV, Gobbini MI, Furey ML, Ishai A, Schouten JL, Pietrini P.
Ishai A, Ungerleider LG, Martin A, Schouten JL, Haxby JV.
Kanwisher N, McDermott J, Chun MM.
Kanwisher N, Stanley D, Harris A.
Kraemer DJ, Macrae CN, Green AE, Kelley WM.
Kreiman G, Koch C, Fried I.
Levy I, Hasson U, Harel M, Malach R.
Moscovitch M, Winocur G, Behrmann M.
Mundel T, Milton JG, Dimitrov A, Wilson HW, Pelizzari C, Uftring S, Torres I, Erickson RK, Spire JP, Towle VL.
Nobre AC, Allison T, McCarthy G.
Noppeney U, Price CJ, Penny WD, Friston KJ. June 8,
Peelen MV, Downing PE.
Peelen MV, Downing PE.
Polk TA, Stallcup M, Aguirre GK, Alsop DC, D'Esposito M, Detre JA, Farah MJ.
Price CJ, Devlin JT.
Puce A, Allison T, Asgari M, Gore JC, McCarthy G.
Puce A, Allison T, Gore JC, McCarthy G.
Puce A, Allison T, McCarthy G.
Quiroga RQ, Reddy L, Kreiman G, Koch C, Fried I.
Schwarzlose RF, Baker CI, Kanwisher N.
Spiridon M, Fischl B, Kanwisher N.
Talairach J, Tournoux P.
Tong F, Nakayama K, Moscovitch M, Weinrib O, Kanwisher N.
Tootell RB, Tsao D, Vanduffel W.
Urgesi C, Berlucchi G, Aglioti SM.
Van Essen DC, Anderson CH, Felleman DJ.
Author notes
1School of Psychology, University of Wales, Bangor, Gwynedd LL57 2AS, UK, 2Medical Research Council Cognition and Brain Sciences Unit, 15 Chaucer Road, Cambridge, CB2 2EF, UK and 3Department of Brain and Cognitive Sciences, Massachusetts Institute of Technology, 77 Massachusetts Avenue, NE20-454, Cambridge, MA 02139, USA