


Abstract
Classically regarded as motor structures, the basal ganglia subserve a wide range of functions, including motor, cognitive, motivational, and emotional processes. Consistent with this broad-reaching involvement in brain function, basal ganglia dysfunction has been implicated in numerous neurological and psychiatric disorders. Despite recent advances in human neuroimaging, models of basal ganglia circuitry continue to rely primarily upon inference from animal studies. Here, we provide a comprehensive functional connectivity analysis of basal ganglia circuitry in humans through a functional magnetic resonance imaging examination during rest. Voxelwise regression analyses substantiated the hypothesized motor, cognitive, and affective divisions among striatal subregions, and provided in vivo evidence of a functional organization consistent with parallel and integrative loop models described in animals. Our findings also revealed subtler distinctions within striatal subregions not previously appreciated by task-based imaging approaches. For instance, the inferior ventral striatum is functionally connected with medial portions of orbitofrontal cortex, whereas a more superior ventral striatal seed is associated with medial and lateral portions. The ability to map multiple distinct striatal circuits in a single study in humans, as opposed to relying on meta-analyses of multiple studies, is a principal strength of resting state functional magnetic resonance imaging. This approach holds promise for studying basal ganglia dysfunction in clinical disorders.
Introduction
Classically regarded as motor structures (Kemp and Powell 1971), the basal ganglia have been implicated in a variety of motor-related functions such as motor selection, preparation, and execution (e.g., Gerardin et al. 2004). Consistent with this role, human lesion studies and clinical studies of neurological populations such as Parkinson's disease, Tourette's syndrome, and Huntington's disease have implicated basal ganglia dysfunction in motor abnormalities such as rigidity, tremor, akinesia, choreiform movements, and tics (Bhatia and Marsden 1994; Albin and Mink 2006; Montoya et al. 2006; Wichmann and DeLong 2006).
Nonhuman primate (Selemon and Goldman-Rakic 1985; Alexander et al. 1986; Cavada and Goldman-Rakic 1991; Middleton and Strick 2000b; Haber 2003) and neuroimaging studies have suggested a broader conceptualization of the role of the basal ganglia, implicating these structures in a diverse array of executive/cognitive control (e.g., verbal and spatial working memory, response inhibition, task switching, reasoning, and planning; Postle and D'Esposito 2003; Crottaz-Herbette et al. 2004; Garavan et al. 2006; Monchi et al. 2006; Rubia et al. 2006), and reward-related/motivational processes (e.g., prediction error; feedback-related reinforcement; reward anticipation; incentive salience; McClure et al. 2003; Ernst et al. 2005; Knutson and Cooper 2005; Delgado 2007). Basal ganglia dysfunction has also been implicated in psychopathological conditions associated with deficits in executive and motivational processes, including major depressive disorder, bipolar disorder, schizophrenia, substance use disorders, obsessive compulsive disorder, and attention-deficit/hyperactivity disorder (ADHD) (Castellanos et al. 1996; Lafer et al. 1997; Stein et al. 2000; Shenton et al. 2001; Sagvolden et al. 2005; Sonuga-Barke 2005; Chang et al. 2007; Wessa et al. 2007).
In recent years researchers have begun to appreciate distinctions within the classical basal ganglia structures (e.g., caudate, putamen, globus pallidus), as well as the functionally distinct neural circuits associated with different basal ganglia subregions. For example, specific reward related processes have been differentially attributed to ventral versus dorsal striatum with the former implicated in prediction of future rewards, and the latter in maintaining information about reward outcomes (O'Doherty et al. 2004). Similarly, different aspects of movement are represented in distinct putamen and caudate regions (Gerardin et al. 2004).
Given that most of our knowledge of basal ganglia circuitry is based on animal circuit tracing studies (Selemon and Goldman-Rakic 1985; Cavada and Goldman-Rakic 1991; Middleton and Strick 1994; Ferry et al. 2000; Haber et al. 2000, 2006; Middleton and Strick 2002), investigators have recently attempted to examine basal ganglia subdivisions and circuitry in humans, with some success, though with notable limitations. For instance, 2 preliminary diffusion tensor imaging (DTI) studies (Lehericy et al. 2004; Leh et al. 2007) confirmed the segregation of corticostriatal connections, particularly with frontal cortex. However, in contrast with nonhuman primate data (Kunishio and Haber 1994; Haber et al. 2006), ventral striatum was not found to be connected with cingulate cortex. This negative result was not unexpected, as DTI fiber tract reconstruction is less accurate for complex fiber directions such as those in frontal lobe, and the samples in both studies were very small. Finally, as anatomical studies, the DTI investigations by Lehericy et al. and Leh et al. do not provide direct information about functional networks.
An alternative approach to describing striatal functional networks involved a meta-analysis of 126 functional magnetic resonance imaging (fMRI) and positron-emission tomography human neuroimaging studies (Postuma and Dagher 2006). The meta-analysis demonstrated functionally distinct anatomical areas within striatum. However, orbitofrontal cortex (OFC) was not found to be coactivated with ventral striatum, despite specific predictions regarding its role in emotion/motivation, and its documented anatomical connectivity with ventral striatum shown in animal studies (Ferry et al. 2000; Haber et al. 2006).
Our goal in this study was to map basal ganglia circuitry in humans using recently developed resting state functional connectivity techniques (Fox and Raichle 2007; Margulies et al. 2007), which rely on detecting coherent patterns of spontaneous activity. This approach appears to delineate entire functional networks which are typically observed in task activation-based studies in a more fragmentary manner (Fox and Raichle 2007). Additionally, resting state scanning avoids potential confounds or limitations encountered in task-based approaches (e.g., practice, ceiling or floor effects, or differential performance levels) (Greicius et al. 2003; Beckmann et al. 2005; Fransson 2005; DeLuca et al. 2006; Damoiseaux et al. 2006; Dosenbach et al. 2007; Fair et al. 2007). Taking the anterior cingulate cortex (ACC) as an initial example, we recently demonstrated that resting state analyses can provide a comprehensive examination of functional connectivity in a structurally and functionally heterogeneous structure (Margulies et al. 2007). Our analyses revealed more fine-grained patterns of differentiation among ACC subregions than appreciated in task-based studies (Paus et al. 1998; Bush et al. 2000; Kiehl et al. 2000; Braver et al. 2001; van Veen et al. 2001; Weissman et al. 2004; Milham and Banich 2005).
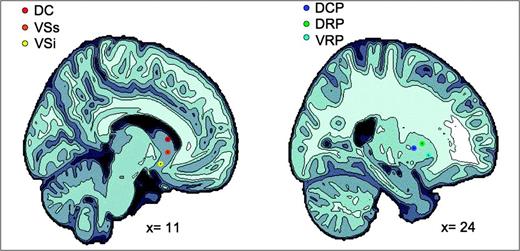
In the present work, we subdivide striatal subregions in Talairach space following Postuma and Dagher (2006) by defining 6 seed regions: dorsal caudate (DC), ventral caudate (superior), ventral caudate/nucleus accumbens (inferior), dorsal rostral putamen (DRP), dorsal caudal putamen (DCP), and ventral rostral putamen (VRP) (see Fig. 1 and Table 1). Consistent with prior work we hypothesized that differential patterns of connectivity would be noted across the 6 striatal subregions examined. More specifically, for the putamen, we predicted that the rostral division would show greater connectivity with regions involved in cognition than the caudal division, reflecting the commonly cited cognitive/motor distinction (Parent and Hazrati 1995). Among the caudate subregions, we hypothesized that 1) the inferior ventral striatal region would exhibit greater connectivity with limbic and orbitofrontal regions (not previously detected in the Postuma and Dagher meta-analysis) than with dorsal regions involved in cognition, 2) that dorsal caudate would show greater connectivity with dorsolateral prefrontal and parietal cortices than with ventral regions involved in affective processing, and 3) that superior ventral striatum (VSs) would correlate with intermediate regions along the ventral-dorsal axis. As in the example of the ACC, for each of these distinctions, we expected to find more detailed patterns of functional connectivity than have previously been appreciated in task-based fMRI human studies.
Coordinates for striatal regions of interest
| x | y | z | |
| VSi | (±) 9 | 9 | −8 |
| VSs | (±) 10 | 15 | 0 |
| DC | (±) 13 | 15 | 9 |
| DCP | (±) 28 | 1 | 3 |
| DRP | (±) 25 | 8 | 6 |
| VRP | (±) 20 | 12 | −3 |
| x | y | z | |
| VSi | (±) 9 | 9 | −8 |
| VSs | (±) 10 | 15 | 0 |
| DC | (±) 13 | 15 | 9 |
| DCP | (±) 28 | 1 | 3 |
| DRP | (±) 25 | 8 | 6 |
| VRP | (±) 20 | 12 | −3 |
Note: Coordinates for right and left hemisphere seeds defined in the MNI stereotaxic space.
Representation of the 6 striatal regions of interest. The left and the right panels show the projection of the 3 caudate regions (i.e., DC; VSs; VSi), and the 3 putamen regions (i.e., DCP; DRP; VRP), respectively, onto sagittal brain views for x = 11 and x = 24.
Methods
Participants
Thirty-five right-handed native English-speaking participants were included (20 males; mean age: 28.4 ± 8.5 years). Subjects had no history of psychiatric or neurological illness as confirmed by a psychiatric clinical assessment. The study was approved by the institutional review boards of the New York University School of Medicine and New York University. Signed informed consent was obtained prior to participation.
Data Acquisition
A Siemens Allegra 3.0 Tesla scanner equipped for echo planar imaging (EPI) was used for data acquisition. For each participant, we collected 197 contiguous EPI functional volumes (time repetition [TR] = 2000 ms; time echo [TE] = 25 ms; flip angle = 90, 39 slices, matrix = 64 × 64; field of view [FOV] = 192 mm; acquisition voxel size = 3 × 3 × 3 mm). Complete cerebellar coverage was not obtained for all participants. Thus, only those cerebellar regions covered by the EPI array in all subjects were included in the statistical analyses described below (see Supplementary Fig. 1 for depiction of cerebellar coverage). During the scan, participants were instructed to rest with their eyes open while the word “Relax” was centrally projected in white, against a black background. For spatial normalization and localization, a high-resolution T1-weighted anatomical image was then acquired using a magnetization prepared gradient echo sequence (TR = 2500 ms; TE = 4.35 ms; time of inversion = 900 ms; flip angle = 8; 176 slices, FOV = 256 mm).
Image Preprocessing
Data processing was carried out using both analysis of functional neuroimaging (AFNI) (http://afni.nimh.nih.gov/afni/) and fMRIb software library (FSL) (www.fmrib.ox.ac.uk). Image preprocessing using AFNI consisted of 1) slice time correction for interleaved acquisitions, using Fourier interpolation, 2) 3D motion correction (3D volume registration using least-squares alignment of 3 translational and 3 rotational parameters), and 3) despiking (squashing of extreme time series outliers using a hyperbolic tangent function). Preprocessing using FSL consisted of 4) spatial smoothing (Gaussian kernel of full width half maximum 6 mm), 5) temporal highpass filtering (Gaussian-weighted least-squares straight line fitting with sigma = 100.0 s), and 6) temporal lowpass filtering (Gaussian filter with half width at half maximum = 2.8 s).
Functional Connectivity: Region of Interest Selection and Seed Generation
The goal of the present study was to provide a comprehensive survey of functional connectivity of striatal architecture. We 1st distinguished ventral striatum and dorsal caudate (using z < 7 mm as marker for ventral striatum and z > 7 mm as marker for dorsal caudate, following Postuma and Dagher (2006). Second, we divided the ventral striatum into inferior and superior regions (VSi and VSs, respectively) corresponding to nucleus accumbens and ventral caudate, respectively (Heimer and Alheid 1991; Drevets et al. 1999). Third, to confirm the putamen's dorsal–ventral coactivation gradient previously described by Postuma and Dagher (2006), putamen was divided into dorsal and ventral regions (using z = 2 mm as the boundary per Postuma and Dagher 2006). Finally, in order to obtain a finer parcellation, we identified dorsal caudal, dorsal rostral, and ventral rostral putamen subregions. The globus pallidus, substantia nigra, and subthalamic nucleus were excluded in the present examination due to limitations of the spatial resolution of the data acquired (3 × 3 × 3 mm), which was selected to maximize brain coverage. The seed coordinates were 1st selected based on the atlas space of Talairach and Tournoux (1988). Second, they were transformed into the Montreal Neurological Institute (MNI) space using the algorithm implemented by Brett (1999). Third, each set of transformed coordinates was visually inspected, and, when necessary, manually corrected to be centered within gray matter (using the 152 brain standard MNI gray matter provided by FSL) with a minimum Euclidean distance requirement between any 2 regions of 8 mm (see Table 1 for seed coordinates; see Fig. 1 and Supplementary Fig. 2 for seed locations). One set of seeds was created for each hemisphere (each seed covered 123 voxels in 1 × 1 × 1 mm space with a radius of 3.5 mm). In order to obtain the time series for each seed, for each subject, we 1) transformed each subject's time series into MNI space using a 12 degree of freedom linear affine transformation implemented in FLIRT (voxel size = 1 × 1 × 1 mm), and 2) calculated the mean time series for each seed by averaging across all voxels within the seed.
Functional Connectivity: Nuisance Signals
The time series of 9 nuisance signals were identified for inclusion in our analyses: global signal, white matter (WM), cerebrospinal fluid (CSF), and 6 motion parameters. As the global signal is thought to reflect a combination of physiological processes (such as cardiac and respiratory fluctuations) and scanner drift, it was included as a nuisance signal to minimize the influence of such factors (Gavrilescu et al. 2002; Macey et al. 2004; Birn et al. 2006). In order to extract the nuisance covariate time series for WM and CSF, we 1st segmented each individual's high-resolution structural image, using FSL's FAST segmentation program. The resulting segmented WM and CSF images were then thresholded to ensure 80% tissue type probability. These thresholded masks were then applied to each individual's time series, and a mean time series was calculated by averaging across all voxels within the mask (for individual examples of WM and CSF masks and placement, see Supplementary Fig. 3).
Functional Connectivity: Statistical Analysis
For each hemisphere, a multiple regression analysis was performed for each individual subject (using the general linear model implemented in FSL's FEAT), including the time series for the 6 basal ganglia seeds and the 9 nuisance covariates as predictors.
Time series for the basal ganglia seeds were orthogonalized (using the Gram-Schmidt process) with respect to each other, and with respect to the nuisance covariates, to ensure that the time series for each seed mask reflected its unique variance. This analysis produced individual subject-level maps of all positively and negatively predicted voxels for each regressor. As shown in Margulies et al. (2007), orthogonalizing the time series for each of the seeds with respect to each other does not lead to underestimation of functional connectivity due to removal of common variation, or artifactual generation of negative correlations (see Supplementary Fig. 4).
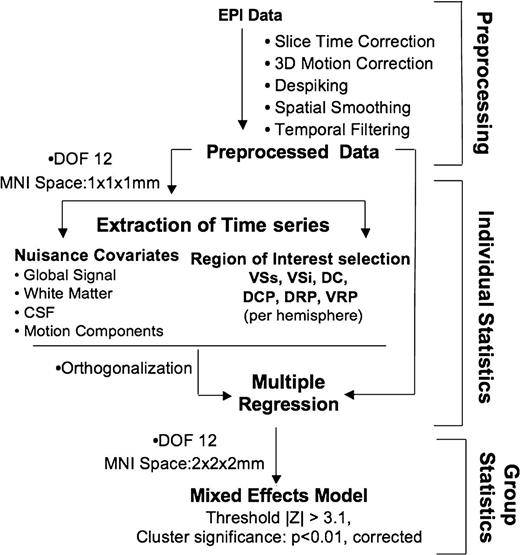
Group-level analyses were carried out using a mixed-effects model (FLAME) implemented in FSL. Corrections for multiple comparisons were carried out at the cluster level using Gaussian random field theory (min Z > 3.1; cluster significance: P < 0.01, corrected). This group-level analysis produced threshold Z score maps of activity associated with each basal ganglia seed as well as direct comparison of functional connectivity between striatal seeds. For a summary sketch of data path, see Figure 2.
Data analysis overview. Summary sketch of the data analysis steps included in preprocessing, and individual and group statistics. Abbreviations from the top: DOF- degrees of freedom.
Results
Positive Relationships
Inferior and Superior Ventral Striatum
Examination of functional connectivity during rest revealed a differential pattern of OFC connectivity among ventral striatum subregions (see Fig. 3 and Table 2). More specifically, spontaneous fluctuations in the VSi seed, which was selected to approximate the location of the nucleus accumbens, primarily correlated with the medial OFC (Brodmann area [BA] 11/25), whereas the VSs seed predicted patterns of activity in more superior and lateral portions of OFC (BA 10). This pattern of distinct regional functional differentiation between neighboring ventral striatal seeds extended beyond OFC. Specifically, VSi predicted activation within regions implicated in emotional processing such as parahippocampal gyrus, and posterior cingulate cortex (BA 23), whereas VSs did not. In contrast, the VSs seed predicted activity in regions associated with executive function, decision making, and motor planning such as dorsolateral prefrontal cortex (DLPFC; BA 9), inferior frontal gyrus (BA 47), and rostral anterior cingulate (BA 32). Such differences were supported by the direct statistical comparisons between VSs and VSi seeds (see Fig. 4 and Table 3 for direct comparisons of the right hemisphere seed).
Positive relationships of right striatal and dorsal caudate seeds
| Seed | Region | BA | Talairach | Z | ||
| x | y | z | ||||
| VSi | ||||||
| OFC/ACC (L) | 25/11 | −8 | 27 | −13 | 8.73 | |
| 11 | −4 | 54 | −11 | 7.22 | ||
| Inferior frontal gyrus (R) | 47/13 | 32 | 13 | −12 | 6.04 | |
| 47 | 28 | 26 | −20 | 5.87 | ||
| Precuneus (L) | 7 | −6 | −60 | 34 | 5.09 | |
| Posterior cingulate (L) | 23 | −6 | −56 | 17 | 5.52 | |
| 23 | −6 | −24 | 31 | 4.27 | ||
| 24 | −4 | 11 | 27 | 3.75 | ||
| Parahippocampal gyrus | −26 | −20 | −12 | 5.79 | ||
| 18 | −18 | −14 | 6.50 | |||
| Inferior/middle temporal gyrus (R and L) | 21 | 48 | 4 | −34 | 5.57 | |
| 21 | −60 | −10 | −13 | 5.12 | ||
| 20 | 54 | −7 | −16 | 6.11 | ||
| Caudate head (L) | −10 | 7 | −7 | 9.87 | ||
| VSs | ||||||
| Medial frontal gyrus (C) | 10 | 0 | 64 | 0 | 5.77 | |
| Anterior cingulate gyrus (R) | 32 | 2 | 43 | −4 | 5.50 | |
| Caudate head (L) | −10 | 10 | 0 | 8.62 | ||
| DC | ||||||
| Superior frontal gyrus (R and L) | 9 | 22 | 47 | 36 | 6.71 | |
| 9 | −16 | 54 | 29 | 6.00 | ||
| 10 | 20 | 67 | −8 | 6.05 | ||
| 10 | 30 | 62 | 5 | 5.81 | ||
| 10 | −32 | 56 | −3 | 4.87 | ||
| 8 | 14 | 30 | 48 | 6.02 | ||
| 8 | −20 | 24 | 47 | 5.66 | ||
| 11 | −22 | 56 | −10 | 4.87 | ||
| Middle frontal gyrus (R and L) | 8 | 36 | 24 | 45 | 5.21 | |
| 8 | −46 | 14 | 40 | 5.30 | ||
| Middle/inferior frontal gyrus (L) | 45 | −30 | 27 | 41 | 5.42 | |
| Inferior frontal gyrus (L) | 47 | 28 | 15 | −14 | 3.36 | |
| Medial frontal gyrus (R and L) | 10 | 2 | 63 | 15 | 6.14 | |
| 10 | −2 | 53 | 5 | 6.32 | ||
| 9 | 0 | 48 | 31 | 5.89 | ||
| Anterior cingulate (R) | 32 | 14 | 36 | 11 | 5.14 | |
| 32 | 2 | 40 | 13 | 6.13 | ||
| Posterior cingulate (R) | 31 | −4 | −49 | 30 | 3.79 | |
| Inferior parietal lobule (L) | 40 | 50 | −58 | 43 | 5.27 | |
| Inferior/middle temporal gyrus (R and L) | 20 | 66 | −26 | −14 | 4.54 | |
| 21 | −64 | −26 | −14 | 4.54 | ||
| 21 | 54 | −9 | −28 | 3.92 | ||
Note: List of the brain regions showing a significant (|Z| > 3.1; cluster significance: P < 0.01, corrected) positive relationship with VSi (x = 9, y = 9, z = −8), VSs (x = 10, y = 15, z = 0), and DC (x = 13, y = 15, z = 9) in the right hemisphere seeds. L: left; R: right; Z: Z score of peak of activation.
Direct comparisons: right VSs versus VSi
| Contrast | Region | BA | Talairach | Z | ||
| x | y | z | ||||
| VSi > VSs | ||||||
| OFC (R) | 11/25 | 8 | 27 | −15 | 4.25 | |
| Rectal gyrus (L) | 11 | −10 | 34 | −19 | 4.02 | |
| Anterior cingulate (R) | 25 | 6 | 7 | −7 | 8.81 | |
| Parahippocampal gyrus (R & L) | 36 | 34 | −28 | −17 | 4.35 | |
| 36 | 30 | −37 | −8 | 3.87 | ||
| 36 | −30 | −34 | −10 | 5.39 | ||
| 36 | −44 | −7 | −13 | 3.50 | ||
| 35 | 20 | −26 | −14 | 5.00 | ||
| 35 | −20 | −22 | −16 | 4.34 | ||
| 27 | 10 | −37 | −2 | 4.30 | ||
| Parahippocampal gyrus/amygdala (L) | −26 | −1 | −17 | 4.82 | ||
| Precuneus/posterior cingulate (C) | 23 | 0 | −59 | 20 | 4.25 | |
| Culmen (R) | 20 | −40 | −17 | 4.67 | ||
| Putamen (L) | −14 | 5 | −10 | 6.18 | ||
| VSs > VSi | ||||||
| Inferior/middle frontal gyrus (L) | 46/10 | −42 | 47 | 1 | 4.59 | |
| Thalamus (L) | −2 | −7 | 13 | 4.81 | ||
| Caudate (L) | −8 | 16 | 3 | 6.93 | ||
Note: List of the brain regions resulting significantly correlated with right VSi and VSs when the 2 seeds were directly compared. (|Z| > 3.1; cluster significance: P < 0.01, corrected). R: Right; L: Left; Z: Z score of peak of activation.
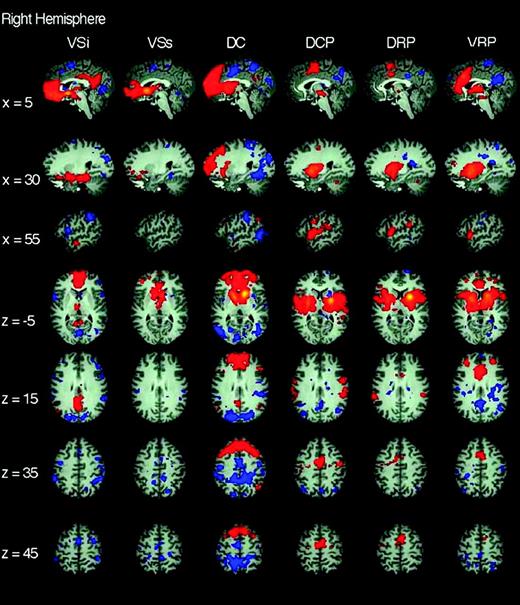
Functional connectivity of right hemisphere striatal seeds. Pattern of significantly positive (red) and negative (blue) relationships for right VSi (x = 9, y = 9, z = −8), VSs (x = 10, y = 15, z = 0), DC (x = 13, y = 15, z = 9), DCP (x = 28, y = 1, z = 3), DRP (x = 25, y = 8, z = 6), and VRP (x = 20, y = 12, z = −3), from left to right columns, respectively (Z score > |3.1|, cluster significance: P < 0.01, corrected). The 1st 3 rows are sagittal views (at x = 5, 30, and 55 from top to bottom, respectively), the last 4 rows are axial views (at z = −5, 15, 35, 45 from top to bottom, respectively). See text for details.
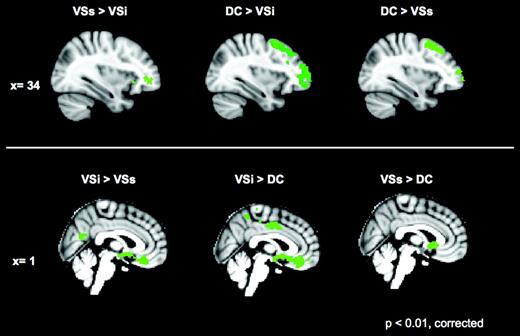
Direct comparisons for caudate seeds. The 1st 2 columns depict comparisons of the VSi with DC and VSs. The 3rd column represents the comparison between DC and VSs. The top row shows the regions in which the 1st seed has significantly greater positive correlations than the 2nd seed tested at x = 34. The lower row shows the reverse comparisons at x = 0. Z score > |3.1|; cluster significance: P < 0.01, corrected. See text for details.
Though present in both hemispheres, the VSs relationships described above were more extensive for the left hemisphere. Otherwise, no substantial hemispheric differences were noted for the VSi and VSs seeds (see Supplementary Fig. 5 and Supplementary Tables 1 and 2).
Dorsal Caudate
Consistent with models emphasizing the involvement of dorsal caudate in cognitive control (Alexander et al. 1986; Cavada and Goldman-Rakic 1991; Parent and Hazrati 1995), the dorsal caudate predicted activity bilaterally in DLPFC, ventral lateral prefrontal cortex (BA 47), ACC (BA 32), and parietal association areas (inferior parietal lobule, BA 40). Furthermore, the dorsal caudate seed predicted activity in the frontal eye field (BA 8), supporting its location within the oculomotor loop described by Alexander et al. (1986). Unlike the more inferior ventral striatal seeds, the dorsal caudate seed did not display connectivity with limbic circuits implicated in affective processes (see Fig. 3 and Table 2). When compared directly with VSi, the dorsal caudate seed was more highly correlated with the aforementioned regions implicated in cognitive control, as opposed to the greater correlations found between VSi and ventral medial prefrontal, cingulate cortices, and limbic regions (see Fig. 4 and Table 4). The direct comparison of DC versus VSs showed greater correlation of DC with dorsal lateral prefrontal regions (see Fig. 4 and Table 4). There were no relevant hemispheric differences with respect to the DC seed (see Supplementary Tables 2 and 3).
Direct comparisons: right DC versus right VSi and versus right VSs
| Contrast | Region | BA | Talairach | Z | ||
| x | y | z | ||||
| DC > VSi | ||||||
| Superior frontal gyrus (R and L) | 8 | 16 | 32 | 52 | 5.46 | |
| 8 | −8 | 51 | 38 | 5.24 | ||
| 8 | 20 | 43 | 38 | 4.75 | ||
| 10 | 16 | 56 | 19 | 5.30 | ||
| 10 | 30 | 62 | −3 | 4.93 | ||
| 10 | −34 | 56 | −3 | 4.98 | ||
| 10 | −22 | 52 | 20 | 4.88 | ||
| 6 | −20 | 26 | 54 | 5.09 | ||
| Middle/superior frontal gyrus (R) | 6 | 34 | 14 | 49 | 5.73 | |
| Middle frontal gyrus (R and L) | 9 | 42 | 31 | 33 | 5.14 | |
| 9 | −44 | 27 | 37 | 5.53 | ||
| 10 | 32 | 57 | 8 | 5.09 | ||
| 10 | 22 | 67 | 8 | 4.86 | ||
| 10 | 38 | 44 | −9 | 4.27 | ||
| 10 | −40 | 50 | −14 | 4.22 | ||
| 4 | −48 | 12 | 40 | 5.30 | ||
| 46 | 46 | 32 | 20 | 5.36 | ||
| 8 | −34 | 14 | 53 | 4.74 | ||
| Inferior frontal gyrus (R and L) | 45 | 54 | 20 | 12 | 4.63 | |
| Medial frontal gyrus (C and R and L) | 8 | 2 | 27 | 41 | 5.54 | |
| 9 | 0 | 49 | 36 | 5.35 | ||
| 9 | −2 | 56 | 19 | 4.00 | ||
| Inferior parietal lobule (R and L) | 40 | 50 | −58 | 43 | 4.29 | |
| 40 | −58 | −53 | 41 | 4.80 | ||
| Caudate (L) | −14 | 14 | 7 | 7.50 | ||
| VSi > DC | ||||||
| Middle frontal gyrus (R) | 11 | 26 | 35 | −12 | 3.81 | |
| Rectal gyrus (R) | 11 | 6 | 34 | −20 | 4.81 | |
| Insula (R) | 13 | 38 | 9 | −7 | 4.02 | |
| Anterior cingulate (R and L) | 25 | 6 | 9 | −7 | 10.15 | |
| 32 | 6 | 48 | −14 | 4.01 | ||
| 32 | −10 | 36 | −15 | 5.39 | ||
| Cingulate gyrus (R and L) | 24 | 6 | −16 | 39 | 4.62 | |
| 24 | −6 | −6 | 37 | 4.78 | ||
| Posterior cingulate (R and L) | 30 | 6 | −39 | 2 | 4.17 | |
| Parahippocampal gyrus (R and L) | 28 | 20 | −18 | −14 | 5.29 | |
| 28 | −24 | −22 | −12 | 4.53 | ||
| 36 | −24 | −43 | −11 | 4.20 | ||
| 36 | −34 | −32 | −22 | 4.73 | ||
| Uncus (R and L) | 28 | 22 | −5 | −30 | 4.10 | |
| 20 | −28 | 2 | −30 | 4.82 | ||
| Lingual gyrus (R) | 19 | 10 | −51 | 3 | 4.23 | |
| Amygdala (L) | −28 | −1 | −15 | 5.10 | ||
| Thalamus (L) | −10 | 7 | −9 | 6.53 | ||
| Declive (L) | −32 | −59 | −14 | 4.21 | ||
| Culmen (L) | −38 | −42 | −21 | 4.24 | ||
| DC > VSs | ||||||
| Superior frontal gyrus (R and L) | 10 | 20 | 67 | 10 | 5.60 | |
| 10 | 30 | 62 | −3 | 4.28 | ||
| 9 | 4 | 50 | 31 | 5.34 | ||
| 8 | −16 | 28 | 48 | 4.49 | ||
| 6 | −4 | 20 | 54 | 4.14 | ||
| Middle frontal gyrus (R and L) | 8 | 34 | 33 | 39 | 5.22 | |
| 8 | −42 | 27 | 35 | 3.92 | ||
| 9 | −48 | 15 | 36 | 4.46 | ||
| 9 | −20 | 54 | 27 | 5.34 | ||
| 9 | 42 | 16 | 40 | 5.03 | ||
| Medial frontal gyrus (L) | 10 | −2 | 53 | 5 | 5.15 | |
| 8 | −6 | 45 | 40 | 5.35 | ||
| Supramarginal gyrus (R) | 40 | 52 | −53 | 32 | 4.89 | |
| Anterior cingulate (L) | 32 | −12 | 37 | 7 | 3.68 | |
| Thalamus (L) | −14 | −17 | 17 | 4.61 | ||
| Caudate (L) | −14 | 3 | 13 | 13.70 | ||
Note: List of the brain regions resulting significantly correlated with right DC, Vsi, or VSs when these seeds were directly compared VSs > DC comparison resulted in no differences with this statistical threshold. (|Z| > 3.1; cluster significance P < 0.01, corrected). R: Right; L: Left; Z: Z score of peak of activation.
Putamen
In contrast to the pattern of results observed among the caudate seeds, the putamen seeds predicted activity in primary and secondary cortical motor areas, as supported by direct statistical comparison when we combined the 3 caudate seeds (VSi, VSs, DC) versus the 3 putamen seeds (DCP, DRP, VRP) combined (see Supplementary Fig. 6 as well as Table 5 and Supplementary Table 4 for the right and left seeds, respectively). This finding is consistent with the known involvement of putamen in motor function. In addition, the putamen seeds predicted activity in areas linked to executive control, such as DLPFC and rostral ACC.
Direct comparisons: right caudate versus putamen
| Contrast | Region | BA | Talairach | Z | ||
| x | y | z | ||||
| Caudate > putamen | ||||||
| Superior frontal gyrus (R and L) | 10 | 12 | 66 | 0 | 6.79 | |
| 10 | −22 | 66 | −1 | 5.86 | ||
| 10 | −18 | 63 | 15 | 5.59 | ||
| 8 | 22 | 29 | 43 | 4.87 | ||
| 8 | −20 | 37 | 39 | 4.45 | ||
| 9 | 18 | 43 | 38 | 4.37 | ||
| Middle frontal gyrus (R and L) | 10 | 38 | 54 | −13 | 5.32 | |
| 8 | 46 | −11 | −20 | 4.96 | ||
| 8 | −30 | 27 | 43 | 4.79 | ||
| 8 | −24 | 25 | 34 | 4.83 | ||
| 10 | −38 | 56 | −5 | 4.71 | ||
| 9 | −2 | 42 | −17 | 6.74 | ||
| Inferior frontal gyrus (R) | 11 | 26 | 26 | −20 | 4.68 | |
| Medial frontal gyrus (R and L) | 6 | 12 | 31 | 35 | 4.38 | |
| 9 | 6 | 44 | 14 | 5.03 | ||
| 9 | −6 | 52 | −18 | 6.64 | ||
| 10 | −12 | 42 | −14 | 6.39 | ||
| 10 | −2 | 63 | 2 | 6.91 | ||
| 9 | −20 | 37 | 29 | 4.35 | ||
| Inferior parietal lobule (L) | 39 | −44 | −66 | 42 | 5.83 | |
| Precuneus (C) | 7 | 0 | −62 | 40 | 5.35 | |
| Anterior cingulate gyrus (L) | 32 | −10 | 29 | −13 | 6.59 | |
| Posterior cingulate gyrus (C and R) | 31 | 0 | −33 | 35 | 5.97 | |
| 29 | 4 | −52 | 15 | 4.85 | ||
| Middle temporal gyrus (R and L) | 21 | 58 | −3 | −23 | 6.01 | |
| 21 | −68 | −28 | −10 | 5.11 | ||
| 20 | −48 | −5 | −23 | 5.00 | ||
| 42 | −64 | −10 | −13 | 5.81 | ||
| Inferior temporal gyrus (R) | 20 | 54 | −22 | −16 | 5.44 | |
| Parahippocampal gyrus (R) | 36 | −18 | −16 | 4.59 | ||
| Angular gyrus (R and L) | 39 | 48 | −66 | 36 | 5.44 | |
| 39 | −48 | −67 | 31 | 5.76 | ||
| Caudate (R and L) | 6 | 14 | −2 | |||
| −6 | 8 | −4 | 7.61 | |||
| −10 | 18 | −1 | 7.53 | |||
| Putamen > caudate | ||||||
| Precentral gyrus (R and L) | 6 | 44 | −8 | 37 | 5.65 | |
| 6 | −42 | −8 | 41 | 5.63 | ||
| Inferior frontal gyrus (R and L) | 9 | 44 | 3 | 29 | 5.64 | |
| 46 | 46 | 35 | 0 | 5.04 | ||
| 45 | −52 | 28 | 6 | 4.15 | ||
| Medial frontal gyrus (R and L) | 6 | 14 | −3 | 61 | 5.44 | |
| 6 | −6 | −5 | 61 | 4.91 | ||
| 8 | −12 | −29 | 44 | 5.05 | ||
| Insula (R and L) | 13 | −46 | 12 | −4 | 7.17 | |
| Inferior parietal lobule (R and L) | 40 | 60 | −32 | 24 | 6.01 | |
| 40 | −66 | −37 | 31 | 6.13 | ||
| 40 | −64 | −24 | 23 | 6.26 | ||
| Anterior cingulate gyrus (R and L) | 32 | 6 | 10 | 40 | 6.43 | |
| 24 | −10 | 4 | 42 | 6.72 | ||
| Superior temporal gyrus (R and L) | 22 | 54 | 8 | 0 | 7.10 | |
| 22 | −66 | −34 | 20 | 5.97 | ||
| 22 | −60 | 0 | 4 | 6.20 | ||
| Thalamus (R) | 10 | −23 | 1 | 6.37 | ||
| Declive (R and L) | 16 | −59 | −11 | 4.41 | ||
| −12 | −73 | −11 | 5.36 | |||
| Putamen (R and L) | 18 | 12 | −2 | 12.66 | ||
| −30 | −13 | 4 | 8.14 | |||
| −28 | 6 | 3 | 8.01 | |||
Note: List of the brain regions resulting significantly correlated with the right caudate seeds combined (VSi + VSs + dorsal caudate) and the right putamen seeds combined (DCP + DRP + VRP) when these were directly compared. (|Z| > 3.1; cluster significance P < 0.01, corrected). R: Right; L: Left; Z: Z score of peak of activation.
Dorsal Caudal Putamen and Dorsal Rostral Putamen
The right DCP seed positively correlated with sensori-motor areas including primary and supplementary motor cortex (BA 4 and BA 6), and caudal ACC (BA 32 and BA 24). Similarly, the right dorsal rostral putamen seed predicted activity within secondary motor areas such as supplementary motor areas (BA 6) and ACC (BA 32 and 24) (see Fig. 3 and Table 6). Direct comparisons of DCP versus DRP showed greater correlations between DCP and premotor cortices (BA 6) in the right hemisphere (left hemisphere differences were subthreshold); DRP had greater correlation with dorsal ACC when compared with DCP in the left hemisphere (right hemisphere differences were subthreshold) (see Table 7 and Supplementary Table 5 for direct comparisons of the right and left seeds, respectively). Beside the aforementioned differences, there were no substantial differences between the right and left seeds (see Supplementary Fig. 5 and Supplementary Table 6 for positive relationships with the left hemisphere seeds).
Positive relationships of right putamen seeds
| Seed | Region | BA | Talairach | Z | ||
| x | y | z | ||||
| DCP | ||||||
| Precentral gyrus (R and L) | 6 | −50 | −9 | 50 | 3.77 | |
| 6 | −52 | −6 | 6 | 5.17 | ||
| 4 | 48 | −6 | 43 | 5.06 | ||
| 4 | −48 | −10 | 36 | 4.66 | ||
| 4 | −30 | −15 | 50 | 3.72 | ||
| Postcentral gyrus (L) | 40 | −60 | −19 | 18 | 5.90 | |
| Anterior cingulate gyrus (R and L) | 24 | 10 | 0 | 44 | 4.96 | |
| 32 | 4 | 10 | 42 | 5.29 | ||
| 32 | −6 | 8 | 46 | 6.03 | ||
| Superior temporal gyrus (R and L) | 22 | 50 | 2 | 2 | 6.84 | |
| 22 | −64 | −40 | 17 | 4.17 | ||
| Middle temporal gyrus (L) | 37 | −48 | −50 | 4 | 4.87 | |
| Lentiform nucleus (L) | −28 | −8 | 6 | 8.69 | ||
| Thalamus (L) | −12 | −21 | 1 | 6.27 | ||
| DRP | ||||||
| Superior frontal gyrus (R) | 6 | 4 | 11 | 57 | 4.91 | |
| Middle frontal gyrus (L) | 6 | −32 | −5 | 46 | 3.62 | |
| Inferior parietal lobule (R and L) | 40 | −58 | −36 | 24 | 4.90 | |
| 40 | 52 | −30 | 25 | 4.08 | ||
| Superior temporal gyrus (L) | 22 | −56 | 8 | 1 | 4.89 | |
| Anterior cingulate gyrus (R and L) | 24 | 4 | 9 | 33 | 4.88 | |
| 32 | −8 | 11 | 34 | 4.68 | ||
| Lentiform nucleus (L) | −30 | −2 | 7 | 6.95 | ||
| −28 | 0 | −8 | 6.79 | |||
| Thalamus (L) | −6 | −14 | −1 | 4.04 | ||
| VRP | ||||||
| Superior frontal gyrus (R) | 10 | 28 | 46 | 23 | 4.98 | |
| 6 | 20 | 15 | 58 | 4.44 | ||
| Precentral gyrus (L) | 44 | −62 | 8 | 10 | 3.07 | |
| Middle frontal gyrus (R and L) | 10 | −34 | 42 | 22 | 4.74 | |
| 10 | 38 | 47 | 11 | 3.92 | ||
| 11 | −28 | 46 | −11 | 3.83 | ||
| Insula (R and L) | 13 | −44 | 12 | 3 | 6.72 | |
| 13 | 44 | 14 | −2 | 5.72 | ||
| Anterior cingulate gyrus (R and L) | 32 | 2 | 25 | 30 | 7.48 | |
| 24 | −6 | 35 | 7 | 5.58 | ||
| Lentiform nucleus (L) | −20 | 4 | 11 | 8.60 | ||
| −20 | 12 | −4 | 8.32 | |||
Note: List of the brain regions showing a significant (|Z| > 3.1; cluster significance P < 0.01, corrected) positive relationship with the right DCP (x = 28, y = 1, z = 3), DRP (x = 25, y = 8, z = 6), and VRP seeds (x = 20, y = 12, z = −3). L: left; R: right; Z: Z score of peak of activation.
Right direct comparisons: putamen seeds
| Contrast | Region | BA | Talairach | Z | ||
| x | y | z | ||||
| VRP > (DCP + DRP) | ||||||
| Superior frontal gyrus (R) | 10 | 14 | 64 | 0 | 4.18 | |
| Middle frontal gyrus (R) | 10 | 34 | 52 | −9 | 3.93 | |
| Medial frontal gyrus (R and L) | 10 | 18 | 51 | 7 | 4.39 | |
| 10 | −10 | 59 | 3 | 5.01 | ||
| Anterior cingulate (R and L) | 32 | 8 | 42 | −9 | 4.67 | |
| 32 | −8 | 28 | 23 | 4.68 | ||
| 32 | 8 | 27 | 28 | 5.07 | ||
| 24 | −8 | 37 | 6 | 4.58 | ||
| 24 | −2 | 22 | 14 | 4.28 | ||
| Putamen (L) | −18 | 11 | −9 | 7.28 | ||
| (DCP + DRP) > VRP | ||||||
| Superior frontal gyrus (R) | 6 | 14 | −12 | 65 | 3.61 | |
| Precentral gyrus (R and L) | 6 | 54 | 0 | 30 | 4.98 | |
| 6 | 44 | −10 | 37 | 4.36 | ||
| 4 | 58 | −18 | 40 | 4.66 | ||
| Medial frontal gyrus (R and L) | 6 | 4 | −3 | 54 | 4.87 | |
| 6 | −2 | −13 | 60 | 4.67 | ||
| Postcentral gyrus (R and L) | 43 | 64 | −17 | 14 | 4.71 | |
| 3 | −54 | −18 | 25 | 4.34 | ||
| 8 | −46 | −19 | 45 | 4.86 | ||
| Anterior cingulate gyrus (L) | 24 | −10 | −3 | 48 | 4.26 | |
| Superior temporal gyrus (R) | 22 | 58 | −36 | 13 | 3.59 | |
| Middle temporal gyrus (R) | 46 | 50 | −54 | 6 | 4.73 | |
| Transverse temporal gyrus (L) | 41 | −38 | −23 | 12 | 4.98 | |
| Putamen (R and L) | 26 | 6 | 5 | 8.64 | ||
| 28 | −15 | 4 | 4.98 | |||
| −32 | −14 | 1 | 4.09 | |||
| DCP > DRP | ||||||
| Precentral gyrus (R) | 6 | 59 | −2 | 28 | 4.42 | |
| 6 | 54 | −2 | 12 | 3.67 | ||
Note: List of the brain regions resulting significantly correlated with the right VRP and the 2 right dorsal putamen seeds combined (DCP + DRP) when these seeds were directly compared. The DRP > DCP comparisons resulted in no differences at this statistical threshold. (|Z| > 3.1; cluster significance P < 0.01, corrected). R: right; L: left; Z: Z score of peak of activation.
Ventral Rostral Putamen
The ventral rostral putamen seed positively correlated with rostral portions of ACC (BA 32 and BA 24) and DLPFC (BA 10) commonly associated with conflict monitoring and error-related processes (Carter et al. 1998; van Veen et al. 2001; Bush et al. 2002; Botvinick et al. 2004; Ullsperger and von Cramon 2004) (see Fig. 3 and Table 6). Further, the ventral rostral seed predicted activation of insula cortex (BA 13). Results from the direct comparisons between the ventral rostral and the 2 dorsal putamenal seeds supported the greater correlation of the DLPFC and rostral ACC with the ventral rostral putamen (see Table 7 and Supplementary Fig. 7). With the exception of a positive relationship with the anterior lobule of the cerebellar vermis (culmen, lobule V) for the left but not the right ventral rostral seed, there were no substantial laterality differences between the putamen seeds (see Supplementary Tables 5 and 6).
Negative Relationships
We observed a number of networks negatively correlated with our basal ganglia seeds. In other words, increases in a seed region's activity predicted decreases in the negatively related region's activity. Interestingly, as depicted in Figure 5, caudate seeds were negatively correlated with some of the same areas that were positively related to the putamen seeds (e.g., supplementary and primary motor areas, and portions of dorsal ACC). Similarly, the putamen seeds were negatively correlated with some of the same areas that were positively correlated with the caudate seeds (e.g., ventromedial prefrontal cortex, precuneus). Such a distinction in connectivity between putamen and caudate seeds mirrors the differential roles in motor and affective processing commonly attributed to these regions.
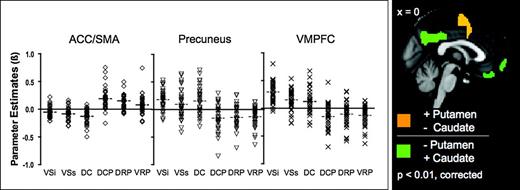
Brain regions correlated with both putamen and caudate but in opposite directions. On the left panel the scatter plots represent the mean parameter estimates (regression coefficients) of striatal seed connectivity (VSi, VSs, DC, DCP, DRP, and VRP, from left to right, respectively) with ACC/supplementary motor area (SMA), precuneus, and with ventromedial prefrontal cortex (VMPFC), from the left to right, respectively. Outlier β values not included in the scatter plot were as follow: β = 1.07 and −1.30 for DRP connectivity with ACC/SMA and precuneus, respectively; β = −1.11 for DCP connectivity with VMPFC. On the right panel the brain regions exhibiting positive correlations with the putamen seeds (i.e., DCP + DRP + VRP) but negative correlation with caudate seeds (i.e., VSi + VSs + DC) and vice versa (orange and green, respectively) are shown.
Ventral Striatum and Dorsal Caudate
Ventral striatal regions (VSi and VSs) exhibited a distributed pattern of negative relationships with superior parietal regions commonly associated with spatial and temporal attentional selection (Fernandez-Duque et al. 2000; Coull et al. 2003; Nobre et al. 2004; Lepsien and Nobre 2006), occipital cortices and portions of the superior temporal, dorsolateral prefrontal cortices associated with cognitive control (Badgaiyan 2000; Banich et al. 2000; MacDonald et al. 2000; Casey et al. 2000; Andres 2003; Milham et al. 2003). Results corresponding to the right hemisphere seeds are shown in Figure 3 and Table 8. In contrast to VSi, DC showed greater negative correlations with precuneus, posterior cingulate, occipital cortices, and the cerebellar culmen. The differences in the pattern of negative correlations between VSs and VSi did not remain significant after full brain statistical correction. The pattern of negative relationships in the VSi, VSs, and dorsal caudate was not substantially different in the left hemisphere seeds (see Supplementary Fig, 5 and Supplementary Table 7).
Negative relationships of right striatal and dorsal caudate seeds
| Seed | Region | BA | Talairach | Z | ||
| x | y | z | ||||
| VSi | ||||||
| Superior frontal gyrus (R) | 9 | 38 | 51 | 16 | 5.32 | |
| Middle frontal gyrus (R and L) | 46 | 46 | 38 | 20 | 4.86 | |
| 8 | 48 | 12 | 38 | 4.71 | ||
| Precentral gyrus (R) | 6 | −60 | −17 | 43 | 4.60 | |
| 6 | −46 | −3 | 48 | 4.61 | ||
| 6 | −60 | 5 | 29 | 4.19 | ||
| Medial frontal gyrus | 6 | −4 | 1 | 57 | 4.02 | |
| Inferior frontal gyrus (L) | 45 | 58 | 13 | 21 | 5.85 | |
| 46 | 50 | 39 | 2 | 4.23 | ||
| Postcentral gyrus (R) | 4 | 60 | −17 | 43 | 4.60 | |
| Supramarginal gyrus (L) | 40 | −62 | −47 | 39 | 4.66 | |
| Inferior parietal lobule (R) | 40 | 64 | −36 | 28 | 4.51 | |
| 40 | 52 | −36 | 52 | 4.81 | ||
| Precuneus (R) | 7 | 22 | −63 | 34 | 4.66 | |
| Middle temporal gyrus (L) | 39 | −46 | −73 | 13 | 4.77 | |
| Superior temporal gyrus (L) | 22 | −58 | −38 | 15 | 4.18 | |
| Cuneus (R and L) | 17 | −6 | −89 | 8 | 4.11 | |
| 18 | 12 | −87 | 23 | 5.09 | ||
| 18 | −2 | −76 | 9 | 4.15 | ||
| 18 | −8 | −88 | 28 | 4.50 | ||
| Lingual gyrus (L) | 18 | −14 | −70 | −3 | 4.10 | |
| 18 | −28 | −72 | −5 | 3.85 | ||
| Cerebellar culmen (R) | 10 | −65 | −5 | 4.45 | ||
| VSs | ||||||
| Inferior frontal gyrus (R) | 45 | 58 | 12 | 24 | 5.85 | |
| 46 | 50 | 40 | 4 | 4.23 | ||
| 44 | −60 | 12 | 6 | 4.69 | ||
| Middle frontal gyrus (R and L) | 8 | 48 | 10 | 42 | 4.71 | |
| 10 | 38 | 52 | 20 | 5.32 | ||
| Precentral gyrus (L) | 6 | −46 | −6 | 52 | 4.61 | |
| 6 | −60 | 4 | 32 | 4.19 | ||
| Medial frontal gyrus (L) | 6 | −4 | −2 | 62 | 4.03 | |
| Inferior parietal lobule (R and L) | 40 | 52 | −40 | 54 | 4.81 | |
| 40 | 64 | −38 | 28 | 4.51 | ||
| 40 | −62 | −50 | 40 | 4.66 | ||
| Postcentral gyrus (R) | 3 | 22 | −30 | 66 | 4.33 | |
| 2 | 60 | −20 | 46 | 4.60 | ||
| Precuneus (R) | 7 | 22 | −66 | 34 | 4.66 | |
| Cuneus (R and L) | 19 | −28 | −84 | 30 | 4.22 | |
| 18 | 12 | −90 | 20 | 5.09 | ||
| 19 | −6 | −92 | 4 | 4.11 | ||
| Lingual gyrus (L) | 18 | −8 | −92 | 26 | 4.50 | |
| 18 | −2 | −78 | 6 | 4.15 | ||
| 19 | −28 | −74 | −10 | 3.85 | ||
| Cerebellar culmen (R) | 10 | −66 | −10 | 4.45 | ||
| DC | ||||||
| Precentral gyrus (R and L) | 6 | −44 | −12 | 41 | 4.56 | |
| 6 | 32 | −18 | 65 | 3.99 | ||
| Postcentral gyrus (L) | 5 | −56 | −27 | 40 | 4.84 | |
| Insula (L) | 13 | −38 | 0 | 6 | 3.69 | |
| Inferior parietal lobule (R) | 40 | 52 | −30 | 33 | 4.79 | |
| 40 | −66 | −32 | 22 | 3.94 | ||
| Precuneus (R and L) | 7 | −20 | −80 | 39 | 5.94 | |
| 7 | 12 | −78 | 46 | 3.65 | ||
| Posterior cingulate | 31 | −8 | −42 | 48 | 6.11 | |
| 31 | 16 | −64 | 16 | 4.41 | ||
| Mid cingulate gyrus | 24 | −10 | −8 | 35 | 4.68 | |
| 24 | −2 | 4 | 37 | 5.05 | ||
| Anterior cingulate gyrus | 32 | −6 | 16 | 40 | 4.85 | |
| Superior temporal gyrus (R) | 22 | 58 | −4 | −4 | 4.98 | |
| Middle temporal gyrus (R) | 37 | −48 | −68 | 13 | 5.42 | |
| 39 | 42 | −58 | 7 | 5.00 | ||
| Lingual gyrus (L) | 18 | −14 | −72 | −1 | 5.06 | |
| Cuneus (R and L) | 18 | −22 | −68 | 14 | 3.61 | |
| 19 | −10 | −78 | 32 | 6.12 | ||
| 18 | 24 | −82 | 32 | 4.59 | ||
Note: List of the brain regions showing a significant (|Z| > 3.1; cluster significance P < 0.01, corrected) negative relationship with the right VSi (x = 9, y = 9, z = −8), VSs (x = 10, y = 15, z = 0), and DC seeds (x = 13, y = 15, z = 9). L: left; R: right; Z: Z score of peak of activation.
Putamen
All 3 putamen seeds were negatively related with posterior medial default-mode network regions that were positively correlated with the inferior ventral striatal seed (e.g., posterior cingulate cortex and precuneus); see Figure 3 and Table 9 for the right hemisphere seed negative relationships. Although this pattern was qualitatively strongest for the ventral rostral putamen seed, the 3 putamen seeds did not differ significantly from each other. There were no substantial hemispheric differences with respect to putamen negative relationships (see Supplementary Fig. 5 and Supplementary Table 8 for the left hemisphere seed negative relationships).
Negative relationships of right putamen seeds
| Seed | Region | BA | Talairach | Z | ||
| x | y | z | ||||
| DCP | ||||||
| Superior frontal gyrus (R) | 9 | 2 | 54 | 25 | 4.10 | |
| Posterior cingulate (L) | 31 | −10 | −45 | 34 | 3.61 | |
| Precuneus | 7/31 | −8 | −63 | 31 | 4.28 | |
| Superior parietal lobule | 7 | −38 | −64 | 51 | 4.06 | |
| Inferior parietal lobule | 40 | −50 | −60 | 44 | 4.18 | |
| Angular gyrus (L) | 39 | −34 | −74 | 31 | 4.13 | |
| Putamen (R) | 22 | 10 | 7 | 9.07 | ||
| DRP | ||||||
| Inferior parietal lobule | 40 | 34 | −55 | 34 | 4.18 | |
| Posterior cingulate gyrus (L) | 31 | 2 | −31 | 35 | 4.81 | |
| VRP | ||||||
| Medial frontal gyrus (R) | 6 | 6 | −26 | 66 | 3.92 | |
| Precentral gyrus (R) | 4 | 50 | −14 | 38 | 4.52 | |
| 6 | 40 | −6 | 26 | 4.32 | ||
| 4 | −18 | −26 | 66 | 3.99 | ||
| Paracentral lobule (R) | 5 | 4 | −42 | 61 | 3.79 | |
| Superior parietal lobule (L) | 7 | 22 | −59 | 62 | 4.05 | |
| Postcentral gyrus (L) | 3 | −30 | −31 | 48 | 5.66 | |
| 5 | 22 | −36 | 63 | 4.32 | ||
| Precuneus (R and L) | 7/31 | 6 | −65 | 24 | 4.73 | |
| 7 | −24 | −52 | 51 | 4.46 | ||
| Posterior cingulate gyrus (L) | 31 | −4 | −45 | 32 | 4.34 | |
| Parahippocampal gyrus (L) | 37 | 32 | −43 | −3 | 4.56 | |
Note: List of the brain regions showing a significant (|Z| > 3.1; cluster significance P < 0.01, corrected) negative relationship with right DCP (x = 28, y = 1, z = 3), DRP (x = 25; y = 8, z = 6), and VRP seeds (x = 20, y = 12, z = −3). L: Left; R: Right; Z: z statistic of peak of activation.
Discussion
This resting state study of 35 healthy individuals provides a comprehensive examination of functional connectivity of the human striatum, revealing distinct neural circuits associated with each of the 6 striatal subregions we examined. Our results are consistent with a recent meta-analysis of 126 task-based functional studies (Postuma and Dagher 2006) while confirming the existence of hypothesized relationships between ventral striatum seeds and OFC, which could not be discerned in the meta-analysis. As hypothesized, our findings highlight the intimate relationship between ventral striatum and OFC, suggesting a potential differentiation in OFC connectivity between superior and inferior portions of the ventral striatum. Specifically, although the most inferior seed (VSi), placed in the proximity of nucleus accumbens, was primarily associated with medial portions of OFC, the intermediately placed VSs seed was associated with more lateral portions of OFC. These findings are in agreement with the nonhuman primate literature showing that medial OFC areas project to ventromedial limbic striatal areas, whereas lateral OFC components project to more dorsolateral parts of the striatum (Ferry et al. 2000). In addition, these data are consistent with human fMRI studies demonstrating that medial and lateral OFC functions are dissociable (Elliott et al. 2000a).
Consistent with models positing a cognitive/affective division between dorsal and ventral striatum (Selemon and Goldman-Rakic 1985; O'Doherty et al. 2004; Reiss et al. 2005), we found a dorsal/ventral distinction in caudate connectivity, though with a more gradual transition than previously appreciated in human studies. Specifically, although the most dorsal caudate seed was primarily associated with DLPFC and other cognitive control regions, and the most inferior caudate seed (VSi) was primarily associated with limbic areas, the intermediate seed (VSs) was associated with both cognitive control and limbic areas. Thus, at the macro-level of analysis observable with fMRI, our data are consistent with models positing that information is transferred along a ventral to dorsal gradient via circuits that spiral from emotional/motivational areas to decision making/executive control areas and then to motor control areas (Haber et al. 2000; Haber 2003).
As predicted by models positing the existence of motor and cognitive/association subdivisions of putamen (Parent and Hazrati 1995), as well as the findings of Postuma and Dagher (2006), we also found evidence for a putamenal rostral/caudal distinction. The 2 caudal putamen seeds were significantly correlated with primary and supplementary motor cortices, whereas the rostral putamen seed revealed patterns of connectivity with frontal regions implicated in executive function control. Our data also provide support for Postuma and Dagher's (2006) finding of putamen connectivity with the insula, specifically in the ventral rostral putamen.
Similar to our examination of ACC subregions (Margulies et al. 2007), we also found strongly negative as well as positive correlations with distinct antiphase networks for each striatal seed region. That is, the spontaneous signal fluctuations in such negatively correlated networks are 180° out of phase with the fluctuations observed in the corresponding seed region. Although the significance of such antiphase relationships remains unclear, a defensible generalization seems to be that they arise between functional systems with apparently opposite goals or functions (Greicius et al. 2003; Fox et al. 2005; Margulies et al. 2007; Fransson 2005; Kelly et al. 2008). Consistent with this notion, spontaneous fluctuations in seed regions implicated in affective processing (e.g., VSi) were generally in antiphase relationship with fluctuations in regions involved in cognitive and/or motor control. Recent work in our lab suggests that such antiphase relationships may be functionally significant. For example, Kelly et al. (2008) showed that individual differences in behavioral variability during a flanker task were strongly correlated with individual differences in the magnitude of the coupling of the antiphase relationships between the default-mode network and its anticorrelated frontal–parietal task-positive network (whether observed during rest or task performance). The mechanism by which negative correlations arise between networks is unclear (Fox et al. 2005; Fox and Raichle 2007). It is possible that they may reflect antagonistic influences of one network on another, as suggested by granger causality analyses in a recent study of the default-mode network and its antinetworks in our laboratory (Uddin et al. forthcoming). Further exploration of striatal antiphase networks and the possible contributions of compromises in these relationships to behavior, including psychopathology, is merited.
Our cortical–striatal results are fully consistent with estimations of human connectivity from macaque anatomic studies. Specifically, our data are consistent with all 5 classical cortical–striatal loops (Alexander et al. 1986). We found that dorsal putamen is correlated with primary motor and somatosensory cortex and supplementary motor area (Kunzle 1975; Kunzle 1977); that dorsal caudate is correlated with DLPFC (Selemon and Goldman-Rakic 1985; Middleton and Strick 2002; Kelly and Strick 2004), and the frontal eye fields (Kunzle and Akert 1977); that VSs, which is approximately equivalent to ventromedial caudate, is functionally connected to lateral orbitofrontal regions (Ilinsky et al. 1985; Selemon and Goldman-Rakic 1985; Ferry et al. 2000; Haber et al. 2006); and that VSi is significantly correlated with ACC (Powell and Leman 1976; Yeterian and Van Hoesen 1978; Selemon and Goldman-Rakic 1985; Ferry et al. 2000; Haber et al. 1995; Haber et al. 2006). Of note, most of our findings appear to be bilateral, regardless of the hemisphere seeded. Although there has been some controversy in the literature about direct contralateral anatomical thalamic projections (DeVito and Anderson 1982; Fenelon et al. 1990; Parent et al. 1999), contralateral corticostriatal anatomical connections have been described in primates (Arikuni and Kubota 1986) and in a DTI study in humans (Lehericy et al. 2004). Our findings of bilaterality agree with the pattern of striatal coactivation described by Postuma and Dagher (2006). However, they are functional correlations and do not necessarily reflect direct WM connectivity. Ongoing studies combining DTI and functional connectivity fMRI will clarify whether such correlational patterns are supported by direct anatomical connections.
These data provide a framework for the examination of functional connectivity in various clinical disorders. The correlation of the VSi with medial aspects of OFC is of particular clinical interest given the implication of this OFC area (BA 25) in affect regulation and substance abuse. For example, BA 25 is overactive in treatment resistant depression which may be reduced by chronic deep brain stimulation in that location (Mayberg et al. 2005). Volkow et al. (2006) found that nonalcoholic relatives of alcoholics have increased availability of D2 receptors in the ventral striatum and that higher levels of D2 receptors in striatum correlate positively with higher metabolic activity in OFC and ACC, including BA 25. Given the role of both VS and OFC in reward processing (Rolls 2000; Elliott et al. 2000b; Schultz et al. 2000), straightforward quantification of the connectivity of this circuit can increase our understanding of clinical conditions associated with dysregulation of reward mechanisms, such as depression, substance abuse, and ADHD (Epstein et al. 2006; Forbes et al. 2006; Chang et al. 2007; Scheres et al. 2007).
This study has several limitations. First, we only examined functional connectivity during resting state, and the amplitude of resting state network fluctuations is modulated by the transition between task performance and rest (e.g., Fransson 2005; DeLuca et al. 2006; Sridharan et al. 2007). Although the spatiotemporal stability of resting state functional networks is impressive (Damoiseaux et al. 2006), future studies should examine task-related changes in the connectivity of basal ganglia circuits. Second, we limited our analyses to 6 striatal subregions due to the spatial resolution limits on our data acquisition. Future work using higher resolution fMRI will examine the connectivity of other basal ganglia subregions (i.e., globus pallidus internal/external segments, substantia nigra, and thalamic nuclei). Incomplete coverage of the inferior portions of cerebellum prevented us from fully appreciating striatal-cerebellar functional interactions which were observed for superior regions of the cerebellum. Another type of limitation is our lack of understanding of the neuronal and vascular substrates that underlie the remarkable patterns of low frequency temporal coherence (Biswal et al. 1995) which provide the bases for functional connectivity maps (Fox and Raichle 2007). The absence of a plausible model has led to skepticism regarding this approach (Morcom and Fletcher 2006), despite accumulating evidence that it is a robust (Buckner and Carroll 2007), stable (Damoiseaux et al. 2006) and intriguingly revealing technique (Margulies et al. 2007). Finally, similar to prior studies, the present work detected a number of robust negative relationships in spontaneous activity among neural systems with seemingly competing functions. Although intriguing, one concern that arises is the possible contributions of analytical procedures, such as global normalization or orthogonalization, to the presence of such relationships. However, prior work has demonstrated that antiphasic relationships can not be simply attributed to correction for the global signal (Fransson 2005; Uddin et al. forthcoming). Similarly, Margulies et al. (2007) and the present work demonstrated that analytical decisions such as simultaneous regression of multiple seed regions in a single model or orthogonalization are not responsible for detection of such relationships either (see Supplementary Fig. 4). As such, these negative relationships do not appear artifactual in nature and merit future study to elucidate their significance (see Kelly et al. 2008 for an initial effort). In summary, the present work demonstrates the promise of resting state approaches for comprehensively examining basal ganglia circuitry. In a single study during rest lasting less then 7 min per subject, we demonstrated differential patterns of connectivity among 6 striatal subregions along an affective/cognitive/motor axis predicted by contemporary models of basal ganglia function (Middleton and Strick 2000a; Haber 2003), with higher degree of specificity than previously appreciated by a meta-analysis of over 100 human neuroimaging studies. The cost-effectiveness combined with richly detailed results is an unique strength of resting state fMRI, which holds considerable promise for the study of basal ganglia circuitry dysfunction in clinical populations.
Funding
Stavros S. Niarchos Foundation; and the National Alliance for Research on Schizophrenia and Depression.
We are sincerely grateful to the volunteers who participated in this study and wish to thank Dylan Gee for helpful editorial suggestions and 4 anonymous reviewers for their thoughtful comments. Conflict of Interest: None declared.
References
Author notes
A. Di Martino and A. Scheres contributed equally to the manuscript.