


Abstract
Music and speech are complex sound streams with hierarchical rules of temporal organization that become elaborated over time. Here, we use functional magnetic resonance imaging to measure brain activity patterns in 20 right-handed nonmusicians as they listened to natural and temporally reordered musical and speech stimuli matched for familiarity, emotion, and valence. Heart rate variability and mean respiration rates were simultaneously measured and were found not to differ between musical and speech stimuli. Although the same manipulation of temporal structure elicited brain activation level differences of similar magnitude for both music and speech stimuli, multivariate classification analysis revealed distinct spatial patterns of brain responses in the 2 domains. Distributed neuronal populations that included the inferior frontal cortex, the posterior and anterior superior and middle temporal gyri, and the auditory brainstem classified temporal structure manipulations in music and speech with significant levels of accuracy. While agreeing with previous findings that music and speech processing share neural substrates, this work shows that temporal structure in the 2 domains is encoded differently, highlighting a fundamental dissimilarity in how the same neural resources are deployed.
Introduction
Music and speech are human cultural universals (Brown 1991) that manipulate acoustically complex sounds. Because of the ecological and behavioral significance of music and speech in human culture and evolution (Brown et al. 2006; Conard et al. 2009), there is great interest in understanding the extent to which the neural resources deployed for processing music and speech are distinctive or shared (Patel 2003, 2008).
The most substantial of the proposed links between music and language relates to syntax—the rules governing how musical or linguistic elements can be combined and expressed over time (Lerdahl and Jackendoff 1983). Here, we use the term “syntax” as employed in previous brain imaging studies of music (Maess et al. 2001; Levitin and Menon 2003, 2005; Koelsch 2005). In this context, syntax refers to temporal ordering of musical elements within a larger, hierarchical system. That is, the syntax of a musical sequence refers to the specific order in which notes appear, analogous to such structure in language. As in language, the order of elements influences meaning or semantics but is not its sole determinant.
One influential hypothesis—the “shared syntactic integration resource hypothesis” (SSIRH; [Patel 2003])—proposes that syntactic processing for language and music share a common set of neural resources instantiated in prefrontal cortex (PFC). Indirect support of SSIRH has been provided by studies implicating “language” areas of the inferior frontal cortex (IFC) in the processing of tonal and harmonic irregularities (Maess et al. 2001; Koelsch et al. 2002; Janata 2005) and coherent temporal structure in naturalistic musical stimuli (Levitin and Menon 2003). Functional brain imaging studies have implicated distinct subregions of the IFC in speech, with dorsal–posterior regions (pars opercularis and pars triangularis, Brodmann Area [BA] 44 and 45) implicated in both phonological and syntactic processing and ventral–anterior regions (pars opercularis, BA 47) implicated in syntactic and semantic processing (Bookheimer 2002; Grodzinsky and Friederici 2006). Anterior regions of superior temporal cortex have also been implicated in the processing of structural elements of both music and language (Koelsch 2005; Callan et al. 2006). Since most brain imaging studies have used either music or speech stimuli, differential involvement of these neural structures in music and speech processing is at present unclear.
A key goal of our study was to directly test the SSIRH and examine whether distinct or shared neural resources are deployed for processing of syntactic structure in music and speech. Given that the ordering of elements in music and speech represents a fundamental aspect of syntax in these domains, our approach was to examine the neural correlates of temporal structure processing in music and speech using naturalistic, well-matched music and speech stimuli in a within-subjects design. Functional magnetic resonance imaging (fMRI) was used to quantify blood oxygen level–dependent activity patterns in 20 participants while they listened to musical and speech excerpts matched for emotional content, arousal, and familiarity in a within-subjects design. Importantly, each individual stimulus had a temporally reordered counterpart in which brief (∼350 ms) segments of the music and speech stimuli were rearranged within the musical or speech passage, which served as an essential control that preserved many acoustic features but disrupted the overall temporal structure, including the rhythmic properties, of the signal (Fig. 1). Analyses employed both univariate and multivariate pattern analysis (MPA) techniques. The reason for employing these 2 fMRI analysis techniques is that they provide complimentary information regarding the neural substrates underlying cognitive processes (Schwarzlose et al. 2008): univariate methods were used to examine whether particular brain regions show greater magnitude of activation for manipulations to speech or music structure; multivariate methods were used to investigate whether spatial patterns of fMRI activity are sensitive to manipulations to music and speech structure. A novel methodological aspect is the use of a support vector machine (SVM)-based algorithm, along with a multisubject cross-validation procedure, for a robust comparison of decoded neural responses with temporal structure in music and speech.
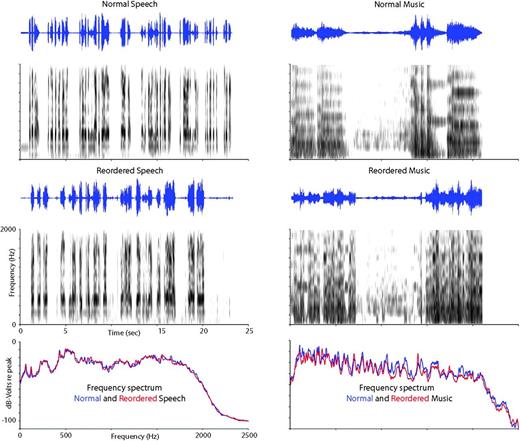
Music and speech stimuli. Examples of normal and reordered speech (left) and music (right) stimuli. The top and middle panels include an oscillogram of the waveform (top) and a sound spectrogram (bottom). Frequency spectra of the normal and reordered stimuli are plotted at the bottom of each side.
Materials and Methods
Participants
Participants were 20 right-handed Stanford University undergraduate and graduate students with no psychiatric or neurological disorders, as assessed by self-report and the SCL-90-R (Derogatis 1992); using adolescent norms are appropriate for nonpatient college students as suggested in a previous study (Todd et al. 1997). All participants were native English speakers and nonmusicians. Following previously used criteria (Morrison et al. 2003), we define nonmusicians as those who have had 2 years or less of participation in an instrumental or choral group and less than 1 year of private musical lessons. The participants received $50 in compensation for participation. The Stanford University School of Medicine Human Subjects committee approved the study, and informed consent was obtained from all participants.
Stimuli
Music stimuli consisted of 3 familiar and 3 unfamiliar symphonic excerpts composed during the classical or romantic period, and speech stimuli were familiar and unfamiliar speeches (e.g., Martin Luther King, President Roosevelt) selected from a compilation of famous speeches of the 20th century (Various 1991; stimuli are listed in Supplementary Table 1). All music and speech stimuli were digitized at 22 050 Hz sampling rate in 16 bit. In a pilot study, a separate group of participants was used to select music and speech samples that were matched for emotional content, attention, memory, subjective interest, level of arousal, and familiarity.
Stimulus Selection
Fifteen undergraduate students who did not participate in the fMRI study used a scale of –4 to 4 to rate the 12 musical excerpts and 24 speech excerpts on 10 different dimensions. These participants were compensated $10 for their time.
The first goal was to obtain a set of 12 speech stimuli that were well matched to the music samples. For each emotion, all the ratings for all the music and speech stimuli, for all subjects, were pooled together in computing the mean and standard deviation used to normalize responses for that emotion. We analyzed the correlations between semantically related pairs of variables, and we found several high correlations among them: for example, ratings of “dissonant” and “happy” were highly correlated, (r = −0.75) indicating that these scales were measuring the same underlying concept. Therefore, we eliminated some redundant categories from further analysis (dissonant/consonant was correlated with angry/peaceful, r = 0.84 and with happy/sad, r = −0.75; tense/relaxed was correlated with angry/peaceful, r = 0.58; annoying/unannoying was correlated with boring/interesting, r = 0.67). We then selected the 12 speeches that most closely matched each of the individual pieces of music on standardized values of the ratings. Correlations between the ratings for the retained speeches and music were all significant (range: r = 0.85, P < 0.04 to r = 0.98, P < 0.001), and independent 2-sample t-tests for the mean values of each yielded no significant difference between the ratings of any of the pairs. Importantly, there were no significant differences between speech and music samples for any emotion when ratings for all music samples were directly compared with speech samples (Supplementary Table 2). Following this, we sought to narrow the sample to only 6 speech and 6 music excerpts (3 familiar and 3 unfamiliar of each) to keep the actual scan session to a manageable length. In order to do this, we performed a least-squares analysis, identifying those pairs of music and speeches that had the smallest difference between them, and thus were most easily comparable. For this analysis, we used the 6 remaining scales (with the exception of familiarity) and calculated the total squared difference between all pairs of familiar and all pairs of unfamiliar music and speeches. We selected the 6 (3 familiar and 3 unfamiliar) music–speech pairs with the least difference between them to be our stimuli (range of total squared difference: 6.8–71.7; range of 6 selected: 6.8–13.6).
Rationale for Stimulus Manipulation
All music and speech stimuli were “scrambled” as a means of altering the rich temporal structure inherent in these signals. Scrambling in this context refers to rearranging brief (<350 ms) segments of music and speech stimuli while controlling for a number of acoustical variables (please see “Stimulus Creation” below for details). The choice for the 350 ms maximum length was found empirically: this length preserved lower level phonetic segments and short words in speech and individual notes in music but disrupted meaningful clusters of words in speech and the continuity of short segments of melody and rhythmic figures in music. Additionally, to minimize the possibility that listeners would hear a pulse or “tactus” in the scrambled versions, we used windows of variable size. We acknowledge that music and speech have inherently different acoustical characteristics and that the ideal time window for scrambling the stimuli is currently unknown. Nevertheless, the value of 350 ms was arrived at after significant evaluation and is well suited as a means of reordering the elements of music and speech while leaving key elements intact.
Stimulus Creation
The scrambling technique used here was based on previously used methods (Levitin and Menon 2003; Koelsch 2005) but included more refined stimulus controls than were present in those studies to better insure the exact acoustic comparability of the stimuli. Specifically, temporal structure manipulations in the current study removed brief “gaps” and loud–soft “transitions” in the reordered stimuli that were audible in these previous studies. Each music and speech excerpt was 22–30 s in length. To create stimuli for the experimental conditions, each file was processed as follows using the SIGNAL Digital Signal Processing Language (Engineering Design). The original digitized file had its DC level set to zero, after which the envelope contour was extracted (absolute value smoothed with a 20 ms window and peak normalized to 1). A copy of the envelope was gated at 0.1 of peak threshold to identify “low-amplitude” time intervals, another copy was gated at 0.2 of peak amplitude to identify “high-amplitude” time intervals, and the rest of the time intervals were classified as “midamplitude.” The lengths of each type of interval were extracted and stored sequentially; lengths were examined for any intervals longer than 350 ms, which were divided into pieces of 350-ms length plus a piece of an appropriate size <350 ms for the remainder. Each of the resulting sequence of amplitude intervals was then assigned an integer number according to its position in the sequence. A pseudorandom reordering of these integers was produced subject to 3 constraints: 2 segments that had previously occurred together were not permitted to do so, the distribution of transitions between segments of different loudness had to be preserved, and the distribution of transitions between segments of different length also had to be preserved in the new ordering. Reordered stimuli were constructed by taking each piece from the original sequence, applying a 5-ms cosine envelope to its edges, and pasting it into its appropriate position in the new sequence as determined by a random number sequence. The speech samples were low-pass filtered at 2400 Hz to remove extraneous high frequencies. To increase the similarities between the original and reordered excerpts, the segments identified in the original versions had 5-ms cosine envelopes applied to their edges in exactly the same way as the reordered versions, thus creating microgaps in any notes held longer than 350 ms.
fMRI Task
Music and speech stimuli were presented in 2 separate runs each lasting about 7 min; the order of runs was randomized across participants. Each run consisted of 12 blocks of alternating original and reordered excerpts, each lasting 23–28 s. The block order and the order of the individual excerpts were counterbalanced across participants. Participants were instructed to press a button on an MRI-compatible button box whenever a sound excerpt ended. Response times were measured from the beginning of the experiment and the beginning of the excerpt. The button box malfunctioned in 8 of the scans and recorded no data but because the main purpose of the button press was to ensure that participants were paying attention, we retained those scans, and they were not statistically different from the other scans. All participants reported listening attentively to the music and speech stimuli. Music and speech stimuli were presented to participants in the scanner using Eprime V1.0 (Psychological Software Tools, 2002). Participants wore custom-built headphones designed to reduce the background scanner noise to approximately 70 dBA (Menon and Levitin 2005).
Postscan Assessments
Immediately following the scan, participants filled out a form to indicate which of the 2 conditions, music or speech, was best described by each of the following 12 semantic descriptors: Calm, Familiar, Unpleasant, Happy, Tense, Interesting, Dissonant, Sad, Annoying, Angry, Moving, and Boring. The data were characterized by using one binomial test for each descriptor (with a criterion of P < 0.05) in order to indicate when a term was applied more to one stimulus category than the other. Because participants showed a slight tendency to choose “speech” more often than “music” (55% of the time), the binomial equation was set at P = 0.55 and q = 0.45.
fMRI Data Acquisition
Images were acquired on a 3 T GE Signa scanner using a standard GE whole-head coil (software Lx 8.3). A custom-built head holder was used to prevent head movement during the scan. Twenty-eight axial slices (4.0-mm thick, 1.0-mm skip) parallel to the AC/PC line and covering the whole brain were imaged with a temporal resolution of 2 s using a -weighted gradient-echo spiral in–out pulse sequence (time repetition [TR] = 2000 ms, time echo [TE] = 30 ms, flip angle = 80°). The field of view was 200 × 200 mm, and the matrix size was 64 × 64, providing an in-plane spatial resolution of 3.125 mm. To reduce blurring and signal loss arising from field inhomogeneities, an automated high-order shimming method based on spiral in–out acquisitions was used before acquiring functional MRI scans (Kim et al. 2000).
To aid in localization of the functional data, a high-resolution T1-weighted spoiled GRASS gradient recalled inversion-recovery 3D MRI sequence was used with the following parameters: TR = 35 ms; TE = 6.0 ms; flip angle = 45°; 24 cm field of view; 124 slices in coronal plane; 256 × 192 matrix; 2 averages, acquired resolution = 1.5 × 0.9 × 1.1 mm. The images were reconstructed as a 124 × 256 × 256 matrix with a 1.5 × 0.9 × 0.9-mm spatial resolution. Structural and functional images were acquired in the same scan session.
fMRI Data Analysis
Preprocessing
The first 2 volumes were not analyzed to allow for signal equilibration. A linear shim correction was applied separately for each slice during reconstruction using a magnetic field map acquired automatically by the pulse sequence at the beginning of the scan (Glover and Lai 1998). Functional MRI data were then analyzed using SPM5 analysis software (http://www.fil.ion.ucl.ac.uk/spm). Images were realigned to correct for motion, corrected for errors in slice timing, spatially transformed to standard stereotaxic space (based on the Montreal Neurological Institute [MNI] coordinate system), resampled every 2 mm using sinc interpolation, and smoothed with a 6-mm full-width at half-maximum Gaussian kernel to decrease spatial noise prior to statistical analysis. Translational movement in millimeters (x, y, z) and rotational motion in degrees (pitch, roll, and yaw) was calculated based on the SPM5 parameters for motion correction of the functional images in each participant. No participants had movement greater than 3-mm translation or 3 degrees of rotation; therefore, none were excluded from further analysis.
Quality Control
As a means of assessing the validity of individual participants’ fMRI data, we performed an initial analysis that identified images with poor image quality or artifacts. To this end, we calculated the standard deviation of each participants’ image (VBM toolboxes: http://dbm.neuro.uni-jena.de/vbm/) under the assumption that a large standard deviation may indicate the presence of artifacts in the image. The squared distance to the mean was calculated for each image. Results revealed one outlier among the 20 participants. This participant was >6 standard deviations from the mean on a number of images. Therefore, this participant was removed from all subsequent statistical analyses.
Univariate Statistical Analysis
Task-related brain activation was identified using a general linear model and the theory of Gaussian random fields as implemented in SPM5. Individual subject analyses were first performed by modeling task-related conditions as well as 6 movement parameters from the realignment procedure mentioned above. Brain activity related to the 4 task conditions (music, reordered music, speech, reordered speech) was modeled using boxcar functions convolved with a canonical hemodynamic response function and a temporal dispersion derivative to account for voxel-wise latency differences in hemodynamic response. Low-frequency drifts at each voxel were removed using a high-pass filter (0.5 cycles/min), and serial correlations were accounted for by modeling the fMRI time series as a first-degree autoregressive process (Poline et al. 1997). Voxel-wise t-statistics maps for each condition were generated for each participant using the general linear model, along with the respective contrast images. Group-level activation was determined using individual subject contrast images and a second-level analysis of variance (ANOVA). The 2 main contrasts of interest were (music–reordered music) and (speech–reordered speech). Significant clusters of activation were determined using a voxel-wise statistical height threshold of P < 0.01, with family-wise error (FWE) corrections for multiple spatial comparisons at the cluster level (P < 0.05).
Activation foci were superimposed on high-resolution T1-weighted images. Their locations were interpreted using known functional neuroanatomical landmarks (Duvernoy 1995; Duvernoy et al. 1999) as has been done in our previous studies (e.g., Menon and Levitin 2005). Anatomical localizations were cross-validated with the atlas of Mai et al. (2004).
MPA
A multivariate statistical pattern recognition-based method was used to find brain regions that discriminated between temporal structure changes in music and speech (Kriegeskorte et al. 2006; Haynes et al. 2007; Ryali et al. 2010) utilizing a nonlinear classifier based on SVM algorithms with radial basis function (RBF) kernels (Muller et al. 2001). Briefly, at each voxel vi, a 3 × 3 × 3 neighborhood centered at vi was defined. The spatial pattern of voxels in this block was defined by a 27-dimensional vector. SVM classification was performed using LIBSVM software (www.csie.ntu.edu.tw/∼cjlin/libsvm). For the nonlinear SVM classifier, we needed to specify 2 parameters, C (regularization) and α (parameter for RBF kernel), at each searchlight position. We estimated optimal values of C and α and the generalizability of the classifier at each searchlight position by using a combination of grid search and cross-validation procedures. In earlier approaches (Haynes et al. 2007), linear SVM was used, and the free parameter, C, was arbitrarily set. In the current work, however, we have optimized the free parameters (C and α) based on the data, thereby designing an optimal classifier. In M-fold cross-validation procedure, the data is randomly divided into M-folds. M-1 folds were used for training the classifier, and the remaining fold was used for testing. This procedure is repeated M times wherein a different fold was left out for testing. We estimated class labels of the test data at each fold and computed the average classification accuracy obtained at each fold, termed here as the cross-validation accuracy (CVA). The optimal parameters were found by grid searching the parameter space and selecting the pair of values (C, α) at which the M-fold CVA is maximum. In order to search for a wide range of values, we varied the values of C and α from 0.125 to 32 in steps of 2 (0.125, 0.25, 0.5, … , 16, 32). Here, we used a leave-one-out cross-validation procedure where M = N (where N is the number of data samples in each condition/class). The resulting 3D map of CVA at every voxel was used to detect brain regions that discriminated between the individual subjects’ t-score maps for each of the 2 experimental conditions: (music–reordered music) and (speech–reordered speech). Under the null hypothesis that there is no difference between the 2 conditions, the CVAs were assumed to follow the binomial distribution Bi(N, P) with parameters N equal to the total number of participants in 2 groups and P equal to 0.5 (under the null hypothesis, the probability of each group is equal; [Pereira et al. 2009]). The CVAs were then converted to P values using the binomial distribution.
Interpretation of Multivariate Pattern Analysis
The results from the multivariate analysis are interpreted in a fundamentally different manner as those described for traditional univariate results. Univariate results show which voxels in the brain have greater magnitude of activation for one stimulus condition (or contrast) relative to another. Multivariate results show which voxels in the brain are able to discriminate between 2 stimulus conditions or contrasts based on the pattern of fMRI activity measured across a predetermined number of voxels (a 3 × 3 × 3 volume of voxels in the current study). It is critical to note that, unlike the univariate method, MPA does not provide information about which voxels “prefer” a given stimulus condition relative to second condition. Our multivariate analyses identify the location of voxels that consistently demonstrate a fundamentally different spatial pattern of activity for one stimulus condition relative to another (Haynes and Rees 2006; Kriegeskorte et al. 2006; Schwarzlose et al. 2008; Pereira et al. 2009).
Anatomical ROIs
We used the Harvard–Oxford probabilistic structural atlas (Smith et al. 2004) to determine classification accuracies within specific cortical regions of interest (ROIs). A probability threshold of 25% was used to define each anatomical ROI. We recognize that the precise boundaries of IFC regions BA 44, 45, and 47 are currently unknown. To address this issue, we compared the Harvard–Oxford probabilistic structural atlas with the Probabilistic Cytoarchitectonic Maps (Eickhoff et al. 2005) and the AAL atlas (Tzourio-Mazoyer et al. 2002) for BAs 44 and 45 and found that while there are some differences in these atlases, the core regions of these brain structures show significant overlap.
For subcortical structures, we used auditory brainstem ROIs based on a previous structural MRI study (Muhlau et al. 2006). Based on the peaks reported by Muhlau et al. (2006), we used spheres with a radius of 5 mm centered at ±10, –38, –45 (MNI coordinates) for the cochlear nuclei ROIs, ±13, –35, –41 for the superior olivary complex ROIs, and ±6, –33, –11 for the inferior colliculus ROIs. A sphere with a radius of 8 mm centered at ±17, –24, –2 was used for the medial geniculate ROI.
Post hoc ROI Analysis
The aim of this analysis was to determine whether voxels that showed superthreshold classification in the MPA during temporal structure processing in music and speech also differed in activation levels. This post hoc analysis was performed using the same 11 bilateral frontal and temporal cortical ROIs noted above. A brain mask was first created consisting of voxels that had >63% classification accuracy from the MPA. This mask was then merged using the logical “AND” operator with each of the 11 bilateral frontal and temporal anatomical ROIs (Smith et al. 2004). Within these voxels, ANOVAs were used to compare mean activation levels during temporal structure processing in music and speech. ROI analyses were conducted using the MarsBaR toolbox (http://marsbar.sourceforge.net).
Physiological Data Acquisition and Analysis
Acquisition
Peripheral vascular physiological data was acquired using a photoplethysmograph attached to the participant’s left index finger. Pulse data was acquired as a sequence of triggers in time at the zero crossings of the pulse waveform. Respiration data was acquired using the scanner’s pneumatic belt placed on the participant’s abdomen. Respiration and cardiac rates were recorded using a data logger (PowerLab, AD Instruments, Inc.) connected to the scanner’s monitoring system and sampled at 40 Hz.
Preprocessing and Artifact Removal
Interbeat intervals in the pulse data were calculated as the intervals between the triggers, these interbeat intervals are then representative of values at the midpoint of each interval. The disadvantage with this description is that the interbeat intervals are represented at nonuniform intervals in time. To overcome this, these intervals were then resampled to a uniform rate of 2 Hz using cubic spline interpolation prior to analysis. Artifacts occur in the beat-to-beat interval data due to skipped or extra beats. Artifacts were detected by comparing the beat-to-beat interval values with the median of their predecessors and successors in a time window. Set comparison thresholds were used for elimination of unusually small (caused by extra beats) and unusually large (caused by skipped beats) intervals. Artifact removal was performed prior to interpolation and resampling. Data for each participant was further normalized to zero mean and unit variance to facilitate comparisons across participants.
Analysis
Heart rate variability (HRV) in a time window was calculated as the variance of the interbeat interval within that time window (Critchley et al. 2003). A physiological observation window was defined by the length of each stimulus epoch. HRV and mean breaths per minute in the observation windows were combined (pooled) across stimuli in each experimental condition (music, reordered music, speech, reordered speech) and across participants. HRV and breaths per minute were compared between conditions using paired t-tests.
Results
Physiological and Behavioral Analyses
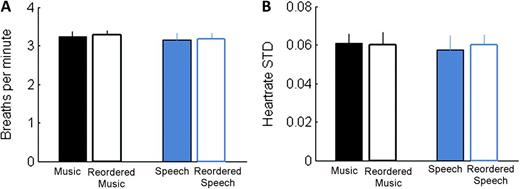
Participants exhibited increases in HRV and respiration rate in each of the experimental conditions (speech, music, and their reordered counterparts) compared with the baseline (rest), but we found no mean differences in these variables between conditions (Fig. 2), validating that the stimuli were well matched for arousal and emotional reactivity in study participants.
Equivalence of physiological measures by experimental condition. (A) Mean breaths per minute for each stimulus type. (B) HRV for each stimulus type as indexed by the mean of individual participants’ standard deviations over the course of the experiment. There were no significant differences within or across stimulus types.
Activation and Deactivation during Music and Speech Processing
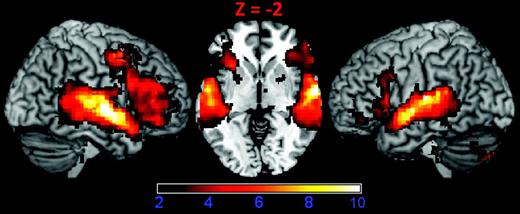
The goal of this analysis was to 1) verify that our temporal and frontal lobe ROIs were strongly activated by music and speech and 2) identify brain areas that showed task-induced deactivation (greater activation during the reordered than the ordered conditions). As expected, normal and reordered music and speech-activated broad regions of the frontal and temporal lobes bilaterally, including primary, nonprimary, and association areas of auditory cortex, IFC regions including Broca’s (BA 44 and 45) and the pars orbitalis region (BA 47), as well as subcortical structures, including the thalamus, brainstem, and cerebellum (Fig. 3). Within the temporal lobe, the left superior and middle temporal gyri showed the most extensive activation. In the frontal lobe, Broca’s area (BA 44 and 45) showed the most extensive activations.
Activation to music and speech. Surface rendering and axial slice (Z = −2) of cortical regions activated by music and speech stimuli show strong responses in the IFC and the superior and middle temporal gyri. The contrast used to generate this figure was (speech + reordered speech + music + reordered music) – rest. This image was thresholded using a voxel-wise statistical height threshold of (P < 0.01), with FWE corrections for multiple spatial comparisons at the cluster level (P < 0.05). Functional images are superimposed on a standard brain from a single normal subject (MRIcroN: ch2bet.nii.gz).
We also observed significant deactivation in the posterior cingulate cortex (BA 7, 31), the ventromedial PFC (BA 10, 11, 24, 32), and the visual cortex (BA 18, 19, 37), as shown in Supplementary Figure 1. This pattern is consistent with previous literature on task-general deactivations reported in the literature (Greicius et al. 2003). Because such task-general processes are not germane to the goals of our study, these large deactivated clusters were excluded from further analysis by constructing a mask based on stimulus-related activation. We identified brain regions that showed greater activation across all 4, normal and reordered, music and speech conditions compared with “rest” using a liberal height (P < 0.05) and cluster-extent threshold (P < 0.05), and binarized the resulting image to create a mask. This mask image was used in subsequent univariate and multivariate analyses.
Structure Processing in Music Versus Speech—Univariate Analysis
Next, we turned to the main goal of our study, which was to compare temporal structure processing in music versus speech. For this purpose, we compared fMRI response during (music–reordered music) with (speech–reordered speech) using a voxel-wise analysis. fMRI signal levels were not significantly different for temporal structure processing between musical and speech stimuli (P < 0.01, FWE corrected). fMRI signal levels were not significantly different for temporal structure processing between music and speech stimuli even at a more liberal height threshold (P < 0.05) and extent thresholds using corrections for false discovery rate (P < 0.05) or cluster-extent (P < 0.05). These results suggest that for this set of regions, processing the same temporal structure differences in music and speech evokes similar levels of fMRI signal change.
Structure Processing in Music Versus Speech—MPA
We performed MPA to examine whether localized patterns of fMRI activity could accurately distinguish between brain activity in the (music–reordered music) and (speech–reordered speech) conditions. As noted above, to facilitate interpretation of our findings, this analysis was restricted to brain regions that showed significant activation during the 4 stimulus conditions, contrasted with rest. This included a wide expanse of temporal and frontal cortices that showed significant activation for the music and speech stimuli (Fig. 2). While these regions are identified using group-level activation across the 4 stimulus conditions, the activity patterns discriminated by MPA within this mask consist of both activating and deactivating voxels from individual subjects, and both activating and deactivating voxels contribute to classification results.
MPA analyses yielded “classification maps” in which the classification accuracy is computed for a 3 × 3 × 3 volume centered at each voxel. A classification accuracy threshold of 63%, representing accuracy that is significantly greater than random performance at the P < 0.05 level, was selected for thresholding these maps. As noted below, classification accuracies in many brain regions far exceeded this threshold.
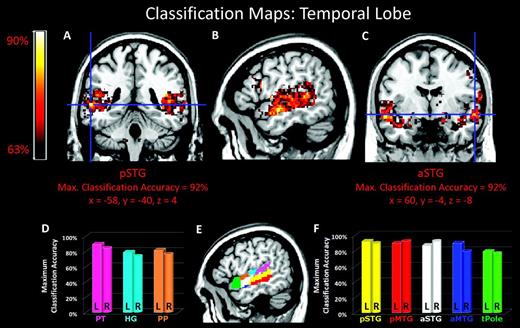
Several key cortical, subcortical, and cerebellar regions were highly sensitive to differences between the same structural manipulations in music and speech. High classification accuracies (>75%; P < 0.001) were observed in the left IFC pars opercularis (BA 44), right IFC pars triangularis (BA 45), and bilateral IFC pars orbitalis (BA 47; Fig. 4). Several regions within the temporal lobes bilaterally also showed high classification accuracies, including anterior and posterior superior temporal gyrus (STG) and middle temporal gyrus (MTG) (BA 22 and 21), the temporal pole, and regions of the superior temporal plane including Heschl’s gyrus (HG) (BA 41), the planum temporal (PT), and the planum polare (PP) (BA 22; Fig. 5). Across the entire brain, the highest classification accuracies were detected in the temporal lobe, with accuracies >90% (P < 0.001) in left-hemisphere pSTG and right-hemisphere aSTG and aMTG (Fig. 5). Table 1 shows the classification accuracy in each cortical ROI.
Descriptive statistics from multivariate pattern analysis
| Cortical structure (Harvard–Oxford map) | Percent of voxels > threshold | Mean class, accuracy (%) | Maximum class, accuracy (%) | Maximum, Z score |
| Left BA44 | 40.6 | 61.7 | 86.8 | 4.99 |
| Left BA45 | 22.3 | 58.2 | 73.7 | 3.15 |
| Left BA47 | 16.1 | 57.0 | 76.3 | 3.50 |
| Left Heschl | 55.6 | 62.8 | 78.9 | 3.85 |
| Left MTGAnt | 98.5 | 77.6 | 89.5 | 5.40 |
| Left MTGPost | 81.6 | 68.8 | 86.8 | 4.99 |
| Left polare | 51.7 | 62.9 | 81.6 | 4.22 |
| Left STGAnt | 92.9 | 73.9 | 89.5 | 5.40 |
| Left STGPost | 80.3 | 69.5 | 92.1 | 5.83 |
| Left TempPole | 36.9 | 59.8 | 78.9 | 3.85 |
| Left temporale | 52.7 | 62.9 | 89.5 | 5.40 |
| Right BA44 | 22.9 | 57.9 | 76.3 | 3.50 |
| Right BA45 | 45.8 | 62.1 | 84.2 | 4.60 |
| Right BA47 | 35.1 | 59.5 | 76.3 | 3.50 |
| Right Heschl | 28.0 | 58.8 | 73.7 | 3.15 |
| Right MTGAnt | 57.1 | 63.9 | 78.9 | 3.85 |
| Right MTGPost | 65.2 | 66.3 | 92.1 | 5.83 |
| Right polare | 34.6 | 59.6 | 76.3 | 3.50 |
| Right STGAnt | 52.1 | 63.4 | 92.1 | 5.83 |
| Right STGPost | 51.0 | 62.8 | 89.5 | 5.40 |
| Right TempPole | 15.7 | 56.3 | 76.3 | 3.50 |
| Right temporale | 55.1 | 63.3 | 84.2 | 4.60 |
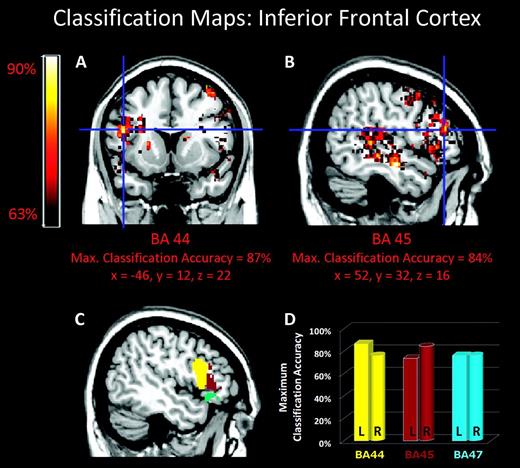
MPA of temporal structure in music and speech. (A–B) Classification maps for temporal structure in music and speech superimposed on a standard brain from a single normal subject. (C) Color coded location of IFC ROIs. (D) Maximum classification accuracies in BAs 44 (yellow), 45 (brown), and 47 (cyan). Cross hair indicates voxel with maximum classification accuracy.
MPA of temporal structure in music and speech. (A–C) Classification maps for temporal structure in music and speech superimposed on a standard brain from a single normal subject. (D) Maximum classification accuracies for PT (pink), HG (cyan), and PP (orange) in the superior temporal plane. (E) Color coded location of temporal lobe ROIs. (F) Maximum classification accuracies for pSTG (yellow), pMTG (red), aSTG (white), aMTG (blue), and tPole (green) in middle and superior temporal gyri as well as the temporal pole. a, anterior; p, posterior; tPole, temporal pole.
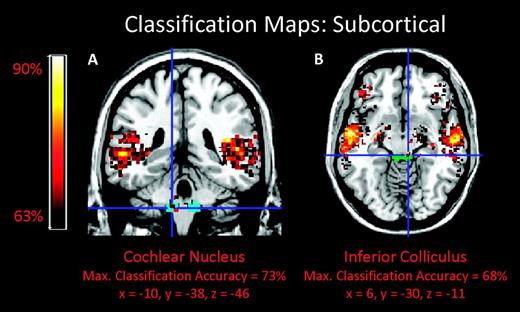
Subcortical nuclei were also sensitive to differences between normal and reordered stimuli in music and speech (Fig. 6, left and center). The anatomical locations of these nuclei were specified using ROIs based on a prior structural MRI study (Muhlau et al. 2006). Brainstem auditory nuclei, including bilateral cochlear nucleus, left superior olive, and right inferior colliculus and medial geniculate nucleus, also showed classification values that exceeded the 63% threshold. Other regions that were sensitive to the temporal structure manipulation were the bilateral amygdale, hippocampi, putamens and caudate nuclei of the dorsal striatum, and the left cerebellum.
MPA of temporal structure in music and speech. Classification maps for brainstem regions (A) cochlear nucleus (cyan) and (B) inferior colliculus (green) superimposed on a standard brain from a single normal subject (MRIcroN: ch2.nii.gz).
Structure Processing in Music Versus Speech—Signal Levels in ROIs with High Classification Rates
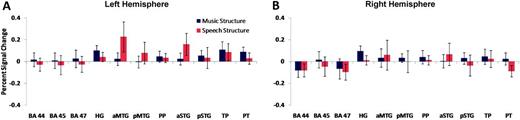
A remaining question is whether the voxels sensitive to music and speech temporal structure manipulations identified in the classification analysis arise from local differences in mean response magnitude. To address this question, we examined activity levels in 11 frontal and temporal cortical ROIs that showed superthreshold classification rates. We performed a conventional ROI analysis comparing signal changes in the music and speech structure conditions. We found that mean response magnitude was statistically indistinguishable for music and speech temporal structure manipulations within all frontal and temporal lobe ROIs (range of P values: 0.11 through 0.99 for all ROIs; Fig. 7).
ROI signal change analysis. Percentage signal change in ROIs for music structure (blue) and speech structure (red) conditions. ROIs were constructed using superthreshold voxels from the classification analysis in 11 frontal and temporal cortical regions bilaterally. There were no significant differences in signal change to temporal structure manipulations in music and speech. TP, temporal pole.
Discussion
Music and speech stimuli and their temporally reordered counterparts were presented to 20 participants to examine brain activation in response to the same manipulations of temporal structure. Important strengths of the current study that differentiate it from its predecessors include the use of the same stimulus manipulation in music and speech, a within-subjects design, and tight controls for arousal and emotional content. The principal result both supports and extends the SSIRH (Patel 2003). The same temporal manipulation in music and speech produced fMRI signal changes of the same magnitude in prefrontal and temporal cortices of both cerebral hemispheres in the same group of participants. However, MPA revealed significant differences in the fine-grained pattern of fMRI signal responses, indicating differences in dynamic temporal structure processing in the 2 domains. In particular, the same temporal structure manipulation in music and speech was found to be differentially processed by a highly distributed network that includes the IFC, anterior and posterior temporal cortex, and the auditory brainstem bilaterally. The existence of decodable fine-scale pattern differences in fMRI signals suggests that the 2 domains share similar anatomical resources but that the resources are accessed and used differently within each domain.
IFC Involvement in Processing Temporally Manipulated Music and Speech Stimuli
Previous studies have shown that subregions of the IFC are sensitive to semantic and syntactic analysis in music and speech. Semantic analysis of word and sentence stimuli have revealed activation in left BA 47 (Dapretto and Bookheimer 1999; Roskies et al. 2001; Wagner et al. 2001; Binder et al. 2009) and left BA 45 (Newman et al. 2001; Wagner et al. 2001), while the analysis of language-based syntax has typically revealed activation of left BA 44 (Dapretto and Bookheimer 1999; Ni et al. 2000; Friederici et al. 2006; Makuuchi et al. 2009). In the music domain, BA 44 has also been implicated in syntactic processing. For example, magnetoencephalography (Maess et al. 2001) and fMRI (Koelsch et al. 2002) studies have shown increased cortical activity localized to Broca’s Area (BA 44) and its right-hemisphere homolog in response to chord sequences ending with “out-of-key” chords relative to “in-key” chords. A prior study has shown that the anterior and ventral aspects of the IFC within the pars orbitalis (BA 47) are sensitive to temporal structure variation in music (Levitin and Menon 2003, 2005). The present study differs from all previous studies in its use of an identical, well-controlled structural manipulation of music and speech stimuli to examine differences in fine-scale patterns of fMRI activity in the same set of participants.
The IFC distinguished between the same temporal structure manipulation in music and speech with classification accuracies between 70% and 85%. Importantly, all 3 subdivisions of the IFC—BA 44, 45, and 47—were equally able to differentiate the same manipulation in the 2 domains (Fig. 4). Furthermore, both the left and right IFC were sensitive to temporal structure, although the relative classification rates varied considerably across the 3 subdivisions and 2 hemispheres. The inferior frontal sulcus was also sensitive to temporal structure, consistent with a recent study that showed sensitivity of the inferior frontal sulcus to hierarchically structured sentence processing in natural language stimuli (Makuuchi et al. 2009).
These results extend the SSIRH by showing that both left and right hemisphere IFC are involved in decoding temporal structure and that there is differential sensitivity to temporal structure among the constituent structures of the IFC. Although classification rates were high in both Broca’s area and its right-hemisphere homolog (BA 44 and 45), these regions showed differential sensitivity with higher classification rates in the left, as compared with the right, BA 44, and higher classification rates in the right, compared with the left, BA 45. Additional experimental manipulations will be needed to further delineate and better understand the relative contributions of various left and right hemisphere subregions of the IFC for processing of fine- and coarse-grained temporal structure.
Modular Versus Distributed Neural Substrates for Temporal Structure Processing and Syntactic Integration
In addition to the IFC, responses in several temporal lobe regions also distinguished between the same structural manipulation in music and speech. Classification accuracies greater than 85% were observed bilaterally in the anterior and posterior divisions of the STG and pMTG as well as the left PT and aMTG. Slightly lower accuracies (∼75%) were found in the temporal pole and PP in addition to HG. Again, it is noteworthy that fMRI signal strengths to the 2 acoustic stimuli were statistically similar in all regions of temporal lobe.
A common interpretation of prior findings has been that the processing of music and speech syntax is a modular phenomenon, with either IFC or anterior temporal regions underlying different processes (Caplan et al. 1998; Dapretto and Bookheimer 1999; Grodzinsky 2000; Ni et al. 2000; Maess et al. 2001; Martin 2003; Humphries et al. 2005). It is important to note, however, that the many studies that have arrived at this conclusion have often used dissimilar experimental manipulations, including different cognitive paradigms and stimulus types. We hypothesize that a common bilateral and distributed network including cortical, subcortical, brainstem, and cerebellar structures underlies the decoding of temporal structure (including syntax) in music and speech. This network is incompletely revealed when only the amplitude of fMRI signal changes are examined (Freeman et al. 2009). When the magnitude of fMRI signal change is the independent variable in studies of temporal structure processing, the (usually cortical) structures that are subsequently identified may primarily reflect large differences in the stimulus types and cognitive paradigms used to elicit brain responses. Consistent with this view, both anatomical and intrinsic functional connectivity analyses have provided evidence for strong coupling between the IFC, pSTS/STG, and anterior temporal cortex (Anwander et al. 2007; Frey et al. 2008; Friederici 2009; Petrides and Pandya 2009; Xiang et al. 2010). A compelling question for future research is how this connectivity differentially influences structure processing in music and speech.
“Low-Level” Auditory Regions and Temporal Structure Processing of Music and Speech
Auditory brainstem regions, including the inferior colliculus, superior olive, and cochlear nucleus, were among the brain areas that showed superthreshold levels of classification accuracies between normal and temporally reordered stimuli in this study. Historically, the brainstem has primarily been associated with only fine-grained temporal structure processing (Frisina 2001), but there is growing evidence to suggest that brainstem nuclei are sensitive to temporal structure over longer time scales underlying auditory perception (King et al. 2002; Wible et al. 2004; Banai et al. 2005, 2009; Krishnan et al. 2005; Russo et al. 2005; Johnson et al. 2007, 2008; Musacchia et al. 2007; Wong et al. 2007; Song et al. 2008). One possible interpretation of these brainstem findings is that they reflect corticofugal modulation of the incoming sensory stimulus by higher level auditory regions. The mammalian auditory system has robust top-down projections from the cortex which converge on the auditory brainstem (Webster 1992), and neurophysiological studies have shown that “top-down” information refines acoustic feature representation in the brainstem (Polley et al. 2006; Luo et al. 2008; Nahum et al. 2008; Song et al. 2008). Whether the auditory brainstem responses found in the present study arise from top-down corticofugal modulation or from intrinsic processing within specific nuclei that were not spatially resolved by the fMRI parameters employed here requires further investigation.
Broader Implications for the Study of Temporal Structure and Syntactic Processing in Music and Speech
A hallmark of communication in humans—through music or spoken language—is the meaningful temporal ordering of components in the auditory signal. Although natural languages differ considerably in the strictness of such ordering, there is no language (including visually signed languages) or musical system (other than 12 tone or “quasi-random” styles of 20th century experimental European music) that arranges components without ordering rules. The present study demonstrates the effectiveness of carefully controlled reordering paradigms for studying temporal structure in both music and speech, in addition to the more commonly used “oddball” or expectancy violation paradigms. The present study has focused on perturbations that disrupt sequential temporal order at approximately 350 ms segment lengths. An interesting question for future research is how the temporal granularity of these perturbations influences brain responses to music and speech.
In addition to disrupting the temporal ordering of events, the acoustical manipulations performed here also altered the rhythmic properties of the music and speech stimuli. In speech, the rhythmic pattern of syllables is thought to provide a critical temporal feature for speech understanding (Drullman et al. 1994; Shannon et al. 1995), and in music, rhythm is regarded as a primary building block of musical structure (Lerdahl and Jackendoff 1983; Dowling and Harwood 1986; Levitin 2002; Large 2008): rhythmic patterns set up expectations in the mind of the listener, which contribute to the temporal structure of phrases and entire compositions (Bernstein 1976; Huron 2006). Extant literature suggests that there is considerable overlap in the brain regions that track rhythmic elements in music and speech, although this question has never been directly tested. Both music and speech rhythm processing are thought to engage auditory cortical regions (Grahn and Brett 2007; Abrams et al. 2008, 2009; Chen et al. 2008; Geiser et al. 2008; Grahn and Rowe 2009), IFC (Schubotz et al. 2000; Snyder and Large 2005; Grahn and Brett 2007; Chen et al. 2008; Geiser et al. 2008; Fujioka et al. 2009; Grahn and Rowe 2009), supplementary motor and premotor areas (Schubotz et al. 2000; Grahn and Brett 2007; Chen et al. 2008; Geiser et al. 2008; Grahn and Rowe 2009), the insula and basal ganglia (Grahn and Brett 2007; Geiser et al. 2008). The cerebellum is thought to play a fundamental role in the processing of musical rhythm (Grahn and Brett 2007; Chen et al. 2008; Grahn and Rowe 2009), and a recent article proposes a prominent role for the cerebellum in the processing of speech rhythm (Kotz and Schwartze 2010). Many of the brain structures associated with music and speech rhythm processing—notably auditory cortex, IFC, the insula and cerebellum—were also identified in the MPA in our study, which may reflect differential processing of rhythmic properties between music and speech.
Comparisons between music and language are necessarily imperfect because music lacks external referents and is considered to be primarily self-referential (Meyer 1956; Culicover 2005), while language generally has specific referents The present study examined temporal structure by comparing brain responses with the same manipulations of temporal structure in music and speech. The granularity of temporal reordering attempted to control for semantic processing at the word level, but long-range semantic integration remains an issue, since there are structures in the human brain that respond to differences in speech intelligibility (Scott et al. 2000; Leff et al. 2008; Okada et al. 2010), and these do not have an obvious musical counterpart. Differences in intelligibility and meaning across stimulus classes are unavoidable in studies directly comparing naturalistic music and speech processing, and more experimental work will be necessary to fully comprehend the extent to which such issues may directly or indirectly contribute to the processing differences uncovered here.
Funding
National Institutes of Health (National Research Service Award fellowship to D.A.A.); National Science Foundation (BCS0449927 to V.M. and D.J.L.); Natural Sciences and Engineering Research Council of Canada (223210 to D.J.L., 298612 to E.B.); Canada Foundation for Innovation (9908 to E.B.).
We thank Jason Hom for assistance with data acquisition and Kaustubh Supekar for help with analysis software. Conflict of Interest: None declared.