


Abstract
Magnetoencephalography (MEG) has recently revealed that the transitions between the parietal operculum (Pop) and the insula (area G) and the ventral end of the central sulcus (cs) were activated with the shortest latency by instrumental gustatory stimulation, which suggests that the location of the primary gustatory area is in these two regions. However, studies using other noninvasive brain-imaging methods such as positron-emission tomography or functional magnetic resonance imaging (fMRI) with manual application of tastants into the mouth have been unable to confirm this. The present study examined cortical activation by repetitive stimulation of the tongue tip with 1 M NaCl with a computer-controlled stimulator and used fMRI to detect it. In individual brains, activations were detected with multiple comparisons (false discovery rate) across the whole brain corrected (threshold at P < 0.05) at both area G and frontal operculum (Fop) in 8 of 11 subjects and at the rolandic operculum (Rop) in 7 subjects. Activations were also found at the ventral end of the cs (n = 3). Group analysis with random-effect models (multiple comparison using familywise error in regions of interest, P < 0.02) revealed activation at area G in both hemispheres and in the Fop, Rop, and ventral end of the cs on the left side. The present study revealed no activation on the gyrus of the external cerebral surface except for the Rop. Taking MEG findings into consideration, the present findings strongly indicate that the primary gustatory area is present at both the transition between the Pop and insula and the Rop including the gray matter within a ventral part of the cs.
Introduction
The presence of two primary gustatory cortices (PGCs) in subhuman primates has been established by mapping of evoked potentials (Benjamin and Burton, 1968; Ogawa et al., 1985) and a neuroanatomical tract-tracing method (Kusama et al., 1985; Pritchard et al., 1986). One of the PGCs locates at the transition between the frontal operculum (Fop) and insula (area G; Sanides, 1968) and the other at the precentral extension of the primary somatosensory area (area 3) (Ogawa et al., 1985; Pritchard et al., 1986).
On the other hand, some candidates for the PGC in human brain have come from clinical studies. Bornstein (1940), studying human cases with ageusia, described the involvement of lesions in area 43 or the rolandic operculum (Rop), whereas Penfield and Jasper (1954) and Penfield and Faulk (1955) elicited taste sensation by electrical stimulation of the dorsal insula or the transition between the frontoparietal operculum and insula during brain surgery in humans.
The recent development of noninvasive brain imaging allows us to examine natural activation in the cerebral cortex in alert humans. Positron-emission tomography (PET) and functional magnetic resonance imaging (fMRI) have revealed activation at the Fop or the superior insula anterior to the central sulcus (cs) and suggested that the PGC presents at the same region in humans as in subhuman primates (Kinomura et al., 1994; Small et al., 1997, 1999, 2003; Faurion et al., 1998; Cerf-Ducastel et al., 2001). Magnetoencephalography (MEG), however, located the PGC at the transition between the parietal operculum (Pop) and insula (presumably human area G) because this area was the fastest activated bilaterally in most subjects after gustatory stimulation of the tongue tip, followed by the Fop (Kobayakawa et al., 1996, 1999). Activation is sometimes found at the ventral end of the cs as fast as at area G, probably as it comprises another PGC, which might correspond to the precentral extension of area 3 in subhuman primates. When both electroencephalography (EEG) and MEG were recorded simultaneously, no EEG activity preceded the first deflection of the magnetic field changes in MEG (Mizoguchi et al., 2002), indicating that area G is one of the foci of gustation-evoked activity in the cerebral cortices, but not excluding the possibility that some gyrus is activated simultaneously with area G, not confirmed by MEG or EEG study.
Although some investigators have reported gustatory activation at the Pop and/or superior posterior insula (Frey and Petrides, 1999; Zald and Pardo, 2000), most investigators have confirmed it at the Fop by fMRI (Barry et al., 2001; Small et al., 2003) or PET (Kinomura et al., 1994; Small et al., 1997). Such findings with fMRI and PET studies as well as the inability of MEG to detect activation at the gyral crown encouraged us to confirm activation of the PGC suggested by MEG with fMRI or PET.
To find taste-activated cortices with fMRI or PET, many investigators have placed a piece of filter paper soaked with a taste solution on the tongue of subjects (Small et al., 1997) or infiltrated a small amount of a taste solution into the mouth of subjects (Kinomura et al., 1994; Faurion et al., 1999; Cerf-Ducastel et al., 2001; Small et al., 2003; Kringelbach et al., 2004), probably by asking coworkers near the magnetic resonance imaging (MRI) scanner to do so. Repetitive application of tastants to the tongue in a closed fluid delivery system gives more intense stimulation than other methods (Kelling and Halpern, 1987; Halpern, 1994). On the other hand, Van de Moortele et al. (1997) pointed out the need to improve the correlation between the MRI signal time course and the stimulus paradigm.
The present study aimed to detect activation at the Pop and adjacent areas in human cortex using fMRI. We used a computer-controlled stimulator without tactile sense induced as in our earlier MEG study (Kobayakawa et al., 1999) to repeatedly stimulate the tongue in a closed form during a stimulation period to reduce gustatory adaptation at receptor sites and delayed the template of the hemodynamic response function (HRF) to improve the correlation between the MRI signal time course and the stimulus paradigm.
Materials and methods
Subjects
Our institutional review board approved the study protocol, and experiments were conducted in accordance with the revised Helsinki Declaration of Human Rights. A total of 11 neurologically healthy subjects (six male and five female, aged 21–31 years, mean 23.8 years) participated in the experiments. All subjects proved to have normal taste sensitivity when studied with an electrogustometer (TR-02, Rion, Tokyo, Japan) and taste-disc method (Tomita and Ikeda, 2002). All subjects were classified as right handed by the Edinburgh Inventory (Oldfield, 1971), the average handedness score being 88.2 (range, 75–100).
Taste stimulation
One molar NaCl dissolved in deionized water was used as the tastant. Lying on their back in the scanner, subjects received a series of fluids with the dorsal surface of the tongue tip placed in a small pore (7 × 2.8 mm) of a Teflon tube through which water and tastant were delivered from a revised version of a computer-controlled taste stimulator (Kobayakawa et al., 1996, 1999) installed in the operation room of a magnetic resonance scanner. The stimulation paradigm (Figure 1) consisted of 10 blocks, 1 block being made of a control (48 s; 16 trials of 500 + 3 × 600 ms deionized water pulses) followed by a stimulation period (48 s; 16 trials of 500 ms tastant pulses and 3 × 600 ms water pulses) (Figure 1). The flow rate was 140 ml/min. Air bubbles were introduced between tastant pulses and water pulses and between two succeeding water pulses to separate the tastant and water and to give the same number of air bubbles in both control and stimulation periods. A constant fluid flow, lasting longer than 600 ms, was not included during the stimulation period. Tastant pulses were stained with edible dye (red food dye; Allura Red AC, Aizan, Hodogaya, Japan). An optical sensor was placed 48 mm before the stimulation site on the tongue to estimate the time at which the tastant reached the tongue.
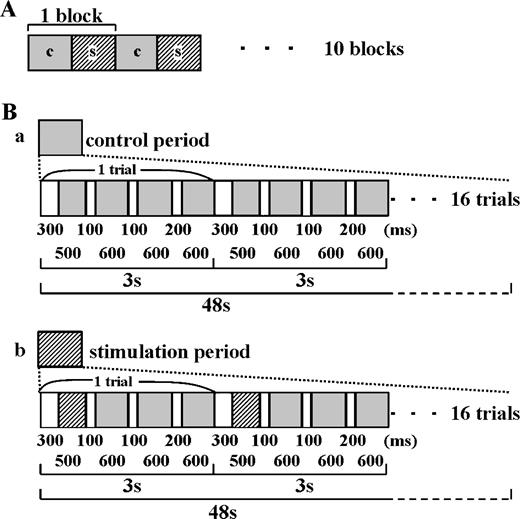
Taste stimulus delivery protocol. (A) A block consisting of the control (water rinse, 48 s) and taste stimulation period (48 s) was repeatedly applied 10 times. (B) The microstructure of control and stimulation periods. The stimulation period (b) consisted of 16 trials (one trial, 3 s) of a taste stimulus pulse followed by two water pulses, whereas the control (a) consisted of 16 trials of three water pulses. A small air bubble was introduced to separate two water pulses or water and taste pulses. Both periods consist of the same time sequence of fluid delivery except that the tastant was replaced by the water used in the control period. The lengths of periods of water and tastant pulses and air bubbles are shown in milliseconds.
Subjects were asked to be attentive to tastants during the recording session. After the session, they were asked about the quality of the tastants and the perceived intensity of the saltiness on an ordinal scale of six steps from not detectable (0), detectable but very weak (1), weak (2), moderate (3), strong (4), to very strong (5) and asked about possible evoked tactile sensations and differences in temperature between water and the gustatory stimulus.
fMRI measurements
Images were acquired on a Siemens' 1.5 T Magnetom Vision scanner (Erlangen, Germany) equipped with a head gradient coil. Echo planar imaging was used to measure the blood oxygenation-level–dependent (BOLD) signal as an indication of cerebral brain activation. Subjects laid on their back in the scanner with their head held with foam pads and headgears to limit motion artifacts. Each fMRI session lasted 30 min, including acquisition of an anatomical magnetic resonance image (T1) as a reference. For each run, 20 contiguous echo planar images (from top to bottom), 4 mm thick, were repetitively acquired (flip angle, 90°; space resolution, 64 × 64 voxels; field of view, 25 × 25 cm2; repetition time [TR], 3 s; echo time [TE], 60 ms). A high-resolution three-dimensional (3-D) anatomical image (T1) was also acquired to allow accurate localization of activated foci (TR, 13.5 ms; TE, 7 ms; field of view, 250 × 250 mm; thickness, 1.25 mm; inversion recovery sequence, 108 × 256 × 256 voxels). The output of the photodiode signaling of the arrival of tastants to the tongue was monitored on a pen recorder, which allowed the determination of which volumes contained images during activated periods.
Data analysis
A block-designed paradigm was used to image brain responses to a block of taste stimulation in contrast to those during the control period with water pulses only. Data were analyzed on a PC (Windows XP) under the Matlab 6.5, release 13 (MathWorks, Inc., Sherborn, MA), using SPM 99 (Wellcome Department of Cognitive Neurology, University of London, London, UK). Functional images were realigned to the volume of images immediately preceding the anatomical T1 image. In all cases, functional images obtained for the 10 blocks of stimulation were used for detecting activation in the brain.
Each individual run resulted in 355 temporal volumes (1 volume = 20 slices). The first 10 temporal volumes at least were discarded to take into account the period needed for stabilization of the magnetic resonance signals. The remaining 345 volumes were then submitted to realignment procedures with first-order adjustment. Successive 10 blocks of images with 32 volumes per block, without movement exceeding 1.5 mm in any direction or by rotation, were used for analysis.
A model HRF in the SPM 99 program was used to extract activation. Since the activation of the region of interest (ROI), area G in particular, was found to start at least 5 volumes behind the start of the stimulation period (see Figure 3), the HRF template was usually shifted by 5 volumes to meet the start of the activation. The time series at each voxel was high-pass and low-pass filtered with a hemodynamic response kernel. A section cutoff period of 120 s was used to eliminate instrumental and physiological low-frequency signal variations. A low spatial smoothing with an 8-mm kernel (approximate size of 1 voxel) was applied to all functional images.
To detect activations in individual brains, multiple voxelwise comparisons using the false discovery rate (FDR) procedure (Genovese et al., 2002) across the whole brain were carried out, and the threshold after the FDR correction was set at P < 0.05.
Group analyses with random-effect models (n = 11) were performed. ROI analyses were carried out with multiple voxelwise comparisons using a familywise error (FWE) procedure within a cubic with a single edge of 20 mm. The Montreal Neurological Institute (MNI) coordinates of the centroids of a priori ROIs were (±47, −18, 15) for area G (including the Pop and superior posterior insula; Kobayakawa et al., 1999), (±50, 24, 0) for the Fop, and (±60, 2, 23) for the Rop and cs (Faurion et al., 1998). The statistical threshold was set at P < 0.02 after FWE correction.
The explored brain volume was confined to the anatomical MRI of the subject between two axial planes at the inferior surface of the orbitofrontal cortex and at 80 mm above the latter. In this volume, activations were counted in the ROIs that were anatomically identified according to brain atlases (Duvernoy, 1999; Mai et al., 1997). MNI coordinates were further calculated for all centers of clusters concerned in the explored brain volumes with the SPM 99 normalization algorithm.
Designation of activated regions
The operculum indicates the cortex overlying the insula directly or indirectly; thus, we differentiated the exposed and buried parts of the operculum. Further, Rop was defined as the gyrus at the foot of the cs ranging from the precentral to postcentral sulcus at the exposed part, corresponding to area 43 of Brodmann, and then the buried part was divided into the frontal and parietal divisions according to the ventral end of the cs. The insula was also divided into anterior and posterior parts at the ventral end of the cs, and further into superior and inferior parts (Augustine, 1996). The exposed Fop and Pop were the operculum anterior or posterior to the Rop. On the other hand, the buried Fop and Pop were defined as the regions anterior and posterior to the level of the ventral end of the cs, respectively. Area G defined by MEG includes both the buried part of Pop and the superior part of the posterior insula. The ROIs are illustrated in Figure 2 where the inside of the lateral sulcus is developed, and two coronal planes that cut through the Fop and Pop are shown. MNI coordinates of activated clusters were averaged within each cluster.
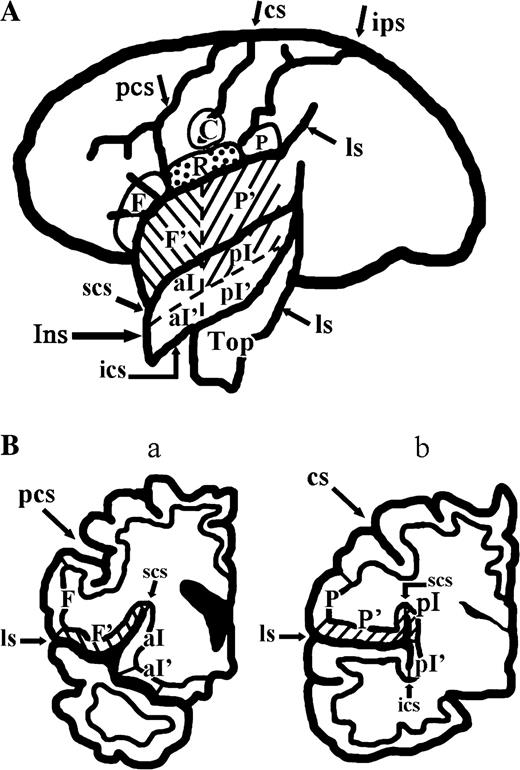
Locations of ROI. (A) Development of the lateral sulcus to show the ROIs at the operculum and insula together with those at the external surface of the cerebral hemisphere. (B) (a) and (b) show two coronal planes through the Fop and Pop, respectively. Hatched area represents area G; reversely hatched area, the Fop; and dotted area, the Rop, but the ventral end of the central operculum is not marked. C, Ventral end of the central sulcus; F, exposed part of the Fop; F′, buried part of the Fop; P, exposed part of the parietal operculum; P′, buried part of the Pop; R, Rop; Top, temporal operculum; aI, superior anterior insula; aI′, inferior anterior insula; pI, superior posterior insula; pI′, inferior posterior insula; cs, central sulcus; ips, intraparietal sulcus; ls, lateral sulcus; ics, inferior circular sulcus of the insula; scs, superior circular sulcus of the insula.
Results
All 11 subjects were able to detect tastants, and almost all identified the quality; three felt a strong degree of saltiness (4), six a moderate degree (3), and one a weak degree (2), and one subject detected but doubted the saltiness (1). The median of perceived intensity was 3. They confirmed no evoked tactile sensation and no difference in temperature between water and taste solutions. Subjects were not asked to evaluate the pleasantness of tastants.
Activation curve
To determine the time point to survey activated areas across subjects, the time course of activation was examined at two ROIs, Fop and area G, in a few subjects (Figure 3A,B). In the Fop, activation started at 1 or 2 volumes after the onset of the stimulation period, but in area G, it started at 3–5 volumes after the onset. Activation in both areas lasted for several volumes and gradually returned to the baseline level in a few volumes, but not immediately after the offset of the stimulation period. Since activation detection at area G was the primary aim of the present study, HRF was usually delayed by 5 volumes to examine activated cortical regions across subjects for both single-subject and group analyses, unless otherwise stated.
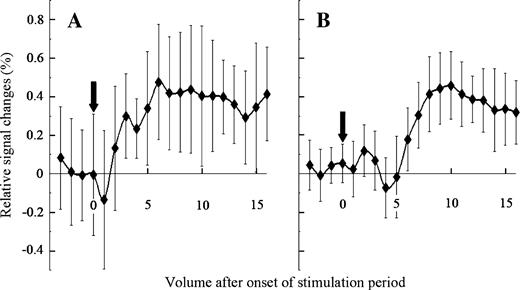
Activation curves at Fop (A) and area G (B). Average percent changes in BOLD signals (averaged over 8 of the 10 blocks without any large oscillation) increased 5 volumes after the onset of the stimulation period. Vertical arrows represent the onset of the stimulation period. Vertical bars indicate SEM; subject KH.
Gustatory-activated regions in frontal, parietal, and insular cortices
Individual brain images
Delaying the onset of the HRF template by 5 volumes, taste-evoked activations in individual brains were examined. In all 11 subjects, significant activation was detected in some ROIs (Table 1). Activated regions were most frequently located at both the buried Fop and Pop (8/11), followed by the Rop (7/11), the superior part of the posterior insula (4/11), buried Fop (3/11 for each), and then the ventral end of the cs (3/11). When both the buried Pop and the superior posterior insula were taken together as area G, activation in area G was found in 8/11 subjects. A representative example of activation in area G is shown in Figure 4, and those for the Rop, ventral cs, and Fop are illustrated in Figures 5A–C, respectively. In Figure 4, activation is shown in both the buried Pop and the superior part of the posterior insula, comprising area G, and the activated area extends to the outer surface of the hemisphere. The activation in other areas extends to outer surfaces; the activation in the Fop is rather localized at the outer surface in the case illustrated (Figure 5C, b and c). Both activations in the Rop and cs were frequently fused (in two on the right and in one on the left), and the Rop alone was activated on the right or left side in three cases. Activated areas were found bilaterally or unilaterally (Table 1), although the tongue tip stimulated is bilaterally innervated.
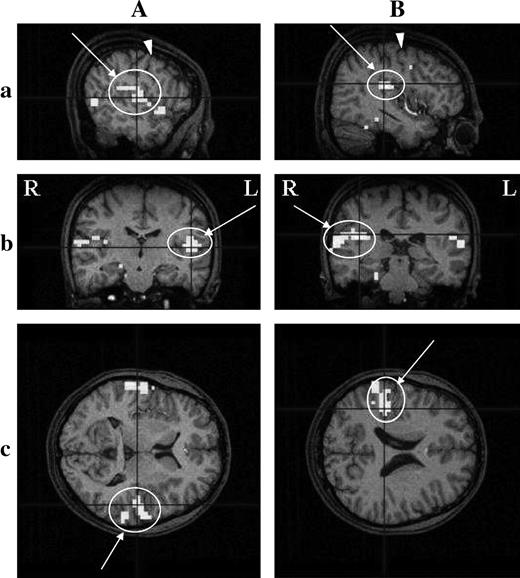
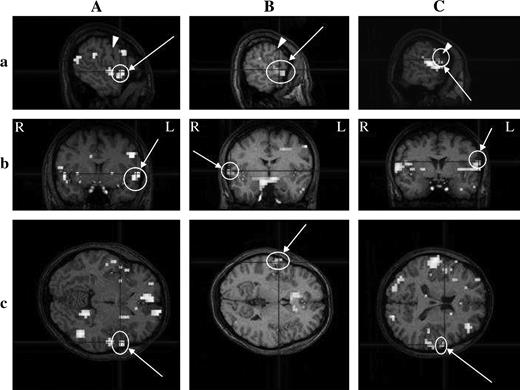
Activation detected in the Pop comprising area G in an individual cerebral cortex, revealed by fMRI. Activated regions on the left (A) and right (B) hemispheres are shown in three dimensions; coronal (a), sagittal (b), and horizontal (c) sections. The HRF was delayed by 5 volumes after the onset of the stimulation period. Circles with arrows indicate activated regions. Arrowheads show the cs. R, right side; L, left side. Threshold, P < 0.001; multiple comparisons over the entire volume (FDR). Subject YF2. A pseudocolor bar indicates the Z score scale.
(A), (B), and (C) show the activation detected in the Fop, the ventral end of the cs, and the Rop in an individual cerebral cortex, respectively. (A) Subject JO; (B) subject HT4; (C) subject JY3. Threshold, P < 0.05; multiple comparisons across the entire volume (FDR). See the legend of Figure 4 for other details of signs and marks.
Frequency of observed activations in ROIsa
Fop | Rop | cs | Area G | |||||
|---|---|---|---|---|---|---|---|---|
| Pop | Sp insula | Total | ||||||
| Right side only | 0 | 1 | 0 | 2 | 0 | 2b | ||
| Left side only | 2 | 2 | 1 | 1 | 0 | 1 | ||
| Both sides | 6 | 4 | 2 | 5 | 4 | 5 | ||
| Total | 8 | 7 | 3 | 8 | 4 | 8 | ||
Fop | Rop | cs | Area G | |||||
|---|---|---|---|---|---|---|---|---|
| Pop | Sp insula | Total | ||||||
| Right side only | 0 | 1 | 0 | 2 | 0 | 2b | ||
| Left side only | 2 | 2 | 1 | 1 | 0 | 1 | ||
| Both sides | 6 | 4 | 2 | 5 | 4 | 5 | ||
| Total | 8 | 7 | 3 | 8 | 4 | 8 | ||
Sp insula, superior posterior insula; area G, the primary gustatory area buried in the lateral sulcus, comprised from the Pop and sp insula. In the column for area G, activation of the Pop or sp insula comprising area G and total activation in area G are indicated. When both Pop and sp insula in a given area G were activated, or when either the Pop or the sp insula was activated, just one was counted.
Three of the four subjects who should be counted in this box were counted in the box of both sides because they had one part of area G activated unilaterally but the other part activated bilaterally.
The fraction of activations detected in the ROIs among 11 subjects varied with the delay of the HRF template (Figure 6). The fraction of activation detection at area G and Rop reached the maximum (n = 8 or 7, respectively) with the delay of 5 volumes, although it was found with a delay of 3–5 volumes for Fop.
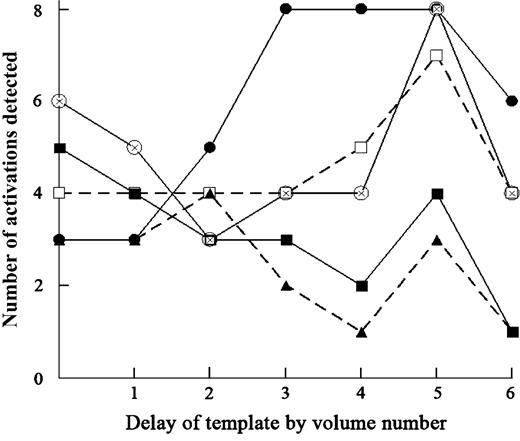
Dependency on the delay of the template of activation detection in various ROIs. The number of activations detected in various ROIs among 11 subjects is given for each template delay. Single-subject analysis with multiple comparisons (FDR) across the entire volume. Threshold of detection at P < 0.05. Open circle, buried Pop; filled circle, buried Fop; filled triangle, cs; open square, buried Rop; filled square, superior posterior insula. Area G, consisting of the buried Pop and superior posterior insula, followed the same time course as that of the buried Pop.
Group analysis: MNI coordinates of activated regions in a composite brain map
Group analysis revealed activations at the buried Fop, Rop, and cs on the left side and at the buried Pop and superior posterior insula on both sides (Table 2). MNI coordinates of the focus of the activated regions are shown in Table 2. Figures 7 and 8 show 3-D images at the parasagittal, coronal, and horizontal sections that were cut through the focus of the activation at area G and Fop. Area G was activated bilaterally in a region that extended over the buried part of the Pop and the superior posterior insula at the coronal plane and was expanded along the anteroposterior axis (Figure 7). The buried parts of the Fop were also activated just on the left side (Figure 8A). A large activation with a single focus was detected to cover the Rop and cs on the left side (Figure 8B).
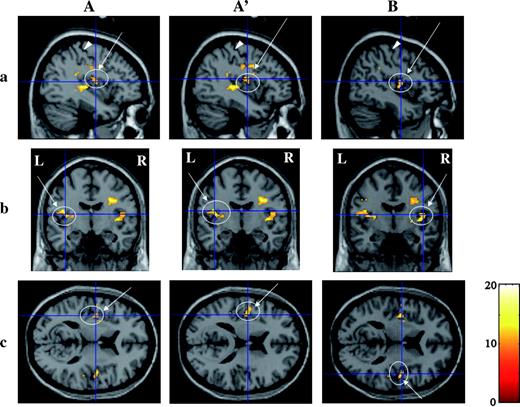
Three-dimensional images of activation in area G revealed by group analysis with a random-effect model within the ROI. (A and A′) Activations on the left side of the cerebral hemisphere. (B) Activations on the right side. (A and B) Activations with foci between the buried Pop and superior posterior insula; A′, buried Pop. ROI analysis was applied to the cubic with a centroid at (±47, −18, 15) and an edge length of 20 mm. Activations at both Pop and superior posterior insula on the left side were found at the same cluster. Threshold, P < 0.02; multiple comparison (FWE) corrected. See the legend of Figure 4 for other details of signs and marks.
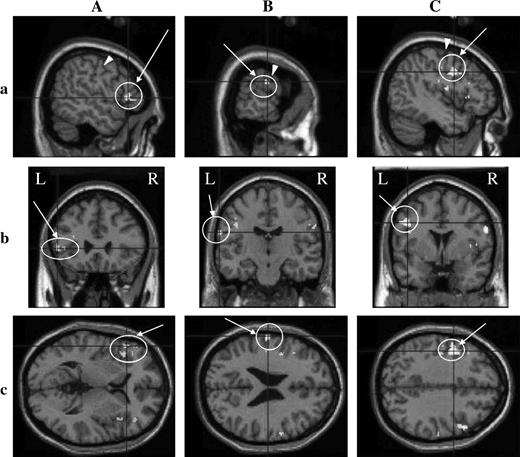
Three-dimensional images of activation in the Fop (A), Rop (B), and ventral end of the cs (C) revealed by group analysis with a random-effect model. Activation on the left hemisphere is shown for all three regions. ROI analysis was applied to the cubic with an edge length of 20 mm. The centroid was at (±50, 24, 0) for the Fop and at (±60, 2, 23) for the Rop. The cs was included in the cubic for the Rop. Threshold, P < 0.02; multiple comparison (FWE) corrected. For an explanation of signs and marks, see the legend for Figure 4.
MNI coordinates of gustation-activated regions in the frontal, parietal, and insular cortices in humans, revealed by group analysis
Cortical areas | Side | MNI coordinates, x, y, z | Z statistics | Cluster size (no. of voxels) | P value (voxel level) | |
|---|---|---|---|---|---|---|
| Fop | Buried | Left | −52, 26, 4 | 6.16 | 93 | 0.0003 |
| Rop | Left | −60, −18, 24 | 5.27 | 21 | 0.0105 | |
| cs | Left | −44, 2, 36 | 5.51 | 125 | 0.0041 | |
| Pop | Buried (area G) | Right | 46, −6, 12 | 5.37 | 119 | 0.0076* |
| Left | −38, −8, 12 | 5.24 | 106 | 0.0122+ | ||
| −48, −6, 16 | 5.13 | 106 | 0.0188 | |||
| Insula | Superior posterior (area G) | Right | 46, −6, 12 | 5.37 | 119 | 0.0076* |
| Left | −38, −8, 12 | 5.24 | 106 | 0.0122+ |
Threshold level: P < 0.02. Multiple voxelwise comparison with random field models (FWE) within the ROI. HRF template was delayed by 5 volumes. * and + indicate activations found at both the Pop and the superior posterior insula in the same cluster, respectively.
Discussion
Validity of the taste stimulation paradigm
Using a computer-controlled stimulator, the present study applied taste stimulation to a small area of the tongue tip of subjects through a closed fluid delivery system by intermittently inserting taste pulses into a series of water pulses during the stimulation period, while applying water pulses only during control periods. Control and stimulation periods were alternated to adapt the tongue to the fluid temperature, and both periods included an equal number of fluid pulses and air bubbles to cancel the effect of fluid temperature and any tactile component of air if present. Water in the control period might induce BOLD changes in the surveyed area (Zald and Pardo, 2000; Cerf-Ducastel et al., 2001), and some investigators have used a “tasteless” solution, consisting of ionic compositions in saliva, in the control period instead of water (O'Doherty et al., 2001; Kringelbach et al., 2004). We applied water to the tongue for a long time (∼30 s) before the start of the fMRI experiments to minimize any stimulation effect of water. Taste stimulation was contrasted with water application, but not with tactile stimulation. The present protocol was able to reveal activations in the ROI, in spite of possible activation by water in the control period.
Advantages of intermittent stimulation through a closed fluid delivery system
In the present study, we stimulated the tongue intermittently through a closed fluid delivery system during the stimulation period, instead of applying a constant flow of tastant throughout the period. Previous studies have placed a piece of filter paper soaked with a taste solution on the tongue of subjects (Small et al., 1997) or infiltrated a small amount of a taste solution into the mouth (Kinomura et al., 1994; Faurion et al., 1999; Cerf-Ducastel et al., 2001; O'Doherty et al., 2001; Small et al., 2003; Kringelbach et al., 2004).
It has been reported that the flow of fluid over the tongue increases taste discrimination compared with a sip-and-spit application (Nonaka and O'Mahony, 1994) and, furthermore, that repetitive application of tastant pulses with a closed fluid flow delivery apparatus at 5 Hz or higher induces a more intense perception than the application of a continuous flow (Kelling and Halpern, 1987). The advantages are ascribed to decreases in taste adaptation on receptor sites. The present study applied a tastant with 3-s intervals (0.3 Hz) through a closed fluid delivery system. Repetitive stimulations have also been used to activate other primary sensory cortices, such as visual, somatosensory, and olfactory cortices, for fMRI study (Kwong et al., 1992; Kleinschmidt et al., 1996; Sobel et al., 1997).
Stimulation procedures used previously, such as placing filter papers on the tongue or infiltrating fluid into the mouth, have caused somatic stimulation of the tongue and required stippling or swallowing. In some studies, a period for swallowing taste solutions was introduced to separate it from the stimulation period (O'Doherty et al., 2001; Small et al., 2003), and in other studies, subjects were allowed to swallow fluid or move the tongue during a control period to be contrasted (Zald and Pardo, 2000; O'Doherty et al., 2001). However, the swallowing activity was not monitored to ensure no occurrence of swallowing during the stimulation period. It is possible that oral movements and swallowing activate the ROIs, reducing the probability of activation detection at area G. The present method of fluid application did not cause fluids to accumulate in the mouth and thus avoided drinking or spitting out the fluid, which vigorously evokes BOLD signals in the surveyed area (Zald and Pardo, 2000).
The manual application of tastants to the subjects inevitably requires the presence of testing staff near the MRI scanner. Their movements might facilitate subjects being able to anticipate receiving the tastants, which could result in activation of the higher order area (O'Doherty et al., 2002). Attention to the pleasantness of tastants also may activate the higher order area, such as the orbitofrontal area or amygdala (O'Doherty et al., 2001; Small et al., 2003). It is not clear whether pleasantness affects activation in the primary gustatory area (PGA), which remains to be studied in future, although the moderate degree of perceived intensity of NaCl, such as three of the six steps in the present study, usually does not evoke unambiguous pleasantness or unpleasantness. In the present study, we applied tastants through a Teflon tube from the taste stimulator installed at the operation room and did not ask the subjects to rate pleasantness but just quality and intensity.
Concentrated NaCl as a tastant
Since the application of tastants to the whole mouth decreases the taste threshold in comparison to that to a restricted area of the tongue (Bujas and Ostojcic, 1941; Hara, 1955), 1 M NaCl at the small area of the tongue probably induces almost the same perceptual intensity as 0.2 or 0.1 M NaCl in the whole oral cavity. A high concentration of NaCl, such as 1 M, might irritate the lingual nerve in humans, as in rats (Kawamura et al., 1968) to activate area G, since this area in subhuman primates contains a large fraction of tactile or oral movement–activated neurons (Scott et al., 1986; Ito and Ogawa, 1994). However, this does not seem to be applicable to humans since researchers in our group found that such a high concentration of NaCl induces neither somatic nor taste sensation in patients with the bilateral chorda tympani dissected (Komiyama et al., 2005).
Correlation between the MRI signal time course and the stimulation paradigm
It is essential to start acquiring BOLD signals at the time of the start of the activation curves in cortical areas under study. The time course of the activation curves has been suggested to be dependent on cortical areas and the stimulation paradigm (Van de Moortele et al., 1997). Some investigators have used fMRI data to estimate it on the cortical areas under study (Kringelbach et al., 2004), while others have used the perception time course (Van de Moortele et al., 1997). In the present study, we estimated the activation curve using fMRI data at area G and the Fop. In area G, it started at least 5 volumes or 15 s after the start of the stimulation period; in the Fop, however, it started after 6–9 s, as previously reported (Kringelbach et al., 2004). The finding is quite contrary to the findings on electrical activations by MEG (Kobayakawa et al., 1999). The difference in the activation curve might be ascribed to differences in several factors, such as metabolic features or underlying vasculatures. The PGCs (area G and the precentral area 3) in subhuman primates are rich with cytochrome oxidase activity (Ito and Ogawa, 1991). Area G probably contains a larger store of energy so that it can tolerate excitation without triggering metabolic activity, in comparison with the Fop. Nonpredictable variance of the hemodynamic response was also noted between the visual and motor cortices (Miezin et al., 2000), which was probably due to the underlying differences in vasculature or to as yet unknown factors. Although repetitive stimulation was superior to a static one to activate area G, repetitive stimulation with 0.3 Hz may still not be adequate for area G to generate BOLD signals as fast as the Fop.
Location of activated areas revealed by fMRI
Single-subject analyses revealed activations not only at the buried Fop and the Rop, as in previous PET and fMRI studies (Kinomura et al., 1994; Faurion et al., 1998; Small et al., 2003), but also at the buried Pop and the superior posterior insula comprising area G and the ventral end of the cs, as in the preceding MEG study (Kobayakawa et al., 1999). Activations were most frequently observed at area G, although the frequency of the activation detection was not high enough to detect activation in all normal subjects.
The group analysis with random-effect models in the present study revealed obvious activation in area G in both hemispheres. To our knowledge, this is the first study, apart from those using MEG, to have revealed activation in area G by noninvasive brain imaging. Group analysis also revealed activation at the buried Fop, Rop, and cs, and buried Pop on just the left side, but at the superior posterior insula on both sides. Previous investigators have found bilateral activation at the Fop and Rop (Faurion et al., 1998; Small et al., 2003). Differences in the side of the cerebral hemisphere activated between area G and other ROIs were not determined.
Previously, various authors have reported activation in different cortical areas by NaCl. O'Doherty et al. (2001) reported the activation at the Fop, whereas Schoenfeld et al. (2004) at the anterior inferior insula. The anterior insula is assumed to contain the higher order gustatory areas (Faurion et al., 1998), and the Fop is probably one of the latter because it was activated a few hundred milliseconds behind area G on MEG (Kobayakawa et al., 1999). In the present study, we found activation at area G and the Fop, among others.
Activations in different areas may be ascribed to differences in experimental protocols, such as asking or not asking subjects to rate subjective pleasantness, the different degrees of the template delay for detecting activation, and the presence or absence of assistants near the scanner to apply tastants to subjects. Some of them might easily activate the higher order area rather than the PGC (O'Doherty et al., 2002).
PGCs other than area G in the human brain
In subhuman primates, the precentral extension of area 3 has been suggested to comprise the PGCs because it receives direct afferents from the thalamic taste relay as area G does (Benjamin and Burton, 1968; Pritchard et al., 1986). The precentral area 3 has now been found to contain taste neurons, as well (Hirata et al., 2005). The corresponding area in the human brain may locate at around the ventral end of the cs, including the Rop or area 43. Bornstein (1940) located the PGC at area 43, and recent neuroimaging studies found activations in the Rop (Faurion et al., 1998; Cerf-Ducastel et al., 2001) and the ventral end of the cs (Kobayakawa et al., 1999).
Simultaneous recordings of both gustation-evoked electrical and magnetic field changes revealed no EEG activity preceding the first deflection of magnetic field changes on MEG, the current dipole of which was located at area G (Mizoguchi et al., 2002). This suggests no focus of gustation-evoked activity on the cerebral cortex preceding area G. Since MEG cannot detect activity at the gyral crown, the findings do not rule out the possibility that the gray matter in both gyral crown and sulcus are activated at the same latency. In the present study, the Rop was only the gyral crown activated, resident near the ventral end of the cs in which one of the fastest activations was detected by MEG (Kobayakawa et al., 1999). Thus, the present findings suggest that the Rop is one of the PGCs, consistent with Bornstein (1940), and that its activation extends to the ventral end of the cs.
Most previous reports have found activation at the Fop with PET or fMRI studies and have determined it as a PGC simply because it located at the same place as found in nonhuman primates (Kinomura et al., 1994; Faurion et al., 1998; O'Doherty et al., 2001; for review, see Small et al., 1999). Probably, the observations were ascribed partly to a requirement for subjects to identify taste by action (Kinomura et al., 1994) or pleasantness (O'Doherty et al., 2001) or to the presence of testing staff near them to manipulate taste stimulation.
The present study is the first to have revealed activation in area G and the ventral end of the cs by fMRI, as has been indicated by MEG studies (Kobayakawa et al., 1996, 1999). Successful detection of activation in area G might be ascribed to (1) the repeated application of tastants to the tongue by the computer-controlled machine that did not require subjects to drink or swallow fluid during either the control or stimulation periods, although such movements per se might activate cortical areas near area G and (2) delaying the HRF template by 15 s to match the activation curve in area G.
The authors express their gratitude to Mr Y. Hiai for operation of the magnetic resonance scanner and to Mr H. Toda for construction of electrical equipment and software. This work was partly supported by a grant-in-aid from the Japanese Ministry of Education, Science, Sports and Culture (no. 14390059 to S.S. and group).
References
Augustine, J.R. (
Barry, M.A., Gatenby, J.C., Zeiger, J.D. and Gore, J.C. (
Benjamin, R.M. and Burton, H. (
Bornstein, W.S. (
Bujas, Z. and Ostojcic, A. (
Cerf-Ducastel, B., Van de Moortele, P.F., MacLeod, P., LeBihan, D. and Faurion, A. (
Duvernoy, H.M. (
Faurion, A., Cerf, B., LeBihan, D. and Pillias, A.-M. (
Faurion, A., Cerf, B., Van de Moortele, P.F., Lobel, E., MacLeod, P. and LeBihan, D. (
Frey, S. and Petrides, M. (
Genovese, C.R., Lazar, N.A. and Nichols, T. (
Halpern, P.B. (
Hara, S. (
Hirata, S., Nakamura, T., Ifuku, H. and Ogawa, H. (
Ito, S. and Ogawa, H. (
Ito, S. and Ogawa, H. (
Kawamura, Y., Okamoto, J. and Funakoshi, M. (
Kelling, S.T. and Halpern, B.P. (
Kinomura, S., Kawashima, R., Yamada, K., Ono, S., Itoh, M., Yoshioka, S., Yamauchi, T., Matsui, H., Miyazawa, H., Itoh, H., Goto, R., Fujiwara, T., Satoh, K. and Fukuda, H. (
Kleinschmidt, A., Lee, B.B., Requardt, M. and Frahm, J. (
Kobayakawa, T., Endo, H., Ayabe-Kanamura, S., Kumagai, T., Yamauchi, Y., Kikuchi, Y., Takeda, T., Saito, S. and Ogawa, H. (
Kobayakawa, T., Ogawa, H., Kaneda, H., Ayabe-Kanamura, S., Endo, H. and Saito, S. (
Komiyama, A., Kobayakawa, T., Goto, N., Saito, S. and Ikeda, M. (
Kringelbach, M.L., de Araujo, I.E. and Rolls, E.T. (
Kusama, T., Fujioka, M., Miyakawa, Y. and Fujii, M. (
Kwong, K.K., Belliveau, J.W., Chesler, D.A., Goldberg, I.E., Weisskoff, R.M., Poncelet, B.P., Kennedy, D.N., Hoppel, B.E., Cohen, M.S., Turner, R., Cheng, H.-M., Brady, T.J. and Rosen, B.R. (
Miezin, F.M., Maccotta, L., Ollinger, J.M., Petersen, S.E. and Buckner, R.L. (
Mizoguchi, C., Kobayakawa, T., Saito, S. and Ogawa, H. (
Nonaka, R. and O'Mahony, M. (
O'Doherty, J., Deichmann, R., Critchley, H.D. and Dolan, R.J. (
O'Doherty, J., Rolls, E.T., Francis, S., Rowtell, R. and McGlone, F. (
Ogawa, H., Ito, S. and Nomura, T. (
Oldfield, R.C. (
Penfield, W. and Faulk, M.E. (
Penfield, W. and Jasper, H. (
Pritchard, T.C., Hamilton, R.B., Morse, J.R. and Norgren, R. (
Sanides, F. (
Schoenfeld, M.A., Neuer, G., Tempelmann, C., Schubler, K., Nowesselt, T., Hopf, J.-M. and Heinze, H.-J. (
Scott, T.R., Yaxley, S., Sienkiewicz, Z.J. and Rolls, E.T. (
Small, D.M., Gregory, M.D., Mak, Y.E., Gitelman, D., Mesulam, M.M. and Parrish, T. (
Small, D.M., Jones-Gotman, M., Zatorre, R.J., Petrides, M. and Evans, A.C. (
Small, D.M., Zald, D.H., Jones-Gotmen, M., Zatorre R.J., Pardo J.V., Frey, S. and Petrides, M. (
Sobel, N., Prabhakaran, V., Desmond, J.E., Glover, G.H., Sullivan, E.V. and Gabrieli, J.D. (
Tomita, H. and Ikeda, M. (
Van de Moortele, P.F., Cerf, B., Lovel, E., Paradis, A.-L., Faurion, A. and Le Bihan, D. (
Author notes
1Department of Sensory and Cognitive Physiology, Faculty of Medical and Pharmaceutical Sciences, Kumamoto University, Kumamoto, Japan, 2Neuroscience Research Institute, Advanced Institute of Science and Technology, Tsukuba, Japan, 3Department of Living Science, Kobe Shoin Women's University, Kobe, Japan and 4Central Radiology, University Hospital, Kumamoto University, Kumamoto, Japan
