


Abstract
The initial outcome of genome sequencing is the creation of long text strings written in a four letter alphabet. The role of in silico sequence analysis is to assist biologists in the act of associating biological knowledge with these sequences, allowing investigators to make inferences and predictions that can be tested experimentally. A wide variety of software is available to the scientific community, and can be used to identify genomic objects, before predicting their biological functions. However, only a limited number of biologically interesting features can be revealed from an isolated sequence. Comparative genomics tools, on the other hand, by bringing together the information contained in numerous genomes simultaneously, allow annotators to make inferences based on the idea that evolution and natural selection are central to the definition of all biological processes. We have developed the MicroScope platform in order to offer a web-based framework for the systematic and efficient revision of microbial genome annotation and comparative analysis (http://www.genoscope.cns.fr/agc/microscope). Starting with the description of the flow chart of the annotation processes implemented in the MicroScope pipeline, and the development of traditional and novel microbial annotation and comparative analysis tools, this article emphasizes the essential role of expert annotation as a complement of automatic annotation. Several examples illustrate the use of implemented tools for the review and curation of annotations of both new and publicly available microbial genomes within MicroScope’s rich integrated genome framework. The platform is used as a viewer in order to browse updated annotation information of available microbial genomes (more than 440 organisms to date), and in the context of new annotation projects (117 bacterial genomes). The human expertise gathered in the MicroScope database (about 280,000 independent annotations) contributes to improve the quality of microbial genome annotation, especially for genomes initially analyzed by automatic procedures alone.
Database URLs: http://www.genoscope.cns.fr/agc/mage and http://www.genoscope.cns.fr/agc/microcyc
Introduction
Since the mid-eighties, laboratories world-wide have endeavoured to determine the complete genomic sequences from all kinds of living organisms. Large-scale genome sequencing and the exponential use of high-throughput approaches have produced a vast amount of new information that has completely transformed our understanding of hundreds of species. At the time of writing, there are almost 1,000 publicly listed complete bacterial and archaeal genomes in the GOLD database (http://www.genomesonline.org). In parallel, novel sequencing technologies (Roche/454, Illumina/Solexa, Applied Biosystems/SOLiD, etc.) are delivering a huge number of new sequences, both finished and draft genomes, all of which call for continuous improvement of genome annotation procedures. Interpretation of raw DNA sequence data involves the identification and annotation of genes, proteins, and regulatory and/or metabolic pathways. This process is typically performed using sequence annotation pipelines (i.e. a variety of software modules) and, in some cases, human expertise to handle the annotations generated automatically. While gene calling programs are very accurate for prokaryotes, the functional annotation of the predicted coding sequences (CDSs) remains a difficult task, especially for organisms never before studied by experimental biology. Moreover, the increasing number of newly sequenced genomes is proving hard to manually curate. This leads to erroneous or incomplete annotations being often carried over into the public resources, and which are difficult to correct (1). For this reason, parallel resources such as HAMAP (2) and NCBI’s ProtClustDB (3) have been developed with the aim of gradually increasing the quality and completeness of functional annotations. These significant efforts remain however restricted to large and widespread protein families. As a result, they cannot replace specialized and expertly curated microbial resources. Microbial genome datasets are also incorporated into other resources such as SEED (4) and IMG (5) which further revise annotations that may be inaccurate and sparse. Other thematic resources provide mechanisms with different degrees of complexity for annotation peer-review, usually for specific organisms [PeerGAD (6), PseudoCAP (7)] or groups of related organisms [ASAP (8)]. Finally, the Ensembl platform has been recently extended to microbial genome analyses and aims to work with all sections of the scientific community in order to compile the best annotations for every genome (9).
Most of the existing annotation platforms generate automatic annotations, and provide graphical facilities for subsequent manual review of the predictions. Examples of comprehensive annotation systems include commercial systems, such as ERGO (10) or Pedant-Pro [successor of PEDANT (11)], and open-source systems, such as GenDB (12), Manatee (unpublished), SABIA (13) and AGMIAL (14). In the study of microbial genomes, the increasing number and the diversity of sequenced genomes have led to the development of novel methods for the contextual analysis of genes and proteins, in order to detect functional constraints on genome evolution (15–17). Although results from these methods clearly demonstrate the added-value of genomic context analysis in the process of prokaryotic genome annotation, only few existing annotation systems systematically integrate them. This is the case of the SEED (4) and IMG (5) resources which offer the visualization of conserved synteny results (i.e. gene clusters that share locally conserved chromosomal organization). While SEED focuses on global metabolic pathway annotation, the expert review version of the IMG system (IMG ER) provides support to scientists for functional annotation and curation of their microbial genomes of interest (18).
In the context of the French National Sequencing Center (CEA/DSV/Institut de Génomique/Genoscope), we have developed a platform, named MicroScope, to support microbial genome (re)annotation and comparative analysis. A first version of the system has been published in 2006 (19). In comparison to the other previously mentioned resources, MicroScope enables curation in a rich comparative genomic context and is mainly focused on (re)annotation projects which are built in close collaboration with microbiologists working on reference species. Furthermore, many functionalities have been developed to ease the expert annotation process and to notably improve the final annotation quality of the analyzed genomes.
MicroScope was initially dedicated to the annotation and analysis of Acinetobacter baylyi APD1, the first genome to be annotated with the system (20), and was made available to biologists who did not have the required computing infrastructure to perform efficient annotation and analysis of their bacterial genomes sequenced at the Genoscope. Very quickly, our system rapidly became a free of charge ‘service’ to the scientific community, within the framework of collaborative projects. Although the user-friendliness of the tools integrated into the platform is very much appreciated, we also realized that the continued support and assistance to MicroScope users is an imperative in the context of our collaborative projects. Starting with a short description of the improved MicroScope automatic annotation pipeline, together with the set of new comparative tools, this article focuses on the use of various functionalities for filling annotation gaps and for carrying out review and curation processes (i.e. detection of missing genes or wrongly annotated genes, genes without predicted functions, and missing enzymes in metabolic pathways). Our system is currently being used for the genome analysis and curation of over 140 microbial genomes. The data from published genomes (27 bacterial genomes since 2004) as well as re-annotated ones are available in the MicroScope database. In addition, for these available genomes, all the graphical functionalities described in this article can be freely accessed via the Magnifying Genome (MaGe) Web interface (http://www.genoscope.cns.fr/agc/mage).
Overview of the MicroScope platform
The MicroScope platform consists of three main components (Figure 1) which are briefly described in this section. A more complete description of these components can be found in (19).
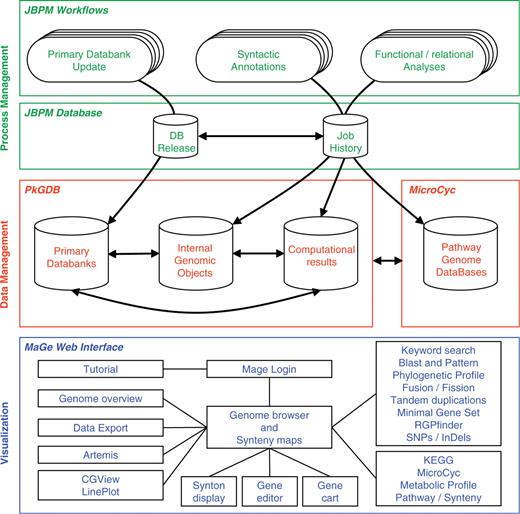
The three components of the MicroScope platform. The MicroScope deployment diagram presents three software architecture components: (i) in green, the process management system based on jBPM framework which orchestrates all the analyses of the annotation pipeline, (ii) in red, the PkGDB and MicroCyc databases which respectively manage genomic and metabolic data, and (iii) in blue, the MaGe Web interface which is directly connected to the databases and allows users to browse and edit data.
The three components of the platform
The process management system orchestrates the annotation pipeline in which primary databanks [e.g. UniProt (21), NCBI RefSeq microbial genomes (22), Enzyme (23), etc.] are used as input for further genome analyses. The syntactic analysis combines a set of programs [e.g. AMIGene (24), tRNAscan-SE (25), RNAmmer (26), Rfam scan (27)] to predict genomic objects which are mainly CDSs and RNA genes. In the case of published sequenced genomes, missing genes, or wrongly predicted genes are checked by the MICheck procedure (28). More than 20 bioinformatics methods are then used for functional and relational analyses: homology search in a generalist databank [UniProt (21)] and in more specialized databases [COG (29), InterPro (30), PRIAM profiles for enzymatic classification (31)], prediction of protein localization using TMHMM (32), SignalP (33) and PsortB (34) tools, computation of synteny groups with all available complete and incomplete (WGS section at NCBI) proteomes, metabolic network reconstruction using Pathway Tools (35). This fully automated first round of annotation ends with a functional assignation procedure to infer, as precisely as possible, specific function(s) for each individual gene.
Primary data and computational results must be logically and consistently organized in a non-redundant way: this can be achieved by the definition of ad hoc data models and the use of efficient database management systems (Figure 1). The core structure of the Prokaryotic Genome DataBase (PkGDB) stores information on organisms, sequences and genomic objects (RNA genes, CDSs, etc.), either from a newly sequenced genome or from bacterial genomes available in public databanks. Results of the analysis tools implemented in the MicroScope pipeline are stored in specific relational tables, together with the primary data used by the methods. Finally, the PkGDB database architecture supports integration of automatic and human-curated annotations, and records a full history of all the modifications. A single instance of the database gathers the data for all the genome projects. This structure makes the collaborative annotation of microbial genomes easier, but implies that annotator accounts and rights on sequences are properly managed. Each user has a personal account and belongs to one or several groups. Specific consultation and modification rights on the sequences are defined at the level of these groups. The set of annotated Enzyme Commission numbers (EC numbers) is the starting point for metabolic pathway reconstructions. The MicroCyc database gathers instances of the BioCyc scheme (35) for each prokaryotic genome being integrated into PkGDB (almost 440 today, of which 270 correspond to public genomes). These Pathway Genome DataBases (PGDBs) are made available at http://www.genoscope.cns.fr/agc/microcyc. In order to regularly update this resource according to novel expert functional annotations performed by users, the metabolic pathway predictions are re-run daily.
It is of paramount importance that all of the data previously described (primarily genomes, analysis results and annotations) be made appropriately accessible to biologist users, facilitating the efficient curation of annotations and the development of novel hypotheses about specific genomes or sets of genes which can then be experimentally tested. The user-friendliness of the platform is thus a cornerstone of its design, and requires that much thought be spent on the human/machine interface, where the end user is often an experimental biologist. The MaGe Web interface (http://www.genoscope.cns.fr/agc/mage) is the third component of the MicroScope platform (Figure 1). It consists of numerous dynamic web pages containing textual and graphical representations for accessing and querying data via authenticated or anonymous connections. Initially, one of the main objectives of MaGe was to allow experts to make relevant annotation using (i) a gene annotation editor giving access to the results of each executed method and links to common useful resources, and (ii) synteny results and metabolic network predictions, the combination of which is very helpful to make hypotheses about the biological function of un-annotated genes. However, since its first publication (19), MicroScope has grown into a more complex system that can be used to efficiently explore and compare the set of prokaryotic genomes stored in PkGDB.
New features added to MircoScope in the last 3 years
Process management system enhancement
To face the rapid growth of new genome projects and the increasing size of public databanks, analysis pipelines require a robust automated task management system. In an effort to meet these requirements and to orchestrate automatic and human tasks, we have built a workflow manager using the jBPM open-source framework (Java Business Process Management; http://www.jboss.org/jbossjbpm). jBPM offers a specific language to define workflows as well as a Java Application Programming Interface (API) to customize workflow tasks and to manage execution of process instances built from workflow definitions. One functionality of jBPM is to continually backup the current internal state of process instances into a database (Figure 1, jBPM database). This persistent execution context allows administrators to resume a failed process and to keep detailed data about running tasks and computation parameters. Three workflows were designed (Figure 1). One automatically updates the local copies of the primary databanks which are stored into the PkGDB database by periodically checking remote servers for new releases. A second one orchestrates bioinformatics software in charge of syntactic analyses. The last workflow keeps functional and relational analyses up to date: updates are made in case of new genomic entries, primary databank releases or new software versions. These three workflows are synchronized by jBPM and several new microbial genomes can be handled simultaneously. Thus, genome analyses remain up to date and immediately available in PkGDB without using a database versioning solution.
Keyword search and gene carts
The MaGe ‘Keyword search’ has been extended to make complex queries on the data stored in PkGDB (i.e. the annotations and the results of each method used in the analysis pipeline). The query can be made for one or several chromosomes and each query result can be refined with further queries. An example of its use is given in the sub section ‘Curation of genes without a product name’. Furthermore, at any level of the MaGe interfaces the gene list that results from the corresponding search/analysis can be selected for inclusion into a ‘Gene Cart’. The user can manage several ‘Gene Carts’ at the same time, resulting from different queries. A specific interface has been developed to perform various operations such as the intersection or the difference between two gene carts, to extract sequences or to run multiple alignments via the plugged Jalview software (36).
Comparative genomics
Comparative analysis of genomes is provided in MaGe through a number of tools like the ‘Phylogenetic profile’ functionality which finds unique or common genes in the query genome with respect to other genomes of interest. Furthermore, information on synteny groups, combined with the set of metabolic pathways predicted for each genome, can also be used in the ‘Pathway / Synteny’ functionality. This tool computes groups of genes that share a conserved synteny and an identical metabolic pathway defined in KEGG (37) or MicroCyc PGDBs. The new ‘LinePlot’ functionality draws a global graphical representation of conserved syntenies between two selected genomes. Moreover, we have developed a new method to detect Regions of Genomic Plasticity (RGPfinder, in preparation). In a first step, it detects synteny break points in a query genome by comparing it to closely related bacterial genomes. In a second step, the method combines compositional bias data in the query genome with the search, at the borders of the synteny break points, for mobility genes, tRNA and direct repeats if any. In the example shown in Figure 2A, the commensal Escherichia coli IAI1 strain is compared with 10 other E. coli strains using the RGPfinder tool implemented in MaGe. Among the 66 predicted regions, several harbor characteristic features of genomic islands (38), i.e. tRNA or IS elements (Figure 2A), and others have only been detected by synteny break points. This is the case of GR19, the composition of which is shown in Figure 2B: the region is made up of a cluster of genes coding for enzymes involved in the phenylacetate degradation pathway. Only two other E. coli commensal strains, K12 and HS, share this region with IAI1. Coming back to the MaGe cartographic representation (icon glass on the left of Figure 2B), this observation is obvious: a clear synteny break is shown between the E. coli core genome and this metabolic region which is absent in pathogenic strains (Figure 2C).
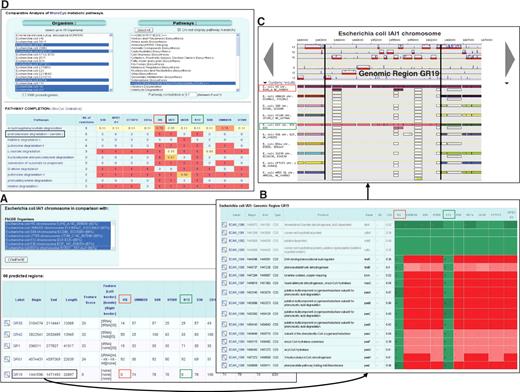
Comparative genomic functionalities in MaGe. A query result of the RGPfinder tool is shown in (A). In this example, E. coli IAI1 is compared with 10 other E. coli strains. A total of 66 regions of genomic plasticity are predicted. These regions are summarized in a table that displays their chromosomal location, the presence of genomic island features, and a specificity score for each compared strains. A detailed view of the predicted regions is available as shown in (B) for the region GR19. This region contains a gene cluster (i.e. the paa-operon) coding for enzymes of the phenylacetate degradation pathway. As shown by the colour code (i.e. green for the presence of a homolog gene, red for the absence), only two others E. coli strains (K12 and HS) share this region with the IAI1 strain. The synteny break points between the E. coli core genome and this metabolic region can be visualized using the cartographic representation of the synteny results (C). On these maps, a rectangle represents a putative homolog in the compared genome and a group of rectangles of the same color indicates a conserved synteny. (D) Shows the ‘Metabolic Profile’ functionality. The metabolic networks of eleven E. coli strains are compared in respect to pathway completion. In this example, only MicroCyc degradation pathways are selected and the pathway completion threshold is set to 0.7. Results are summarized in a table which gives, for the 11 selected strains, completion values for each pathway. Results confirm that the phenylacetate degradation pathway is complete in only three E. coli strains (IAI1, K12 and HS).
Comparative metabolic networks
Several relational tables were designed in PkGDB to store information on MicroCyc PGDBs together with the KEGG metabolic pathways and modules (37). These two sets of predicted pathways can subsequently be used in the ‘Metabolic profile’ functionality recently implemented in MaGe. Starting with the MicroCyc or KEGG data, the user can choose from two up to fifteen organisms and select a subset or all the metabolic pathways from the classification implemented in KEGG or MetaCyc (39) (top of Figure 2D). For each predicted pathway x in a given organism, a pathway completion is computed which corresponds to the number of reactions found in the genome divided by the number of reactions in pathway x. This value can be computed taking into account information on annotated pseudogenes (top of Figure 2D). The result of the query is shown in pane D of Figure 2 (bottom) in which, for each analysed metabolic pathway, the value of its completion in the compared genomes is given (it ranges between 0 = absence of the pathway, and 1 = complete pathway). This representation is more informative than the one proposed in the corresponding BioCyc functionality (http://biocyc.org/comp-genomics) where a cross means a predicted pathway, regardless of its completion. In the example shown in Figure 2D, the second line confirms that the phenylacetate degradation pathway is complete only in the three E. coli commensal strains (K12, HS and IAI1).
Annotation curation tools
High-throughput and low-cost sequencing methods have resulted in ever-increasing sequencing capabilities, and most often the resulting genomes receive only automatic annotation, with very little input from human expertise. Consequently, although bioinformatics tools are continually improving, some genomes remain poorly annotated, especially those of prokaryotic genomes that are evolutionarily distant, and very different from the minuscule fraction of microbial species we know today. Indeed the biology of such organisms presents numerous exceptions or novel features, and the meticulous work of expert annotation is very often the only way to discover such novelties. To ease this tedious task, several tools have been implemented in MaGe, from a very complete gene editor to specific tools which point out missing or problematic annotations.
Gene editor
Protein products predicted for genes are one of the main targets of genome annotation review. This information is available in the gene editor, and is dispatched in two sections: (i) The ‘Automatic annotation’ section contains the results of our automatic functional annotation procedure which involves the transfer of the reliable up-to-date reference annotations to ‘strong’ orthologs if any, in newly sequenced genomes (19). This information is regularly re-computed taking into account updates of the primary data and new expert annotations performed by the MaGe users. (ii) The ‘Gene validation’ section allows the user to modify, delete and add information. Since the free-text description used in the product field of the gene editor is exposed to inconsistencies across genes and genomes, we also integrated enumerated lists of well defined and non-redundant terms corresponding to MultiFun (40) and TIGRFAMs (41) functional classifications. In addition, annotation homogenization is achieved via a procedure which is automatically launched when gene annotations are saved in the database. This minimizes the required checking of the annotation coherence. Finally, to provide support for reviewing functional annotation, a summary of available method results are visualized in a completely customizable list which includes pre-computed list of homologs and synteny groups. This integrative strategy allows annotators to quickly browse functional evidence, tracking the history of an annotation and checking the gene context conservation with an orthologous gene having an experimentally demonstrated biological function.
Gene prediction curation
Although very accurate for prokaryotes, gene calling programs are still liable to miss small genes or genes of atypical nucleotide composition. In addition, an increasing number of genomes are being released in ‘draft’ form with high sequencing error rates, thus leading to errors in gene predictions. To facilitate the annotation review of genes that may have been missed by the gene prediction pipeline, the ‘Phylogenetic profile’ functionality can be used to find genes in a genome of interest that are present or missing in other closely related genomes. We also added a tool which searches for homologs in a list of 206 protein-coding genes proposed by Gil et al. (42) as the minimal gene set necessary for self-maintenance and reproduction in the presence of a full complement of essential nutrients and in the absence of environmental stress. This ‘Minimal gene set’ functionality is very useful to point out missing genes, such as small ribosomal proteins or even amino acid tRNA synthetases. When a potential missing gene is found, MaGe provides the curation tools needed for searching for it (TblastN, search translated chromosome sequence using a protein query), and for creating this gene on the query genome (i.e. creation of a new genomic object). Start codon and ribosome binding site regions can be easily adjusted using the Artemis software (43) which has been connected to MaGe. Another tool allowing dynamic computation of the list of overlapping CDSs in the query genome is available in the ‘Genome overview’ functionality. The user can then return to the MaGe cartographic representation to modify the start codon position of a gene or to remove it in the case of a false prediction. Finally, to facilitate the annotation of pseudogenes (resulting either from sequencing errors or from true mutations in the chromosome), gene fission events can be dynamically computed using the ‘Fusion / Fission’ item of the ‘Explore’ window: the procedure detects synteny groups having two genes from the query genome corresponding to a single annotated CDS in the compared genomes. BlastP correspondences are evaluated to exclude the detection of tandem duplications by keeping only non-overlapping side-by-side alignments. The annotator can quickly browse the results and check for possible pseudogenes, ordering results by a score which reflects the exceptionality of the event.
Curation of genes without a product name
Although a number of annotation sources are very accurate, continual updating of genome annotations for a large number of species is not straightforward (1). Indeed, databases and computational methods are constantly evolving and the re-processing of automatic functional annotations should be performed on a regular basis. In addition, new experimentally-derived functional information is being regularly generated, and can prove useful, for example, for modifying the annotation of genes of ‘putative’ or ‘unknown function’. This requires systematic exploration of bibliographic references using the PubMed server (44), an element of paramount importance for collecting sound fundamental knowledge about model organisms. This is the reason why we decided to keep two sets of results from the homology searches against the full non-redundant protein sequence databank UniProt (21): the first one is composed of the best hits (in terms of e-value) obtained with the SwissProt section, plus the other best hits obtained with the TrEMBL section (twenty results are kept). The second one consists of the TrEMBL and the SwissProt best hits having a PubMed cross-reference (RT lines in the UniProt file format) different from the complete genome publication, if any (20 other results are kept). In the list of blast results available in the MaGe ‘Gene Editor’ (see ‘Gene editor’ section), such homology results are flagged using the term ‘IPMed?’ (meaning: ‘maybe this UniProt entry has an experimental validation’), with direct links to the PubMed server. Indeed, there is a non-negligible fraction of TrEMBL entries (about 100,000 entries) linked to an informative PubMed publication, the functions of which may not be represented by other similar proteins in SwissProt.
Figure 3 illustrates the way a user can explore the results of these similarity searches stored in PkGDB, especially when a recent update of blastP computations has been performed on the proteome of an already annotated genome. The query shown in Figure 3 corresponds to the following sentence: ‘Find the Ralstonia solanacearum genes currently annotated as (conserved) hypothetical protein and having similarities with TrEMBL or SwissProt entries not annotated as hypothetical protein (or uncharacterized) and linked to a possibly interesting PubMed entry’. Using the ‘Keyword search’ functionality implemented in MaGe, the query is performed in two steps: in the first one, R. solanacearum genes for which the annotation of the product field contains ‘hypothetical protein’ are searched for. The result gave 1,357 candidate genes (Figure 3, part 1). Then, the two datasets (i.e. PkGDB relational tables) containing blast hits obtained with TrEMBL and SwissProt and linked to a possibly interesting PubMed entry (respectively ‘TrEMBL EXP’ and ‘SwissProt EXP’ datasets; Figure 3, part 2) are used. In this second step of the query, the ‘Explore more’ button is used to search for previous gene candidates (among the 1,357) similar to proteins of these two datasets (identity at least 40% over the overall length of the two proteins) which are not annotated as ‘hypothetical’ or ‘uncharacterized’. The query returned 56 R. solanacearum genes (Figure 3) which have 20 blast hits in the ‘SwissProt EXP’ dataset and 72 in the ‘TrEMBL EXP’ dataset. The functional annotations of the corresponding gene candidates can then be updated accordingly.
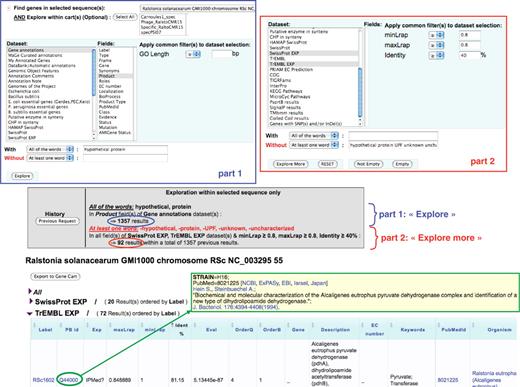
‘Keyword search’ functionality in MaGe. The query is performed in two steps: (i) in the ‘gene annotation’ dataset, searching for R. solanacearum genes which contain the term ‘hypothetical protein’ (With—all of the words) in the ‘product’ field (section part 1). (ii) in the two datasets ‘TrEMBL EXP’ and ‘SwissProt EXP’ (see text for details), searching for genes of the previous query which are similar (identity at least 40% over the overall length of the two sequences) to protein entries of which the description (DE line) does not contain any of the words (Without—at least one word) ‘hypothetical protein UPF unknown uncharacterized’ (section part 2). The query (‘Explore’ and then ‘Explore more’) returned 56 R. solanacearum genes which have 20 blast hits in the ‘SwissProt EXP’ dataset and 72 in the ‘TrEMBL EXP’ dataset. The beginning of the TrEMBL list shown in the figure has been sorted by Identity %. The first result is the RSc1602 gene (annotated as ‘hypothetical protein’), similar to the TrEMBL entry Q44000 (81% identity) which is linked to a paper (PubMed = 8021225) published in 1994 and describing a pyruvvate dehydrogenase complex and a new type of dihydrolipoamide dehydrogenase in Alcaligenes eutrophus.
Finding missing enzymes
Starting from genome annotation, metabolic network prediction is necessary in order to have a more global and dynamic view of an organism. This reconstruction process remains difficult and requires continuous feedback from individual gene annotations. A frequent problem is the existence of ‘reaction holes’ in predicted metabolic pathways (i.e. reactions which do not have correspondingly annotated genes in the organism’s genome).
The ‘Pathway / Synteny’ explore functionality of the MaGe interface allows annotators to retrieve groups of genes in a given organism which share conserved syntenies and which encode, for at least two of them, enzymes involved in a same metabolic pathway. Using this interface, annotators can quickly check for reaction-hole candidate coding genes among the conserved miss-annotated genes of a given group. This MaGe functionality is illustrated by an example in Figure 4. The genomic region ACIAD3536–3542 of the A. baylyi chromosome presents seven genes which show a conserved synteny with about 200 microbial genomes. Among them, two genes (ACIAD3541, 3542) encode enzymes involved in the last two steps of the purine degradation pathway: the conversion of allantoate to glyoxylate (allantoicase and ureidoglycolate amidohydrolase activities). The ‘purine metabolism’ KEGG map (drawn via the MaGe interface) shows that four reaction steps are missing in A. baylyi: the degradation of urate to allantoate. In the ‘70s, genes involved in the purine degradation were shown to be physically linked on the chromosome of Pseudomonas aeruginosa (45). This experiment concurs with the observed synteny conservation and then consolidates the hypothesis that the remaining five genes (ACIAD3536–3540) may be candidates to fill the observed reaction holes. Annotation of these genes was then evaluated manually by checking similarity results with UniProt entries linked to an experimental validation (‘IPMed?’ flag in MaGe) and by querying the PubMed server for newly characterized protein functions still not recorded in UniProt. Following this curation process, the candidate genes were confirmed for the four missing reactions (blue dashed arrows on Figure 4) and led to substantial modifications of their functional description (Supplementary Table S1).
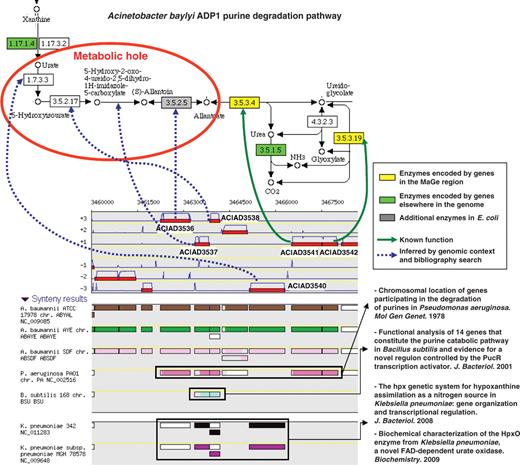
Missing enzymes in the Acinetobacter baylyi ADP1 purine degradation pathway. The genomic region ACIAD3536-3542 of A. baylyi contains seven genes which share conserved syntenies in several other microbial genomes. Two of them encode enzymes involved in the last two steps of the purine degradation pathway (KEGG metabolic map 230). After human expertise, candidate genes were validated for the four missing reactions (blue dashed arrows).
Status of the MicroScope platform
The MicroScope platform can be used either for the annotation of novel genomes or for curation of already annotated genomes available in public databanks (i.e. re-annotation projects). The access to the platform is available upon request, with priority given to microbial genomes being sequenced at Genoscope.
Service associated with MicroScope
To start a new project, the set of public genomes which are of interest in the context of the project are integrated into PkGDB, following a syntactic re-annotation process developed by our team (28). Both complete and unfinished genomes are integrated in our database. The sequence(s) of the novel genome(s) are then submitted to the complete annotation pipeline analysis, including computation of synteny results with all the available proteomes in PkGDB and in the NCBI databank (complete and WGS RefSeq sections). All data related to a new project is stored in PkGDB and made available to the research teams. In addition, the portion of the database information corresponding to microbial genomes available in public databanks is made freely accessible via the MaGe interface.
As soon as a new project is ready, the participants can follow a four-day training course organized by our team (http://www.genoscope.cns.fr/agc/mage/training). Using the data related to their own project, attendees learn how to change or correct the current automatic functional annotations, and how to perform effective searches and analyses using the graphical functionalities of the MaGe interface. Moreover, continuous support to the biologists using MaGe is a primary activity of our group. These regular exchanges are the most efficient means of performing continual evolution of the platform in response to user needs. Indeed, in addition to the intuitive use of the MaGe graphical interface, the short response time and the quality of feedback to individual queries is an aspect of the MicroScope service which is highly appreciated.
Finally, updates and maintenance of the MicroScope projects are performed when a new version of the annotated sequence is available, when a new public bacterial genome needs to be integrated in PkGDB, and when updates of the primary data (e.g. UniProt, RefSeq proteomes) are available. As shown in the previous section, these updates are very important because of the very short ‘lifetime’ of many functional annotations of protein genes.
MaGe users and collaborative publications
MicroScope projects are most often initiated with biologists from French laboratories. However, collaborations with other researchers in the world have extended the use of the MaGe Web interface to other countries. To date, we manage a total of 61 projects containing 117 newly sequenced microbial genomes (of which 77 from Genoscope). In the context of these projects, more than 300 publicly available bacterial genomes have also been integrated in PkGDB, taking advantage of our structural and functional re-annotation process. At this moment, the platform includes a total of 614 users who have a personal account, of which 399 are French users, 111 from the European Union, 53 from the United States and 51 from other countries. Since 2004, this large community has evaluated more than 280,000 expert annotations on about 190,000 distinct genes (with a mean value of 3,000 genes being annotated a month). These expert annotations have become the starting point for the automatic functional annotation of new genes.
The MicroScope projects allow the initiation of new collaborations with various teams of microbiologists. Our involvement in the expert annotation step of a new bacterial genome, in the execution of additional bioinformatics analysis and in the preparation of illustrations for further publications, depends on the local collaborator’s competences. In 2004, the first complete bacterial genome published with the platform was Acinetobacter baylyi ADP1 (20). Since this date, 26 other complete bacterial genomes have been published (http://www.genoscope.cns.fr/agc/mage/publications), 18 of which are environmental bacterial genomes (e.g. Pseudoalteromonas haloplanktis, Herminiimonas arsenicoxydans, Bradyrhizobium sp., Methylobacterium sp.) and 8 are pathogenic bacterial genomes (e.g. Acinetobacter baumannii, E. coli strains). In addition to these ‘genome’ papers, specific types of analysis such as genomic or metabolic comparative analysis, Genomic Island (GI) characterization, transcriptomic and proteomic analysis, have also been performed in the context of several MicroScope projects and described in 13 additional articles. Finally, our group is also involved in several metagenomics projects which aim to produce an inventory of the microorganisms present in specific environments. Several large genomic regions and almost completely re-constructed chromosomes from yet uncultivated microorganisms have been annotated and analyzed, giving us the opportunity to propose specific culture media for enrichment cultures for the corresponding bacteria (46), or to make an inventory of the metabolic capabilities of the population in order to provide an integrated picture of the cooperative metabolic interactions at work inside an ecosystem (i.e. an arsenic-rich ecosystem, Bertin et al., submitted).
Future directions
MicroScope will be extended in terms of data content and functionalities. It aims to continuously increase the number of genomes integrated into the system from public and local resources, following the idea that the value of genome analysis increases with the number of genomes available as a context for comparative analysis. For this reason we wish to integrate the complete set of available bacterial genomes (almost 1,000 to date) in the system and to run our re-annotation process taking into account expert annotations stored in PkGDB. Improved Web interfaces will be developed in order to facilitate the exploration of a rapidly increasing number of genomes, genes, and annotations. One important objective is to make all PkGDB data and the MaGe comparative analysis tools (such as genomic island prediction and genomic and metabolic content comparisons) accessible to the scientific community at large. Furthermore, a web repository will make bulk downloads of MicroScope data available, and this will allow users to carry out large-scale analyses on it. In terms of functional annotation updates, new methods allowing one to check the functional annotation consistency of a given genome will be developed. These will automatically pinpoint discrepancies between the set of current functional annotations of a genome and the one given by the automatic procedure which is regularly re-executed taking into account updates of the primary data and expert annotations stored in PkGDB. Moreover, to facilitate simultaneous annotation of one or several genomes for which a closely related species considered as a reference genome is already available, an ideal strategy would include two steps: first, an update of the reference genome annotation, and second, the annotation of the new genomes based on the re-annotated one. We plan to develop a procedure that relies on the ability to cluster proteins from related genomes into orthologous groups and new MaGe interfaces allowing annotators to view evidence associated with each protein in the cluster and make annotation decisions about the group as a whole. Finally, several methods will be integrated in the automatic pipeline, such as the prediction of small non-coding RNAs, the classification of transporter genes using the TCDB database (47), and the prediction of operon structures. The development of a new editor allowing the annotation of ‘complex’ genomic objects (such as insertion sequences, transcription units) will be also required.
Next Generation Sequencing (NGS) provides huge amounts of data in a single run, which may be used to solve a wide variety of issues in the field of prokagenomics. To date, we use NGS data to address the problem of single nucleotide polymorphism (SNP) and Insertion/Deletion (InDel) event detection in the frame of evolutionary projects where the sequences from several related organisms (or clones of the same species at different generation times) are compared. Actually, the problem of discriminating between true mutations that have occurred during evolution and sequencing errors (in the reference sequence or in the new sequence data) is a challenging task. In this context, we started to design a pipeline called SNiPer (Cruveiller et al., unpublished) to compute SNPs/Indels between orthologous genes in different organisms. New relational tables are currently being created in PkGDB which gather these results and easily link them to already stored data in order to answer fundamental questions such as: Are the genes involved mostly global pleiotropic regulators or do some mutations also affect narrow-spectrum genes? Do mutations affect gene stability or active sites or mainly regulatory regions? Furthermore, we plan to design a new graphical interface enabling the visualization of mutated regions and their in-depth analysis (lists of potentially altered genes, multiple alignments, etc.). All these new developments will be the starting point for the use of our platform in the context of other NGS applications, mainly RNA-seq and discovery of non-coding RNAs. Combined with the results of our annotation pipeline and with proteomic analysis if performed, these new data will contribute to the refinement of genome annotation.
The quality of the homology-based reconstruction of metabolic networks depends highly on annotation quality, metabolic database completeness and the criterion for assessing the presence of a pathway. Although public metabolic collections includes an extensive set of pathways from all species (37,39), there is a limited notion of variants of the same pathway, corresponding to alternate routes which can transform the same set of compounds (i.e. ‘variants’ allows one to take into account metabolic variation between species). The availability of sets of pathway variants for a critical mass of species should bring about a qualitative change in our capability to annotate new species. The project of developing a new resource to extend the reach of systematic genome annotation to metabolic networks will start this year (Microme European project PF7). The corresponding efforts in bioinformatics infrastructure and process development, computational methods integration, and curation will constitute the core of this project. We will participate actively in the specifications of the new projection tools, the development of curation interfaces, and the automated scripts for data integrity checking. Training sessions will be built on our successful MicroScope training programme, and will target both end-users (microbiologists and biochemists) and actual or potential curators (experts on a specific organism or pathway).
Funding
French Centre National de la Recherche Scientifique (CNRS UMR8030) and the French Ministry of Research (funds allocated by the ANR PFTV 2007). Funding for open access charge: Commissariat à l'Énergie Atomique (CEA, France).
Conflict of interest statement: None declared.
Acknowledgements
The authors would like to thank all MaGe users for their feedback that helped greatly in optimizing and improving many functionalities of the system. The authors thank the entire system network team of Genoscope for its essential contribution to the efficiency of the platform.
