


Abstract
The Caenorhabditis elegans genome sequence was published over a decade ago; this was the first published genome of a multi-cellular organism and now the WormBase project has had a decade of experience in curating this genome's sequence and gene structures. In one of its roles as a central repository for nematode biology, WormBase continues to refine the gene structure annotations using sequence similarity and other computational methods, as well as information from the literature- and community-submitted annotations. We describe the various methods of gene structure curation that have been tried by WormBase and the problems associated with each of them. We also describe the current strategy for gene structure curation, and introduce the WormBase ‘curation tool’, which integrates different data sources in order to identify new and correct gene structures.
Database URL: http://www.wormbase.org/
Introduction
The publication of the Caenorhabditis elegans genome was a magnificent achievement for the 1990s (1). A decade has passed, sequencing technologies have changed and many new nematode genomes are being sequenced (2). C. elegans is a model organism and is the reference for all parasitic and non-parasitic nematode genomes, so the work continues to use all available experimental data to refine the gene structures.
The curation methods described in this article should be of interest both to those who wish to know how the C. elegans gene structures were derived and to curators of other organisms who might be able to adapt some of the techniques described in this article to their own curation efforts.
The genome sequencing project was split between the Washington University Genome Center (UWGC) and the Wellcome Trust Sanger Institute (WTSI). This yielded the first complete genome sequence from a multi-cellular organism. A WormBase group at each centre continues to take responsibility for curating the gene structures in the clones produced at each centre. Thus, each centre is responsible for curating approximately half of the genome. Until 2007, there were a small number of clones that did not conform to this division, because telomeric clones and some of the final gaps were also maintained by the WTSI. In collaboration with EMBL (3) and GenBank (4), responsibility for the clones owned by the ‘wrong’ group was transferred to the group maintaining the corresponding half of the genome, thus simplifying distribution and data storage.
The California Institute for Technology (CIST) has made a substantial contribution to the WormBase project by developing the WormBase web interface and curating the bibliographic literature and many other types of data such as the microarray expression data, RNAi data, serial analysis of gene expression (SAGE) data, the phenotype data, cell lineage data and anatomical data. Responsibility for the WormBase web site has recently moved from CIST to the Ontario Institute for Cancer Research.
The analysis and study of this complex organism has continued, leading to many refinements to the underlying genome sequence and the predicted gene set. Since the initial publication, there has been a huge increase in the amount and types of data available for use as supporting evidence for gene structures, and over the years WormBase has developed tools and methodologies to deal with this new data.
This article describes the curation of the WormBase C. elegans gene structures and genomic sequence and introduces the WormBase ‘curation tool’. This is a tool for coordinating and directing the curation efforts of the two curation teams.
Gene model curation in C. elegans
In WormBase, gene model curation refers to the determination of the correct exon structure of protein coding genes and, where possible, pseudogenes. All new protein-coding structures and pseudogenes are now manually curated. There are currently 49 423 curated gene loci in C. elegans, of which 20 403 are protein coding and 27 588 are non-coding RNA genes. Of the 20 387 protein-coding genes, 3034 gene loci have expressed sequence tag (EST) or trans-splicing evidence that they produce two or more protein isoforms, giving 24 891 coding sequence (CDS) structures in total. There are 1432 pseudogenes. Most of the other species in WormBase are expected to have similar numbers of genes. The non-coding genes are largely based on importing data from databases such as mirBase (5) and Rfam (6) with minimal manual curation.
Most of the initial C. elegans coding gene structures were determined by the gene prediction program Genefinder (Green,P., unpublished data), but subsequent refinement of the structures have been done manually using supporting evidence from various sources such as nucleotide and protein alignments, other experimental evidence and WormBase users’ input, as well as sequence features associated with the regulation of the genes and their transcripts.
The numbers of C. elegans coding sequences have increased fairly steadily over the last 10 years, as shown in Figure 1. Of the 19 099 CDS structures curated at the time of the 1998 C. elegans paper, there are now only 8709 that remain unchanged. There were around 900 curated non-coding genes until recently when several major imports of non-coding genes occurred.
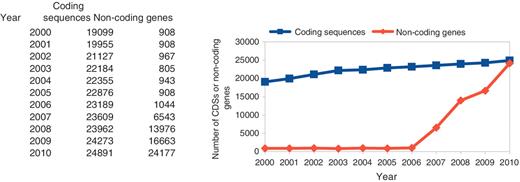
The number of curated CDSs and non-coding genes in C. elegans.
As new gene prediction programs have become available, programs such as Twinscan (7), Jigsaw (8) and mGene (9) have been used to augment the gene structures. Although the focus remains primarily on C. elegans, recently WormBase has been expanded to also include C. briggsae, C. remanei and C. brenneri, and may be expanded further to include some parasitic nematodes.
Gene prediction programs give a reasonable set of gene structures, but the best of them only predict ∼80% of the complete gene structure correctly (10) and although the best gene prediction programs exhibit a similar overall level of sensitivity, they differ in which particular genes are correctly predicted. Caenorhabditis elegans genes with a large number of exons, short exons, long introns, a weak translation start signal, weak splice sites or poorly conserved orthologs pose great difficulty for gene prediction programs (Williams,G.W. and Davis,P.A., personal observation). They can incorrectly predict a coding gene model where the gene is a pseudogene or a pseudogenic fragment and they predict the isoforms of a gene poorly, if at all. They do not use several additional types of information such as the 5′ position of genes as given by trans-splice leader sites, tiling array expression, mass spectrometry peptides or knowledge of a potential genome sequencing error as indicated by a frameshift in homologous protein alignments. The predicted gene structures, therefore, often need to be manually changed.
The WormBase genomes, gene structures and all associated data and genomic features are held in an ACeDB database (11). This is an object-orientated database that can efficiently hold a wide variety of genomic data types. The curators view and edit the gene structures and other genomic features in the ‘feature map (FMAP)’ editor of ACeDB. The data are exported as general feature format (GFF) files with each release of the database for display on the WormBase web site, using GBrowse (12).
Initial gene set
The original gene set of C. elegans was produced by using Genefinder (Green,P., unpublished data). The initial set of genes in some of the non-C. elegans genomes in WormBase were predicted using the methods from nGASP (10), a project to find the best nematode gene prediction method. The most accurate gene finders found by nGASP were ‘combiner’ algorithms, such as Jigsaw, which made use of transcript and protein alignments and multi-genome alignments, as well as gene predictions from other gene finders.
Manual curation
Initially, the majority of C. elegans gene structure changes were based on the alignments of transcript data from large-scale transcriptome projects such as Yugi Kohara’s EST libraries (Kohara,Y., unpublished data) and the ORFeome project (13). This approach was taken because it proved to be a rich source of evidence for correcting gene structure errors because it indicates the exact intron boundaries and covers the exons.
There are also many sources of evidence for curation that do not depend on transcript data. This evidence is more indirect than transcript data and often requires a deduction of the likely structure of the genes based on weak or conflicting evidence. This non-transcript evidence includes protein alignments, mass spectroscopic peptides, conserved protein domains and homology to paralogs and orthologs. These are becoming increasingly useful in the refinement of the gene structures, especially in genes with a low level of expression that often lack transcript data. In the WormBase database release ‘WS220’, only 46.9% of the C. elegans CDS structures have coverage of every base of every exon with EST or mRNA transcript evidence and 8.8% of CDS structures have no transcript evidence at all. It is therefore often necessary to use indirect evidence to deduce the most likely structure of the nearly 55% of CDS structures that are not fully confirmed by transcript data.
Supporting evidence for changes to gene structures comes from a variety of sources, which curators investigate and review while attempting to improve the gene models. Some of the major types of supporting evidence include, in roughly their order of significance for curators:
User input
We receive notifications from the individual users that gene models need attention. These notifications either come through forms on the WormBase web site or from email to the WormBase Help email address. These suggestions are extremely useful. They contain data that might never make it into a publication or that are from an expert in a particular field.
Literature curation
WormBase literature curators at the California Institute of Technology flag publications where data are in conflict with current gene structures or sequence features. These are sent to sequence curators by email for examination and resolution. We encourage people to submit their sequences to public databases, such as GenBank, EMBL or DDBJ, in order to provide a public record of the evidence for any changes made. These sequences will then provide an additional means of linking a change in the gene model to the user’s publication.
Transcript data
Nematode transcript data are routinely extracted from a variety of sources. These include mRNA and EST sequences from the nucleotide databases, the ‘OST’ reverse transcription polymerase chain reaction (RT–PCR) sequences from the ORFeome project (13) and the ‘RST’ sequences which are 5′ and 3′ RACE sequence tags. Recently, we have also been adding data from next-generation sequencing platforms such as Illumina and 454 short-read RNASeq data sets (14). The EST, OST, RST and 454 reads are aligned to the genome using BLAT (15). SAGE and TEC-RED sequences are aligned using a simple Perl string-match and the short-read RNASeq data are aligned using a mixture of MAQ (16) and cross-match (Green,P., unpublished data). Errors identified by transcript alignments are generally of four types. The first, and most obvious, is the absence of a gene model where there is a transcript alignment, which indicates a possible missing gene. The second type of error comes from the comparison of introns defined by a transcript to introns in existing gene structures. If an intron that is confirmed by a transcript does not match an intron in a gene structure, then there is probably a mistake in the gene structure or a new isoform needs to be added. The third type of error comes from the paired-end read information (5′ and 3′ reads from the same clone) of transcript sequences. For instance, the mapping of 5′ and 3′ reads of a single EST clone to different gene predictions is an indication that the two gene structures may need to be merged. Features derived from the analysis of transcript alignments, such as trans-spliced leader (TSL) sequence sites and poly-A addition sites are also used to establish gene or isoform boundaries.
Protein alignments and homology
A variety of protein databases are aligned to the genome using BLASTX (17) to assist in refining gene structures and to identify unannotated genes. These databases include UniProt (18), human proteins from the International Protein Index (19), Drosophila melanogaster proteins from FlyBase (20), Yeast proteins from SGD (21) and C. elegans, C. briggsae, C. brenneri, C. japonica, Pristionchus pacificus and C. remanei proteins from WormBase (2). Alignments of C. elegans proteins are particularly useful for highlighting regions where potential exons are missing in members of a gene family. Alignments to non-elegans proteins are used to identify genes that are not currently annotated and to refine existing gene models. Comparing a gene’s structure, including the position and spacing of the introns, to that of its paralogs and orthologs is often a useful means of confirming or refuting a proposed structure. This is particularly useful when curating partially sequenced nematode genomes, which are still in contigs and so may be too short or of too low-quality for the gene prediction programs to successfully determine a structure. Care has to be taken when using homology to curate a gene’s structure because nematode genes can reciprocally confirm each others’ structures, leading to the material fallacy of ‘arguing in a circle’. Many of the gene structures from other species of nematodes have been based on the structure of their C. elegans ortholog, either directly by referring to the C. elegans gene while manually refining the structure of the gene or indirectly by training gene predictor programs on the C. elegans gene structures and then using these gene predictors to predict genes in other nematode species.
Repeat regions
The C. elegans repeat library is aligned against the genome using RepeatMasker (22), which also finds simple tandem repeats. The C. elegans repeat library has changed little in the last 4 years; however, several ‘repeat motifs’ have been removed because they actually represented common protein domains. Inverted repeat regions are found using the program ‘einverted’ from the EMBOSS project (23), and these regions aid in identifying transposons. Gene models that overlap with repeat regions are carefully inspected, as they are probably incorrect.
TSL sequence sites
These are a feature of many nematode genes where 22 bp sequences are spliced onto the 5′-end of the transcript to form the mature mRNA. The TSL sequence sites are found by comparing the 5′-end of the transcript data for matches to the known TSL sequences and are also deduced from the trans-spliced exon-coupled RNA end determination (TEC-RED) project (24). These sites therefore indicate the 5′-end of an mRNA, though not the start site of transcription.
Poly-A sites
These are found by comparing the 3′-end of those transcript data that have a poly-A tail to the genome, confirming that there is not an A-rich genomic region at that position. The poly-A site is characteristic of the end of the processed mRNA and so is a good indicator of the end of the coding gene's structure.
Tiling array expression data
There are data sets of tiling array expression from He et al. (25) and Fraser et al. (unpublished data) held in the modENCODE (26) database. These are useful for indicating exons excluded from the gene structures. The size of the probes used, typically 25 bp, limits resolution, and there is no indication of the strand being transcribed. They are, however, useful because libraries from different life stages or strains can indicate changes in expression over time or in different genomic environments.
Intron splice sites
The potential of each base in the genome to form a 5′ or 3′ intronic splice site has been determined using a position weight matrix (Green,P. and Hillier,L., unpublished data). Predicted gene structures that use splice sites with a poor score should be inspected because the prediction program is possible using the nearest available splice site to splice over a region that does not allow a good gene structure. These regions can be caused by either an error in sequencing the genome or the presence of a pseudogene.
Conserved genomic regions
Sequence alignments to the C. briggsae genome have been made using the WABA alignment tool (27). These conserved regions provide confirmatory information about gene structures, indicated possible missed or unannotated exons and genes and indicate the presence of conserved, non-coding sequences that might have regulatory roles. Further alignments of several orthologous Caenorhabditis loci have been made using Pecan (28).
Mass spectroscopy data
There are over 115 000 C. elegans mass spec peptides in WormBase, primarily from the MacCoss lab at the University of Washington (29) and the Hengartner lab at the University of Zurich (30). The measured masses of the peptide ions are matched to fragments of known or predicted C. elegans proteins or translated ORFs by the authors of this data. The locations of these mass spectroscopy peptides are then mapped back to the genome via their locations on the C. elegans proteins. This data matches 10 965 gene loci and have been useful in confirming existing gene models. It is also useful in indicating genes that are currently curated to be pseudogenes, but may have some protein product. This mass spectroscopy peptide data have included alignments to 120 regions that previously had only an ab initio gene prediction with no further evidence, indicating that these predictions are likely to be real coding genes. The presence of a single mapped peptide to a curated gene or pseudogene is not absolute confirmatory evidence of a real protein product, because there appears to be a high frequency of errors in predicting these peptides.
Protein secretory signals and domain structure
An incomplete or fragmented protein domain in the protein product, as indicated by Pfam (31) or InterPro (32), might indicate a missing exon or incorrect splice sites. Protein secretory signals, as predicted by SIGNALP (33), in translated ORFs might indicate a start of a CDS and these locations are generally chosen in preference to other START codons where there is uncertainty about which START codon should be used. Nagy et al. (34) submitted valuable information on genes with incorrect structures, based on an analysis of incomplete and incongruous domains in C. elegans proteins. For example, they highlighted genes which contained obligatory extracellular domains but lacked appropriate sequence signals (signal peptide, signal anchor and transmembrane segments), since their obligatory extracellular domains are not delivered to the extracellular space where they are stable and properly folded.
SAGE
There are 449 980 SAGE tags in WormBase. These have been used to indicate regions where there could be unannotated genes and have resulted in the creation of 243 new coding sequences.
Use of indirect evidence
To give an indication of the types of additional evidence that can improve the confidence that curators have in a CDS structure, a sample of 100 of the predicted CDSs from the set of 8.8% of CDSs with no EST or mRNA transcript evidence were inspected. The 100 genes had been created from a variety of evidence: most of them (93%) were created because they had a structure predicted by at least one gene prediction program and 78% of them had support for some part of their structure from the original Genefinder prediction. The others had been created because SwissProt or WormBase protein alignments indicated a probable CDS structure. Often the predicted structures appear dubious and as much supporting evidence as possible is sought, even if the extra evidence is tenuous and would not have been used for a CDS with good EST evidence. This supporting evidence is noted along with the recorded evidence for the creation of a new structure or when changing a existing structure to match new evidence and it usually strongly influences the choice of which predicted or probable exons to include in a structure.
The 100 CDS structures often have conflicting structures predicted for them by the different gene prediction programs used and it is often not obvious from these conflicting predictions which potential exons are correct or even that the region contains a gene. In these circumstances, it is useful to seek supporting evidence from orthologs or paralogs or other indications that a protein structure is conserved. Of the 100 inspected CDS structures, 22% had supporting evidence of exons from conserved coding regions found by WABA measures of conservation with the C. briggsae genome, and 81% of them have some SwissProt or WormBase protein alignment evidence of exons.
The 5′ and 3′ exons are often small and divergent between orthologs and are easy to get wrong in structures predicted from protein alignments. Of the 100 CDSs inspected, 10% had their 5′-end confirmed by the presence of a TSL sequence site.
When a CDS structure lacks any consistent gene predictions or has an unusual structure that makes the existence of the gene dubious, it is useful to have evidence that the region is transcribed or produces a protein product. In the absence of EST or mRNA evidence for transcription, such evidence can come from more indirect corroboration or transcription or translation such as aligned SAGE tags or mass spectroscopy. Of the 100 CDSs inspected, 29% have some mass spectrometry evidence and 62% have SAGE evidence of transcription in the region.
Pseudogenes
There are currently 1432 pseudogenes in WormBase. Pseudogenes in WormBase are regions of the genome, which resemble coding genes but are not expressed or cannot produce a successful protein product. These pseudogenes are manually curated and reviewed every few years. They are created when curators note EST alignment evidence for premature STOP codons or frameshifts in the open reading frames. Some pseudogenes have been created on the advice of experts in a particular gene family who note that the domains are incomplete or the likely tertiary structures of the gene products are not consistent with the rest of that family. Where possible, the exonic structure of the pseudogene is curated and the parent gene of the pseudogene is noted. Some coding genes are reclassified as pseudogenes every year as new evidence for their structure is collected and it becomes evident that the curated CDS structure is not correct and no successful protein product can be made. More rarely, a pseudogene may be reclassified as a coding gene if there appears to be good mass spectrometry evidence or other evidence from the literature for the change. The criteria for deciding whether a gene is a pseudogene is not specified very well in WormBase. In general: there should be a near-duplicate coding gene that is probably the parent gene of the pseudogene, the coding frame should be disrupted or an expert should declare it to be a pseudogene. No attention is paid to whether the pseudogene has a functioning promoter or not, as promoter regions are still poorly characterized. When there is equivocal evidence for changing a coding gene into a pseudogene, the curators tend to be slightly biased against making the change. This is because making a gene into a pseudogene effectively removes it from the scrutiny that coding genes get and removes the protein product data from the database.
Genomic sequence errors
Genomic sequence errors are also corrected when found. Genomic errors within genes can affect their structure, so correction is critical for accuracy. Over the years, there have been a number of changes to the underlying C. elegans genome sequence. These have usually been small indel modifications, but there have also been a number of large changes. The changes are based on reinterpretations of the original sequencing trace data, often done because there are mismatches between the genomic sequence and aligned EST sequence. Details of the genomic sequence changes can be found on the WormBase wiki pages (http://www.wormbase.org/wiki/index.php/Genome_sequence_changes).
Methods of curation
Accuracy and efficiency
Over the last 5 years, the number of people in WormBase curating gene structures has remained the same. In the same period, the number of nematode genomes being curated in WormBase has increased from one to four, and may increase further to include parasitic nematodes. The number of different types of data to be considered while curating has increased and many new genomic features are being added to the nematode genomes from projects such as modENCODE (26). It is therefore essential to improve the efficiency of the curators wherever possible without sacrificing accuracy.
It is important that areas of the genome that require curation should be easy to find and that changes should be easy to make. It is relatively easy to find and correct gene structures that do not match transcript alignments by finding mismatches between a gene structure and an EST alignment using a simple program. In such cases, the gene structure usually only needs to be changed to exactly match the alignment. However, with some other data types, finding mismatches between the gene structure and the data is often not simple. There can be many false positives because the data are ambiguous and much thought often has to go into deducing the most probable gene structure based on the evidence available.
Strategies
At WormBase, several strategies for manual curation of the gene structures have been used before the current ‘curation tool’ was developed. The initial methods were directed to the most obvious and pressing problem areas using the most readily available data. As the worst and most easily found problems were corrected, ways of finding the problem areas have become more rigorous and systematic and ways of presenting these problem regions to the curator have become more efficient.
Initial inspection
The earliest attempts at curation were manual inspections of the gene structures predicted by Genefinder (Green,P., unpublished data). Genefinder created identifiers composed of the clone name with a dot and a letter appended (e.g. Y37H2A.a). When the gene was inspected, the identifier was changed to the clone name with a dot and a number appended (e.g. Y37H2A.1) to indicate that it had been reviewed. The early literature on C. elegans genes therefore sometimes refer to identifiers like ‘Y37H2A.a’ rather than ‘Y37H2A.1’ and some reagents such as PCR primers still bear these names (e.g. ‘sjj_F56A4.a’). Where gene structures cross clone boundaries, the convention is that the 5′ clone’s name is used as the base of the gene name.
Gene lists of specific problems
Later attempts to systematically find genes that required curation used several separate programs. Each program looked at a different type of data to identify inconsistencies with existing gene predictions. Examples of these include small introns of <30 bases, and introns of aligned transcript sequences that did not match introns in curated genes. The curator then worked through the resulting lists of chromosomal positions or lists of gene names correcting problems. This was cumbersome, slow and often resulted in the same error being highlighted by multiple data types, which would become evident only when a curator was working on a subsequent evidence list and found the gene already corrected. Time was wasted locating an error flagged by one program that had already been resolved using errors from another program.
History-maker tool
A refinement of this strategy was to run a tool which read in the list of positions or gene names to be checked and sent a signal to the ACeDB genome database editor ‘FMAP’, instructing it to display the appropriate region of the chromosome for editing. This improved the efficiency of working through a list, but still often resulted in the same genes being revisited several times when using several lists.
Megabase scan
In 2006, a pilot project was undertaken by sequence curators at the WTSI and the WUGC to determine the most effective ways to use multiple data types. Each centre evaluated regions totaling 1 Mb of genome spread across all chromosomes. Regions were chosen in both the gene-rich central region and gene-poor arms. The main purpose was to see if a scan of the entire genome, where every clone is manually checked for potential gene structure modifications based on all the currently available data, was an efficient use of time and resources. Secondarily, since each site was scanning and curating the same regions independently, this was a test of the consistency between the two sites. The major conclusions drawn from the scan were as follows:
The time and resources required to do a complete genome scan are not practical or efficient. One disadvantage is that once a region has been scanned, new data would not be considered and integrated, possibly for quite sometime, until the genome scan ended and began again at the beginning.
The problem regions found by this manual scrutiny of the genome were already being found by automated methods. No new types of problems were found and many regions with problems were missed by the curators.
In most cases, the curators annotate consistently when their decisions are compared, but discussion and regular communication need to be maintained. There are instances where curators miss evidence for a change in a curated gene or place a different emphasis on the importance of different types of evidence.
The curation tool
The strategy of having lists of problem areas was further developed by keeping track of which problem areas had been looked at already and by combining the different types of problems with a weighted score, while continuing to allow the curator to move quickly and easily to the areas to be edited. This ‘curation tool’ is a system composed of Perl scripts and modules currently adopted by all the WormBase gene structure curators.
As the number of different types of analysis and genomic features of the nematode genomes has increased, so the number of ways in which this data can be used to find new genes and to improve the existing gene structures has increased. Many of the types of evidence from data are ambiguous and weak, so in isolation they are not strong supporting evidence for a change. When many such indicators are used together, however, they tend to cumulatively improve the evidence for a change. There has, therefore, been a change in emphasis from using a small number of lists containing strong evidence for changes to a large number of lists of weak evidence, requiring a tool to integrate the various lists.
Evidence for an error in the structure of a gene can be present in several of the lists. For example, tiling array expression data that does not match an exon, a weak splice site in the existing structure and an incomplete Interpro domain in the existing structure, all indicating that the structure needs attention.
The principle strategy of the ‘curation tool’ is that if the gene structure is incorrect, then there should tend to be a cluster of several types of evidence against the existing structure. This cluster will be a detectable signal even if each type of evidence on its own is weak and ambiguous. By searching for several different types of evidence for an incorrect structure and then looking for clusters of this evidence, an efficient search for regions that require curation can be made even when the evidence from any individual type of data is poor.
The ‘curation tool’ is composed of three components:
A Perl program to find the possible curation problems. This reads in GFF files of various types of protein or transcript genomic alignments and of other types of genomic features such as matches to repeat sequence libraries. It then finds discrepancies between this data and the curated genes that might indicate a problem that requires curation.
A MySQL database holding information on these possible curation problems and information on which ones have already been investigated by the curators.
A Perl/TK graphical user interface (GUI) for reading curation problems from the MySQL database and allowing the curator to select and edit regions of the genome that contain a high concentration of anomalies by commanding the ACeDB ‘FMAP’ gene structure editor to display the required region.
Finding and managing anomalies
The Perl program to find anomalies reads GFF files of gene structures, transcript and protein alignments, genomic features and other data. It then reads in a configuration file, which specifies how it should search for various anomalies indicating an incorrect curated gene structure. An example of an anomaly might be a gene structure predicted by the program ‘Jigsaw’ that differs from the curated gene structure. This type of difference is common and usually results from the curator having used other sources of information, such as homology to other members of this gene class, to improve the gene structure. Sometimes, however, the Jigsaw prediction is better than the existing curated gene and a change to the structure is required. In this case, the program compares the chromosomal coordinates of the exons in the Jigsaw prediction with those of the overlapping curated gene structure and stores any differences found as anomalies in the database.
The program assigns a score to each of the anomalies it finds. These scores are based on our experience of how informative each type of anomaly is. The sum of the anomaly scores for each region is used to prioritize curation.
The anomalies found by the Perl program are stored in a MySQL database. The Perl program can be rerun regularly to capture new anomalies, for example anomalies from new EST alignments or new types of genomic features added to the genome. The database is updated with the new anomaly positions, retaining information on which anomalies have already been seen and rejected by the curator.
The curator can then run the curation tool GUI. This queries the anomalies database to find those anomalies that have not already been seen and rejected by curators. These anomalies are grouped by position: the chromosome being worked on is divided into 10 kb windows and the sum of the scores of the live anomalies in that 10 kb window is calculated. The GUI presents a list of these 10 kb windows sorted by their score for the curator to select. These can been seen in the part of Figure 2 titled ‘Anomaly locator’. When a window has been selected, the GUI sends a signal to the ACeDB genome database editor, ‘FMAP’ (11), instructing it to display the selected region of the chromosome for editing, as shown on the left of Figure 2. The individual anomalies in this region are indicated in a second list in the GUI, as seen in the part of Figure 2 titled ‘Anomaly details in the selected region’, allowing the curator to see what types of problems have been found in this region. The curator can select any of these anomalies either to zoom in on the anomaly in the ACeDB editor or to mark that anomaly in the curation tool MySQL database as seen, rejected, and not to be displayed again.
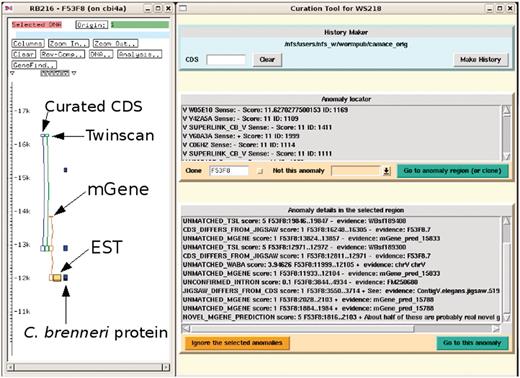
Screenshot of the curation system (to the right) in action with the ACeDB FMAP editor (to the left) displaying a simplified and annotated view of a typical anomaly of a curated CDS structure together with the structures predicted by Twinscan and mGene. There is evidence from the mGene prediction, EST alignment and a weak C. brenneri protein homology for an extra exon at the 3′-end. The curation system has been set to find all the anomalies in the clone F53F8 and some of these can be seen in the list at the bottom. Many of these anomalies are currently outside of the current FMAP view, which is centred around the CDS F53F8.7.
Different sized genomic windows were tried: below 5 kb different anomalies from the same gene tended to be split, decreasing the effectiveness of the tool in finding genes with problems. Above 20 kb anomalies from different genes tended to be grouped together making the use of the curation tool less focused on fixing the genes with the worst problems first. A size of 10 kb was used as a reasonable medium figure.
The signal to the FMAP editor is transmitted from the GUI by running a small program ‘xremote’. which is part of the ACeDB suite of programs and is designed to drive the FMAP editor to perform simple operations (Figure 3).
Types of anomaly
Many types of anomalies have been defined and used for finding areas that require curation. The anomalies depend on there being a rich variety of different forms of genomic features and analyses. These can then be mined for information to highlight differences between the current CDS structure and potential alternative structures or they can be used to find inherent problems in the current CDS or its protein product. See Table 1 for a list of the anomalies being used at present.
Types of sequence curation anomaly
| Name | Description of the anomaly | Score |
|---|---|---|
| UNMATCHED_RST5 | 5′ RACE tags that are not near the 5′-end of a CDS | 5 |
| UNMATCHED_TWINSCAN | Twinscan predicted exons that do not overlap any CDS exons | 1 |
| UNMATCHED_GENEFINDER | Genefinder predicted exons that do not overlap any CDS exons | 1 |
| JIGSAW_DIFFERS_FROM_CDS | Predicted jigsaw exons that differ from the CDS exons | 1 |
| CDS_DIFFERS_FROM_JIGSAW | CDS exons that do not overlap exons predicted by the program jigsaw | 1 |
| UNMATCHED_WABA | WABA well-conserved coding regions that do not match any CDS exons | Logarithm of the WABA score |
| OVERLAPPING_EXONS | CDS exons that overlap a CDS exon or any other sort of gene in the opposite sense | 5 |
| SHORT_EXONS | CDS exons shorter than 30 bases | 1 |
| LONG_EXONS | CDS exons longer than 20 000 bases | 1 |
| SHORT_INTRONS | CDS introns shorter than 25 bases | 1 |
| REPEAT_OVERLAPS_EXON | CDS exons that substantially overlap RepeatMasked regions | 1 |
| INTRONS_IN_UTR | UTRs which have three or more exons | 1 |
| SPLIT_GENE_BY_TWINSCAN | CDS that overlap two or more Twinscan predictions indicating they should be split | 1 |
| UNMATCHED_EST | EST alignments with no matching CDS exons or pseudogenes or transposons or repeats | 1 |
| UNMATCHED_MASS_SPEC_PEPTIDE | Mass spectrometry peptide positions that are no longer completely covered by a CDS exon or transposon | 10 |
| EST_OVERLAPS_INTRON | CDS introns (excluding ones from isoforms) that are completely covered by an aligned EST or other transcript alignment | 5 |
| UNMATCHED_EXPRESSION | Tiling array highly expressed regions that do not match a CDS | 10 |
| UNCONFIRMED_INTRON | Introns of EST/mRNA alignments that do not exactly match CDS introns and which do not overlap with pseudogenes, etc. | 10 |
| WEAK_INTRON_SPLICE_SITE | Splice sites of CDS introns that have weak scores | 1 |
| UNMATCHED_PROTEIN | BLASTX protein alignments to the genome which do not overlap CDS exons or pseudogenes or transposons, etc. | Logarithm of the BLASTX score |
| UNMATCHED_EST | EST/mRNA alignments with no matching CDS exons or pseudogenes or transposons | 3 |
| FRAMESHIFTED_PROTEIN | BLASTX protein alignments to the genome that indicate an apparent frameshift | Logarithm of the BLASTX score |
| MERGE_GENES_BY_PROTEIN | BLASTX protein alignments to the genome which overlap two genes indicating that the genes should be merged | Logarithm of the BLASTX score |
| NOT_PREDICTED_BY_MGENE | The curated CDS is not predicted by mGene | 2 |
| NOVEL_MGENE_PREDICTION | mGene predicts a CDS which does not overlap with a curated CDS | 2 |
| UNMATCHED_MGENE | mGene predicted exons that do not overlap any CDS exons | 2 |
Some anomalies have been investigated but were difficult to implement or are no longer informative and are not now used. Examples of the latter include looking for SAGE tags that do not overlap a curated gene model. These were mainly found in the untranslated region (UTR) regions of genes, which were highly expressed and which therefore already had sufficient EST transcripts to model them easily.
Scoring the anomalies
The anomalies system allows any score to be assigned to a type of anomaly. See Table 1 for examples of the scores used. Generally, experience of the utility of the various types of anomaly in curation is used as a guide in setting the score.
The anomalies that are strongly indicative of a required change with a low false positive rate are generally given high scores. Those that are rarely indicative of a problem are usually given a low score or can be removed from consideration completely. This is done by either giving them a score of 0 or by removing that type of anomaly from the Perl program that searches for anomalies. The scores are generally set in the range 1–10, but there is nothing to prevent any value being assigned to an anomaly’s score.
Most anomalies are assigned a simple integer score, but some anomalies are based on features or alignments which vary in quality and, which themselves have a score, these alignment scores can then serve as the basis for the anomaly's score. An example is BLASTX alignments of proteins to the genome where there is no overlap to a curated CDS. In this case, the anomaly score is calculated from the logarithm of the raw BLASTX score, hence better BLASTX matches get a higher score.
The GUI allows the user to turn off any set of anomaly types so that effort can be concentrated on anomalies that the curator feels to be particularly informative. This will tend to work against the need to preserve a consistent use of the available information among the curators and between sites, but occasionally a new data set is added, which produces a set of anomalies that are particularly rewarding.
Usage of the curation tool system
Initial trials of the curation tool system started in March 2007 and use by all curators started in May 2007. This resulted in a marked increase in the numbers of new splicing structures and new protein-coding genes created, with the numbers of new protein-coding genes per release rising from ∼7 per release to ∼2 per release and new isoforms rising from ∼9 per release to ∼47 per release. The numbers of CDS structures being changed has risen from ∼30 to ∼70 per release (Figure 4).
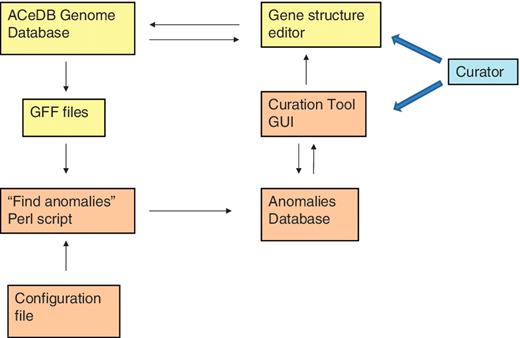
Relationships of the various components of the curation tool and the genome database. The components of the ACeDB database are shown in yellow and the components of the curation tool are shown in brown. The curator interacts with both the curation tool GUI to find regions with anomalies and the ACeDB FMAP genome editor to correct those regions.
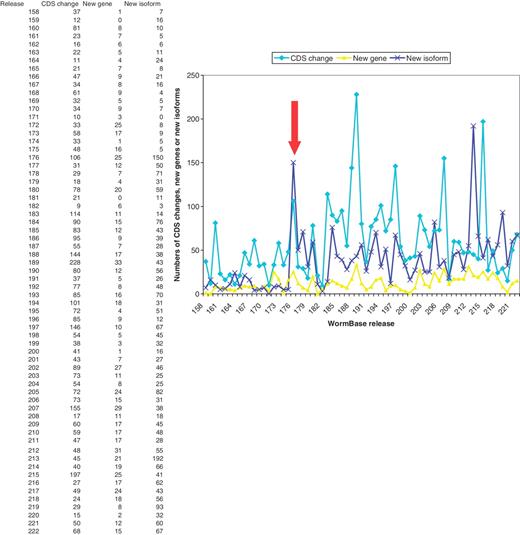
Numbers of changes to CDS structures, new protein-coding genes and new isoforms created in each WormBase release, showing a marked rise in curation activity from release 176 (marked by the arrow) onwards.
The numbers of new genes and new isoforms being made each release are possibly starting to return to levels seen before the curation tool was introduced. This is because the regions that had clusters of high-scoring anomalies were seen and attended to first. These were in need of most curation work and resulted in many changes. As these high-scoring regions have now been completed, the lower scoring regions are now being curated. In these regions, the false positive rate of the anomalies is higher and it is often not obvious what changes should be made, hence more time is taken investigating a gene before a change is made.
It is difficult to give precise figures for the number of gene structures that have been inspected to see if they require a change using the curation tool because the curation tool looks at anomalies and chromosomal locations and not genes. The number of curation tool anomalies inspected so far is ∼150 000. It is probable that some genes with poor evidence have been looked at several times as new types of anomaly and new data are added to the curation system. About 3000 of the 10 kb anomaly regions have been inspected at least once since the curation tool system began to be used.
The genes that have been inspected but do not require a change are not currently marked as ‘complete’ or ‘approved’ on the basis of human inspection. New evidence for requiring a change has sometimes been found even in genes with good evidence for the existing structure and it is time consuming to manually revise the status of genes under such a scoring scheme. This may change and there are discussions about how to indicate to the users the confidence the curators have in the structure, using an improved automated scoring system. Currently, there is an automated system that has been in place for several years that scores the validity of the CDS structures by the amount of EST coverage of the exons as ‘confirmed’, ‘partially confirmed’ or ‘predicted’. We may soon improve this automated system by including RNASeq alignment evidence.
Sequence changes are still sometimes made to the C. elegans genome. These are usually single base changes, or insertions or deletions of a few bases. These small changes do not affect the curation tool system, which was written to accommodate these small changes. There have, however, been changes, such as a recent insertion of 4 kb of newly elucidated sequence, which required the positions of some anomalies in the curation database to be shifted. This is a routine maintenance that would be expected in any database holding positional information on a genome that is actively maintained.
We have not kept rigidly to using the curation tool for all data sets. For example, the nGASP project (10) to generate good gene predictions resulted in a set of CDS predictions by the Jigsaw combiner program. Many of the Jigsaw predictions matched the exons indicated by EST alignments more accurately than those curated CDS structures, which were still based on the original Genefinder predictions. A set of genes was identified where the original Genefinder prediction was still being used, where there was little or no transcript evidence to support the CDS and where Jigsaw gave a substantially better alignment when compared to the paralogous genes than the curated CDS. Therefore, a script was written which read in a list of these Jigsaw predictions and allowed the curator to quickly and easily reject or to accept and automatically make each replacement. This proved to be a faster and more accurate way of making the changes, while still manually checking each replacement, than to load this set of Jigsaw predictions into the curation tool where the required changes to the gene structure would then have needed to be constructed manually.
High-throughput technology
The recent introduction of high-throughput transcriptome data using RNASeq technologies (14) (Mitreva,M., unpublished data) has allowed us to compare the curation using indirect evidence for gene models with the more direct evidence of RNASeq transcription data.
It was expected that the influx of short-read transcriptome data that has been available since March 2009 would have produced a new set of high-scoring anomaly regions, which would increase the rate of curation changes. This has happened to some extent, but the rise has not been as sharp as anticipated, with the number of new genes created in the 6 months before and after March 2009 changing from 35 to 114. The number of new genes created is expected to decrease soon, because only ∼80 new genes had been indicated by the RNASeq data (14) and there are only 120 regions where 454 reads might indicate a novel gene.
Although RNASeq data provide a clear confirmation of gene structures when the gene is strongly expressed, evidence for a gene structure is often ambiguous or missing for weakly expressed genes. These are often the genes most in need of additional supporting evidence for their structures. For example, in the genes with no EST or mRNA alignments, the RNASeq data (14) had no useful alignments to 58%, it confirmed a partial structure in 16%, it confirmed the complete structure in ∼17% and indicated that a structure change was required in ∼9%. The RNASeq data has, therefore, not had as great an effect on gene structure curation of these weakly expressed genes as was initially expected and the curation tool is useful to highlight anomalies based on features other than the RNASeq data.
The RNASeq data is being incorporated into the curation tool as part of the continuing search for anomalies that are significant and informative. For genes that are strongly expressed, the RNASeq data is useful for indicating new isoforms. In the year before the RNASeq data started to be used for curation, there were 462 new isoforms created. In the year after, 398 new isoforms have been created. It is probable that the limiting factor in the creation of new isoforms is not the availability of evidence for required gene structure changes, but the number of curators available to work on new C. elegans gene structures. It is expected that many more new isoforms will be confirmed using RNASeq data and curating these is expected to continue for sometime.
Curators have to be cautious when creating isoforms based on short-read data where two or more alternative splice sites are not covered by a single read. Long reads lengths are useful for distinguishing which alternative exons occur together with other alternative exons in a gene’s transcripts. Therefore, even though the Illumina data gives a deeper coverage than the 454 data, the latter is useful for confirming the structure of alternative splice structures.
The 454 RNASeq data (Mitreva,M., unpublished data) contains 15 interesting transcripts overlapping genes not seen in previous data. These novel transcripts are from the reverse strand to the well-characterized coding genes and could be involved in regulation of the gene. Most RNASeq data also contains artefacts including intergenic background transcription, non-coding RNA and dubious intron splice sites. There is still therefore a need for human curators to judge what the RNASeq data is showing when the RNASeq data is novel, weak or ambiguous or has misleading artefacts.
Conclusion
Types of curation tried
The WormBase curators have tried several methods of curation in an attempt to maximize the efficiency of their curation effort by making incorrect structure easy to find and correct. Initially, visual inspection of the original gene predictions was tried. These were tedious to perform and error prone. This was followed by creating lists of genes with specific types of problems, then automating the way the genes in these lists are displayed in the gene structure editor by jumping to the genomic location of the next gene in the list. This was often found to result in the same gene being revisited as it was in several lists.
A systematic visual checking of all genes along the genome was tried with unsatisfactory results. This was found to lead to inconsistencies between the abilities of different curators to find and correct gene errors and new evidence for a gene change would have to wait until the gene was revisited.
Finally, the current ‘curation tool’ system is described. This integrates lists of many different types of curation evidence concurrently and automates the display of the genomic location of the regions with highest summed ‘anomaly’ scores in the structure editor. This system has been found to be easy to extend to the other nematode species that are being curated in WormBase and it is easy to add new types of evidence for a gene structure change. For example, recently a new anomaly type has been added based on RNASeq alignments that link two genes, indicating that the genes should either be merged into one or that there has been incomplete splicing in a poly-cistronic region or a spurious RNASeq misalignment has been made between the two genes. This has resulted in over 300 such putative mergers being identified, some with supporting evidence from other types of anomaly data.
Use by other groups
The curation tool is in use by both the UWGC and the WTSI groups responsible for curation of the WormBase genomes. The UWGC group uses it on other species in the WormBase database apart from C. elegans.
It should be possible for other groups who utilize the ACeDB ‘FMAP’ gene structure editor to curate their gene structures to use the curation tool with very little modification apart from changing the configuration file that specifies how to find anomalies.
Groups who do not use the ACeDB ‘FMAP’ gene structure editor to curate their gene structures will find it more difficult to use the curation tool. Apart from changing the configuration file, a way of driving the gene structure editor must be used.
Any genome-editing program capable of receiving a signal to display a region for editing from an external controlling program could be used instead of the ACeDB ‘FMAP’ gene structure editor. The authors of the Apollo (35) and Artemis (36) genome browsers have expressed interest in potentially incorporating such a capability into their genome editors.
If a gene structure editor cannot be driven by an external program to change the location it is displaying without starting a new session, then it could still be used by the curation tool with some small changes. However, this would probably require the gene structure editor to be started afresh for each anomaly location to be looked at, which would take sometime and would make the system feel cumbersome to use.
The sources for the ‘curation tool’ are available at: ftp://ftp.sanger.ac.uk/pub/wormbase/CurationTool/
Future releases
We will continue to use the curation tool to make corrections to gene structures and to add more isoforms as new data becomes available. We will use comparisons to homologous genes as new nematode species and other C. elegans strains are sequenced and we will use the data becoming available from the ChIP-chip and ChIP-seq data from modENCODE (26) and other projects. We will correct the C. elegans reference genome as new resequencing data becomes available.
Funding
This work was supported by the US National Institutes of Health [grant number P41-HG02223] and the British Medical Research Council [grant number G0701197]. Funding for open access charge: The US National Institutes of Health [grant number P41-HG02223].
Conflict of interest. None declared.
