


Abstract
A codon consists of three nucleotides and functions during translation to dictate the insertion of a specific amino acid in a growing peptide or, in the case of stop codons, to specify the completion of protein synthesis. There are 64 possible single codons and there are 4096 double, 262 144 triple, 16 777 216 quadruple and 1 073 741 824 quintuple codon combinations available for use by specific genes and genomes. In order to evaluate the use of specific single, double, triple, quadruple and quintuple codon combinations in genes and gene networks, we have developed a codon counting tool and employed it to analyze 5780 Saccharomyces cerevisiae genes. We have also developed visualization approaches, including codon painting, combination and bar graphs, and have used them to identify distinct codon usage patterns in specific genes and groups of genes. Using our developed Gene-Specific Codon Counting Database, we have identified extreme codon runs in specific genes. We have also demonstrated that specific codon combinations or usage patterns are over-represented in genes whose corresponding proteins belong to ribosome or translation-associated biological processes. Our resulting database provides a mineable list of multi-codon data and can be used to identify unique sequence runs and codon usage patterns in individual and functionally linked groups of genes.
Database URL:http://www.cs.albany.edu/~tumu/GSCC.html
Introduction
The central dogma of molecular biology states that a cell's genetic information, found in the form of DNA, is transcribed into mRNA and then translated into protein. Transcription and translation are regulated processes that together dictate the amount of a specific protein found inside the cell. Transcriptional regulation has been extensively studied, can take many different forms and will generate a quantity of mRNA used for translation (1). Transcriptional regulatory strategies include activation, enhancement and de-repression, with these mechanisms working during initiation (2–4). Promoter proximal stalling has recently been reported to regulate transcriptional elongation (5), demonstrating that this step can be modulated to control gene expression. Translational regulation has primarily been studied at the level of initiation, with codons an optimal regulatory unit that could be used by cells to influence translation elongation. Codons serve as an optimal unit of information in mRNA and by pairing with anticodons found in tRNA, they allow for the translation of nucleic acid information into protein sequences (6). Translation elongation is an understudied process and we have previously proposed that gene-specific codon usage patterns matched to specific tRNA modifications could be used to regulate elongation steps (7).
Individual codon usage patterns have also been studied to generate regulatory information. In 1987, Sharp et al. (8) described a method for summarizing codon usage called the codon adaptation index (CAI). In the CAI, all of the genes in the genome are compared with an optimal codon usage pattern inferred from a set of presumed high-expression genes. This CAI analysis method results in a quantitative measurement of the high-expression codon usage bias exhibited by each gene in the genome (9). Codon usage information has also been used in correlation studies, with high usage codons in a genome corresponding to multi-copy tRNAs with corresponding matching anticodons (10), further demonstrating a connection between codons and tRNAs and their potential influence on gene expression. The biotechnology sector has also exploited codon–anticodon interactions and developed resources to optimize these interactions by increasing the levels of specific tRNAs (11). These codon–anticodon optimization tools promote high protein expression levels and further demonstrate the potential for codon usage patterns to affect gene expression.
There is an abundance of single codon data for most sequenced organisms, but understanding codon usage may require local information associated with tandem codons. Dicodons are an interesting gene-specific parameter because these tandem codons can be matched to the presence of mRNA sequence in the A and P sites of the ribosome. Nguyen et al. (12) described the use of dicodons as a promising feature for gene classification. Their study analyzed 1841 human leukocyte antigen (HLA) sequences for dicodon frequencies. One conclusion of the Nguyen study was that gene-specific dicodon data provides specific local information and can be used to classify genes into biological categories. The study further speculated that the translation of dicodons could be very sensitive to tRNA levels (13). While these authors do not analyze their data from a regulatory perspective, their study does demonstrate that dicodon characteristics classify HLA's into two major groups. Noguchi et al. (14) developed the MetaGene approach to identify genes from sequenced genomes and it utilizes dicodon frequencies to obtain higher open reading frame prediction accuracy than simply using codon frequencies. It is interesting to note that dicodon information has found extensive use in classification-based approaches. Little information is readily available, however, to compare dicodon sequences between individual genes or among groups of genes. In addition, there is a need for genome-based resources for the analysis and comparison of specific combinations of three, four and five codons in a row.
In the following study, we describe a bioinformatics resource that we have developed to analyze, catalog and compare gene-specific codon information: The Gene-Specific Codon Counting (GSCC) Database. We have exhaustively analyzed each Saccharomyces cerevisiae gene to identify all one-, two-, three-, four- and five-codon combinations. We have developed both genomic and gene-specific resources to analyze our data, with the latter being used to identify unique codon runs in genes previously shown to be translationally regulated by tRNA methyltransferase nine (Trm9)-catalyzed tRNA modifications (7). We have also used functional ontology information to analyze gene sequences with distinct codon usage patterns and have demonstrated that some transcripts whose corresponding proteins are associated with translation use a minimal group of codons. We have also demonstrated that same–same dicodon usage is over-represented in smaller than average genes, suggesting a regulatory potential for these sequences. The GSCC database and analysis method has been developed to serve as a resource for those scientists interested in studying the regulatory role of local codons and as a launching pad for studies on the regulation of translation elongation.
Materials and methods
Core functionality and architecture
The main objective of the GSCC database is to provide a gene-specific tool to identify and compare codon combinations (two–five) between multiple genes. For the purpose of this study, we define a gene as an open reading frame beginning with a start codon and ending with a stop codon. It is a cumbersome task to visually analyze genes for specific codon combinations and GSCC has automated this process. We have developed the GSCC application to provide useful visualization tools (bar graphs and combination graphs) and to promote data analysis by the user; the freely accessible database allows the users to export both codon combination and frequency data for user-defined genes or for the entire genome. Figure 1 illustrates the core architecture of GSCC, described as two-tiered. Tier 1 consists of the codon combination database that was prepared by exhaustively analyzing the sequence of 5780 S. cerevisiae genes to quantify the number of individual codons or the number of two-, three-, four- and five-codon combinations in a specific gene. Tier 2 consists of a GSCC module that queries the database with the given user input (gene name, unique sequence name or codon run), retrieves the gene-specific or codon combination data and then displays the results to the user in a selected format.
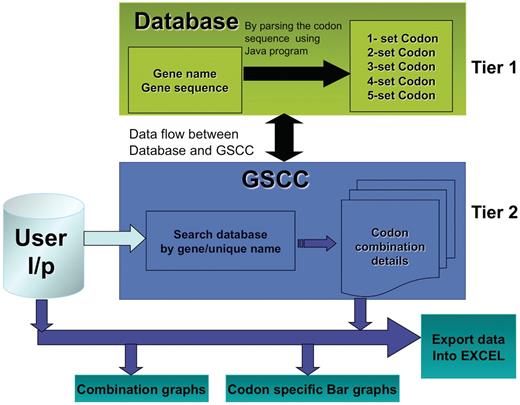
GSCC core architecture. Overview of the GSCC two tier architecture. Tier 1: The database contains the main gene names and codon gene sequences of 5780 genes taken from S. cerevisiae. Using the codon gene sequence information, we quantitated the number of individual codons as well as all two set, three set, four set and five set codon combinations in each gene. Tier 2: The GSCC user visual interface takes user defined input (gene name or search string) and searches the database for a matching gene name with the given search string and then retrieves that gene's codon sequences (individual codons as well as all two set, three set, four set and five set codon combinations). Users can visualize the codon sequences as bar graphs and as combination graphs. (Refer to Figure 3 for combination graphs). Users can also export the codon information into Excel.
Database
The master gene data set consists of gene sequences for 5780 genes as specified by the Saccharomyces genome database (SGD) (http://www.yeastgenome.org). We used a defined set of three-letter sequences specified by the genetic code and determined the number of these codons represented in a specific gene. This standard analysis has been reported elsewhere and our individual codon usage values were similar to those reported (http://www.yeastgenome.org). The gene-specific information detailing the number of individual codons used is stored as a database table in GSCC. Since a codon is 3 consecutive nucleotides, the possible number of single codons in a gene is 43 = 64. The 64 possible combinations were cataloged for each open-reading frame. A similar cataloging approach was taken to quantitate all 4096 possible two-codon combinations in each S. cerevisiae gene, with this being expanded to include all three, four and five codon combinations present in each S. cerevisiae gene.
Approach used to build the GSCC Database
We wrote a Java program to construct an MySQL database that catalogs gene-specific codon combination data. The developed Java application used a Hashmap to maintain codons and their gene-specific number as key element pairs (15,16). We used simple heuristics to increase the computational speed for quantifying the codon combinations. The algorithm is as follows: first, we searched for every possible single codon occurrence in each gene sequence and saved that resulting number. For each single codon found, we also calculated the related higher order codon frequencies that start with this particular codon. Using this technique, we were able to avoid searching the gene sequence iteratively for each possible n-codon combination, as this process is exponentially complex in n. This approach was used to interrogate 5780 gene sequences and produced 13 728 338 data points specific to 4 840 224 codon combinations. The resulting data is stored in relational database tables. We developed a Java Swing-based application (GSCC) for visualizing the data. Users can access the database using GSCC application that is available for download at http://www.cs.albany.edu/~tumu/GSCC.html
Data presentation and comparison
Consider, for example, the lysine codon AAA in YEF3. We have recently demonstrated that codon usage patterns in YEF3 influence the translation of this transcript in conjunction with tRNA modifications (7). There are 10 AAA codons in YEF3, a gene with 1045 total codons. The actual frequency of AAA in YEF3 is (10/1045) = 0.0096. Based on genome number, there are 117 087 AAA codons in all 5780 genes, with a total of 2 757 245 total codons, representing an expected AAA codon frequency of (117 087/2 757 245) = 0.0425. Thus, there is a large difference between the actual and expected frequency of AAA in YEF3 (0.0096 – 0.0425) = −0.0329, indicating that the AAA codon is under-represented in YEF3.
Consider, for example, the lysine–lysine codon combination AAG–AAG in gene YEF3. There are 15 AAG–AAG codon combinations in YEF3, a gene with 1044 total two-codon combinations. The actual frequency of AAG-AAG in YEF3 is (15/1044) = 0.014367. We identified 4041 AAG–AAG codon combinations in all 5780 genes. There are a total of 2 751 410 two-codon sequences in the genome representing an expected AAG–AAG codon combination frequency of (4041/2 751 410) = 0.001468. Thus, there is a large difference between the actual and expected frequency of AAG-AAG in YEF3 (0.014367 – 0.001468 = 0.01289), indicating that the AAG–AAG codon combination is over-represented in this gene.
Data visualization using GSCC
Users can view the number of codon combinations in each gene using either bar graphs or combination graphs, with the latter being able to simultaneously analyze 1, 2, 3 and 4 codon combinations in a specific gene. In addition, the user has the option to export the required data into Excel for further analyses. To observe the data in either format, the user has to search the database using either a gene name or unique sequence name as a search string. Then, among the retrieved results from GSCC, the user has to select the specific gene name for which the data can be observed.
In the context of Figure 2, we use bar graphs to display the number of individual codons as well as all two-, three- and four-codon combinations found in YEF3. In the displayed bar graphs, each bar corresponds to one codon or codon combination from the selected gene. In all the bar graphs, the bars are sorted in the descending order of Actual frequency minus Expected frequency for each codon or codon combination found in the target gene. The y-axis represents the number of times the specified codon was identified in the target gene and the x-axis represents the rank order for that specified codon or codon combination, as it relates to the difference in actual minus expected frequency. We have not been able to display the names for all the codon or codon combinations on the x-axis because of the character length; however, users can place the mouse pointer on each bar to retrieve specific details (sequence, actual and expected frequency) for each codon or codon combination. Since for each gene there are 64 or 4096 or 262 144 or 16 77 216 or 1 073 741 824 potential codons or combinations, specific to 1, 2, 3, 4 or 5 codons in a row, we cannot show all the codon combinations simultaneously on the screen using bar graphs; we have limited the user to 30 bars at a time on the screen. The user can employ the horizontal scroll bar to methodically analyze all codon combinations in a gene sequence. Figure 2 illustrates the key features of the bar graphs using YEF3 as an example.
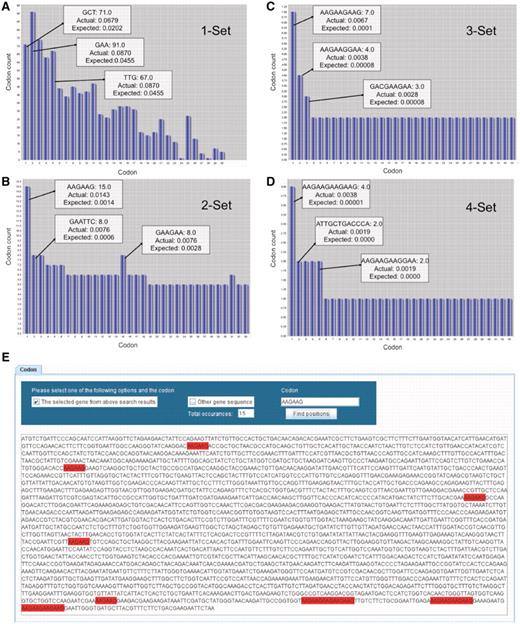
GSCC visual output demonstrating codon combinations in YEF3. Bar graphs (A–D) of single, double, triple, and quadruple codon combinations in the YEF3 gene, respectively. Each bar represents a codon. When the user places the mouse pointer over the each bar (codon) in GSCC, it shows the quantitated values of the codon. In all the graphs, the bars are sorted in the descending order of (actual–expected frequency). Codon painting (E) takes user input information, consisting of individual codons or codon runs, and highlights these occurrences in the gene sequence.
Codon run highlighting and global search
By employing GSCC, users can also observe the locations of a given codon (or codon combination) in a specific gene sequence (Figure 2E). GSCC highlights the codon occurrences from a gene sequence in red; it also provides the total number of occurrences of the codon or codon combination in the specified gene sequence. For example, Figure 2E shows the total number of occurrences of AAG–AAG (15) in YEF3 and the locations of the occurrences of AAG–AAG codon combination in YEF3 gene. Users can also search for a given codon or codon combination in each of 5780 gene sequences, with a list of genes containing the specific codon or codon combination provided in an exported file.
Gene-specific combination graphs
A combination graph contains the name of the selected gene at the center of the circle and all the individual codons found in the gene as sectors in a primary circle surrounding the gene name. Added layers represent increasing codon combinations from two to four, and the connected sectors from each layer display the codon name and the codon or codon combination number in parenthesis. Figure 3 illustrates the key features of the combination graphs using YEF3 as an example. As the number of codons increases, the sector size is reduced. Thus, to observe the codon name and the count clearly, a user can place the mouse on a sector or codon and that codon name and count will be shown in the left hand corner of the user interface. The user can observe all the codon combinations using the zoom bar or can analyze one particular codon combination by clicking on the codon.
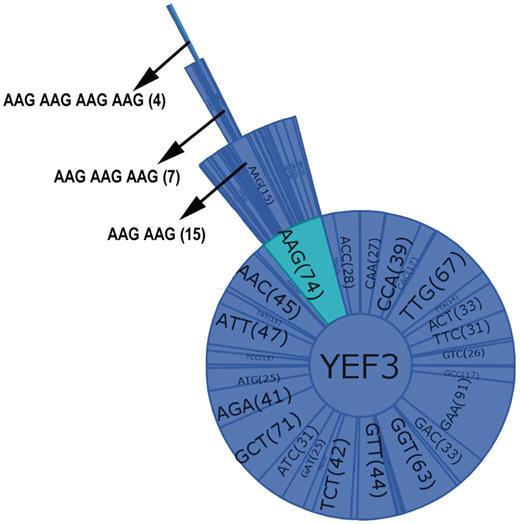
Combination graph of YEF3. Each sector of the graph represents a codon with the name and the number of each codon in parenthesis. The selected codon combination (as shown by arrow in the Figure) also details the number of occurrences in each gene.
Data export
GSCC users can export the codon data as an Excel workbook for all single or two-codon combinations for all yeast genes. Single codon data for all 5780 genes from S. cerevisiae can be downloaded into a single sheet of an Excel workbook. Two-codon combinations data for all the 5780 genes can be downloaded into a single Excel data workbook comprising 64 sheets. The Excel data consists of the codon count, actual and expected frequency values. Due to the data magnitude, users cannot export all three, four and five codon combination data for all 5780 genes simultaneously. For codon combinations data of more than two, the user must first specify gene names. Users can select up to 40 genes for comparison of the number of each three, four and five codon combinations found in the gene. This functionality can be utilized to compare two or multiple genes simultaneously to identify similar or different codon runs.
Codon doublet analysis and Heat Map

Z-score values for each same-same codon doublet in each gene, along with data describing whether a gene was smaller or larger than average, were imported into the program CLUSTER and analyzed by hierarchical clustering (17). The resulting clustered data was then visualized using the program TREEVIEW (18).
Results and discussion
The GSCC database can be used to identify distinct codon patterns in individual genes, as these entities are hypothesized to have regulatory roles (7). Users can also export genome-based data, detail specific codon usage patterns in gene sets and compare codon patterns between specific genes. Below, we discuss some specific findings and uses for the GSCC database.
Gene-specific codon diversity
In most cases, any gene only contains up to 62 different single codons (61 different single codons and one of the three stop codons). Among all the S. cerevisiae genes we analyzed (5780 genes), only 889 genes consisted of all the 61 different single codons specific to all 20 amino acids (Supplementary Table S1). Using the program FunSpec (19), we asked if there are any biological processes over-represented in this list of 889 genes. Interestingly, the MIPS functional classifications of DNA topology [10.01.02] phosphate metabolism [01.04], modification by phosphorylation, dephosphorylation, autophosphorylation [14.07.03], DNA damage response [32.01.09], DNA repair [10.01.05.01] and organization of chromosome structure [42.10.03] were over-represented in this list of 889 genes (P < 10−8) (20). While this indicates that many of the genes belonging to these categories use the full spectrum of codons and all amino acids, it also suggests that the levels of corresponding proteins could be influenced by many different codon combinations, specific charged tRNA levels or factors that affect amino acid metabolism.
We also enlisted the GSCC database to determine which gene and gene sets have the least codon diversity. The gene that consists of the least number of different single codons is RPL41A, using just 12 different single codons and excluding 49. In addition, the gene RPL41B contains only 13 different single codons. These two proteins are both components of the large ribosomal subunit and they have nearly identical primary amino acid sequences (21). RPL41A and RPL41B both have AGA as the most represented codon (9 times in each) with the next being AAG (6 times in each). Interestingly, RPL41B not only contains all the codons contained by RPL41A but also contains an additional GCT codon (n = 1). Another difference between RPL41A and RPL41B is that the codon GCC was found twice in RPL41A but it was only found once in RPL41B. The limited codon diversity for these genes should make them very sensitive to the levels of specific tRNA while insensitive to others.
The observation that RPL41A and RPL41B only use a limited set of codons led us to question whether other translation association proteins have limited diversity in regard to their codon usage patterns. We analyzed all the genes (n = 60) that use fewer than 30 codons to determine if any biological processes were over-represented in this list (22). We noted that the GO biological processes of translation [GO:0006412], rRNA export from nucleus [GO:0006407], maturation of SSU-rRNA from tricistronic rRNA transcript (SSU-rRNA, 5.8S rRNA, LSU-rRNA) [GO:0000462] and ribosomal small subunit assembly [GO:0000028] were over-represented in the genes that use less than half of the available codons (Supplementary Table S2). The limited codon use is intriguing and its functional association to specific pathways suggests a regulatory role for specific codons in coordinating processes associated with translation.
Two-codon combinations
The GSCC can also be used to analyze two-codon combinations in individual genes. This information is available for all S. cerevisiae genes as an exportable file. In theory, there should be 61*64 = 3904 different two-codon combinations represented in all the genes. However, 3946 different two set codon combinations are represented by all the genes, begging the question where do the extra combinations come from? Among the extra 42 combinations found in all S. cerevisiae genes, 4 different two-codon combinations begin with a TAA ‘stop’ codon, 6 different two-codon combinations start with a TAG ‘stop’ codon and 32 different two-codon combinations begins with a TGA ‘stop’ codon (Supplementary Table S3A–C). An internal TGA can signal for the inclusion of selenocysteine and our indentified TGA XXX sites may represent recoding sites (23). A similar conclusion may be attributed to the other sites or may be the result of sequencing or database errors.
None of the 5780 genes found in S. cerevisiae contain all the different two-codon combinations. The gene MDN1 contains the highest number (2068) of different two codon combinations. This is somewhat expected, as MDN1 contains 14 733 nucleotides (http://www.yeastgenome.org), making it one of the larger open reading frames in S. cerevisiae. Among the 5780 genes, RPL41A has the fewest number of unique two-codon combinations (21 different two-codon combinations). The gene with the second least diversity in two-codon combinations is RPL41B which contains only 22 different two-codon combinations. In many ways, this is expected as both RPL41A and RPL41B use a small number of single codons and are small genes containing 78 nucleotides each. Upon analysis, the 256 genes (Supplementary Table S4) with limited two-codon combination diversity (less than or equal to 100 different combinations) were over-represented in the theme of translation (19) (P ≤ 0.05). Similar to our single codon diversity analysis, our two-codon combination diversity analysis reaffirms that some proteins associated with translation use distinct codons and codon combinations in their coding sequence.
Visual outputs from GSCC
We have chosen to use the gene YEF3 to demonstrate the visual output from the GSCC database. In general, database users can analyze all single codons, as well as two-, three-, four- and five-codon combinations for YEF3 (Figure 2); this can also be done for all genes in our database.
A description of all single codons in YEF3 was generated in GSCC graphical user interface. We note, though, that the individual bars are sorted based on the difference between the actual minus expected codon frequency associated with YEF3, with the highest difference listed first. This type of distinction helps to identify codons that are over-represented in a specific gene sequence. As can be observed in Figure 2A, GAA codons are found in the highest total number (91) in YEF3 but the codon GCT, with a count of 71, appears first because it has the largest difference between the actual and expected frequency values.
As can be observed in Figure 2B, AAA–AAG is the two-codon combination represented most (15) in YEF3. In addition, based on frequency difference values for all codon doublets, AAG–AAG is the most over-represented in this sequence. GSCC users can observe all triple codon combinations specific to a gene in a separate window. For example, in Figure 2C the three-codon combination AAG–AAG–AAG is found seven times in YEF3 and it is the most over-represented triple-codon combination in this gene. The number of four codon combinations in a specific gene can also be analyzed in GSCC. As can be observed in Figure 2D, the four-codon combination of AAG–AAG–AAG–AAG is found four times in YEF3 and it has the highest frequency difference value (0.00379), indicating it is over-represented in this gene.
YEF3 contains some unique codon runs associated with the lysine codon AAG, suggesting that these codon runs may play a regulatory role during translation. Using a search string of AAG–AAG–AAG–AAG–GAA in our GSCC interface, we identified this codon run in one gene other than YEF3, specifically in MNN4. Interestingly, the AAG–AAG–AAG–AAG–GAA run is found twice in the 3′-end of MNN4 with both instances separated by three codons for glutamic acid. The SGD annotation for MNN4 indicates that it is a ‘Putative positive regulator of mannosylphosphate transferase (Mnn6p), involved in mannosylphosphorylation of N-linked oligosaccharides’ (SGD Database). The translation of YEF3 is dependent on Trm9-catalyzed tRNA modifications (7). The identified single codons (AAG) found in the distinct codon run shared by MNN4 and YEF3 is linked to Trm9-catalyzed tRNA modifications. Our codon comparison would suggest that Mnn4 protein levels have a similar dependence on Trm9-catalyzed tRNA modifications. This is a testable hypothesis and the focus of future work. Using the codon painting portion of the database, we can demonstrate that the two AAG–AAG–AAG–AAG–GAA sequences found in YEF3 and MNN4 are located near the end of each corresponding gene. Distinct codon usage at the end of a gene could stall or slow translation for regulatory purposes.
Heat map of codon doublets
One of the benefits of our database is that the resulting output can be used for genome-based analysis. We performed a global codon analysis with a specific goal to determine if any group(s) of genes were over-represented with same-same codon doublets (i.e. AAA-AAA or AGA-AGA, etc.). We exported all the same–same codon doublet data from 64 excel worksheets and generated Z-scores describing whether a specific doublet was over- or under-represented in a specific gene, relative to the genome average. We also included a quantitative description of whether the gene was smaller or larger than average, as one could expect to find more doublets in a larger sequence. We performed hierarchical cluster analysis (Figure 4) to test this assumption and, surprisingly, determined that in general, larger than average genes are not over-represented with same-same codon doublets (Cluster I). This was not the case for smaller than average genes, as cluster analysis revealed that some groups of smaller than average genes are over-represented with a specific set of same-same codon doublets. It is interesting to note that in Escherichia coli, the Trp operon uses codon doublets in the leader peptides to regulate the levels of tryptophan (24). Our data output suggests that some form of regulation based on same–same codon doublets may be occurring in S. cerevisiae. In general, cluster analysis did not identify genes as being over-represented with multiple codon doublets. One interesting trend that we observed specific to AGA–AGA (Cluster II) was that a large number of ribosomal proteins are over-represented with this doublet specific to arginine, suggesting that this sequence has some regulatory potential in translation associated proteins.
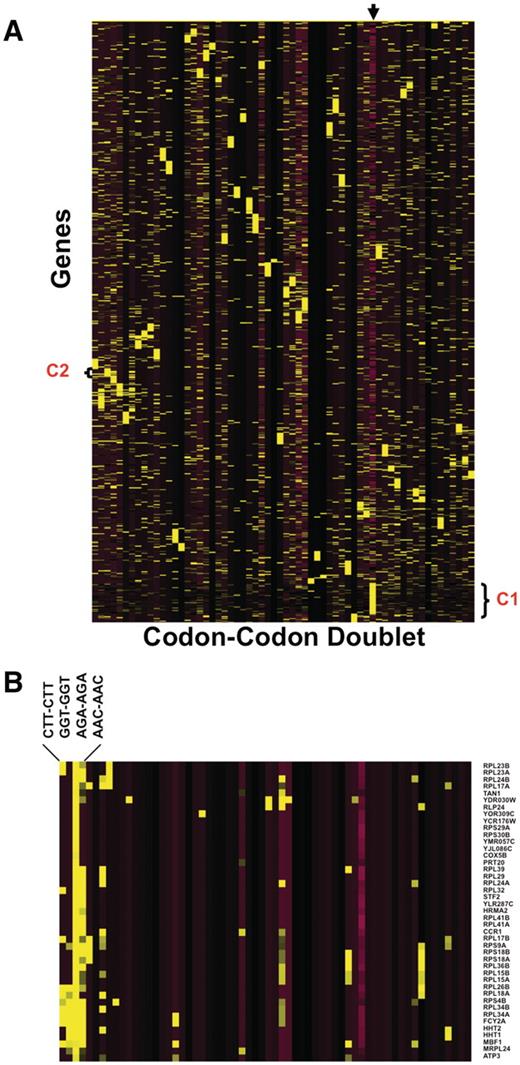
Heat Map identifies groups of genes over-represented with specific codon–codon doublets. Z-scores, describing whether a gene is over- or under-represented with a codon doublet of identical codons, were hierarchically clustered using CLUSTER software. 5780 gene sequences were filtered to remove any gene sequences that did not register at least one Z-score >2 or <−2, leaving 4561 genes for clustering. The clustered data was visualized using TREEVIEW, with yellow and purple boxes depicting over-represented and under-represented doublets, respectively. The genes are organized vertically based on their similarity to each other across all codon–codon doublets, as defined by the clustering algorithm. Similarly, the codon–codon doublets are organized horizontally based on similarity to each other, as defined by the clustering algorithm. (A): The arrow marks the column containing the gene length Z-score, with yellow and purple boxes representing genes larger or smaller than the genome average, respectively. The average genome size is 1401 base pairs with a standard deviation of 1122 base pairs. We have also denoted cluster I (C1), specific to larger than average genes and B) blown up cluster II (C2) for viewing (B).
Conclusions
We have developed an application, database system and visualization approaches to catalogue and analyze codon combinations in all budding yeast genes. Our analysis has identified both extreme codon usage patterns and biological trends in specific gene sets. A recurrent theme of our codon analysis was that translation associated proteins, mainly ribosomal proteins, display distinct usage patterns. These patterns included limited use of the available codons, extreme codon runs and over usage of the AGA–AGA codon doublet. Our application provides users with the ability to methodically analyze codon runs in both genes and genomes and should serve as a starting point for many wet bench laboratories analyzing the effect of codon usage on protein levels.
Funding
Funding for open access charge: National Institutes of Health (ES01225101 and ES015037 to T.J.B.); James D. Watson Award through NYSTAR.
Conflict of interest. None declared.
