


Abstract
Background: For the second time a plan to monitor public health and health inequalities in the Netherlands through general practice was put into action: the Second National Survey of General Practice (DNSGP-2, 2001). The first aim of this paper is to describe the general design of DNSGP-2. Secondly, to describe self assessed health inequalities in the Netherlands. Thirdly, to present differences in prevalence of chronic conditions by educational attainment using both self-assessed health and medical records of GPs. Finally, inequalities in 1987 (DNSGP-1) and 2001 will be compared. Methods: Data were collected from 96 (1987) and 104 (2001) general practices. The data include background information on patients collected via a census, approximately 12 000 health interview surveys per time point and more than one million recorded contacts of patients with their GPs in both years. The method of statistical analysis is logistic regression. Results: The analyses shows that the lower educated have significantly higher odds of feeling unhealthy and having chronic conditions in 2001. Diabetes and myocardial infarction (GP data) showed the largest difference in prevalence between educational groups (OR 2.5 and 2.4, self-reported data). The way the data is collected (self-assessment versus GP registration) hardly affects the magnitude of the educational differences in the prevalence of chronic conditions. The pattern of health inequalities across chronic conditions in 1987 and 2001 hardly differs. Diabetes doubled in prevalence and health inequalities were not significant in 1987, but compared to the other conditions were largest in 2001 (OR 1.1 versus 2.5). Conclusion: Health inequalities were shown to be substantial in 2001 and persistent over time. Socio-economic differences were shown to be similar using self-assessed health data and GP data. Hence, a person's educational attainment did not appear to play a part in presenting health problems to the GP.
Abstract
Key points
Socio-economic differences showed to be similar using self-assessed health data and GP data.
Educational attainment plays no part in presenting health problems to the GP in the Netherlands.
Between 1987 and 2001 diabetes doubled in prevelance and shows large educational differences.
In present day Europe the issue of public health is high on the policy agenda.1 This is important because the health gap between groups with different socio-economic status is present in most Western European countries.2 The literature shows that inequalities in health remained the same over time and there is evidence to indicate a widening gap.3,4
In the Netherlands, the Public Health Status and Forecasts report (1997) (PHSF) advised the Dutch Ministry of Health to install a nationwide monitoring system, containing representative information on morbidity in the population, use of health services at patient level, health determinants and socio-demographic characteristics.5 In 2000 such a plan was put into action: the second Dutch National Survey of General Practice (DNSGP-2). General practice is an optimal setting for providing information on the population's health in the Netherlands (and also in the UK), because it is accessible to all and close to the community.6,7 By basing the study in general practice, we focus on the entry point into the Dutch health care system, which is almost universally through general practice, at least for common conditions. Furthermore, general practice provides information about lifelong disease occurrence registered by medical professionals. The important epidemiological criterion that the whole population at risk is covered is met, since almost all non-institutionalised Dutch citizens are registered with a GP.
Besides a brief introduction of the design of DNSGP-2, this paper aims to describe the health inequalities in Dutch society in 2001 using both self-assessed and GP-presented morbidity and comparing the outcomes with the data of the first national survey (DNSGP-1), which took place in 1987.
Design and data
Study population
DNSGP-2 was carried out in 104 general practices in the Netherlands, comprising 195 GPs (in total 165.5 GP full-time equivalents). The selection of practices was based on three stratification criteria: region (north, central and south), level of urbanisation (five categories) and practice type (single-handed, group). The listed patients were included for DNSGP-2 in the first months of 2000 constituting a cohort of 385 461 persons. During the period of data collection this cohort formed the base population. Figure 1Text box 1 describes the details of the DNSGP-2 data collection.
Response and representativeness
The participating GPs (n=195) are representative of all Dutch GPs (n=7217). No statistically significant differences for age, gender, region of residence or urbanisation were found. A pilot study also showed no differences in practice style between GPs participating in a registration network and those who are not.8 With respect to type of practice, GPs working alone are underrepresented (32 versus 44%). The patients listed in the 104 practices are a good representation of the Dutch population based on the following characteristics: age, gender, type of health insurance. Persons not registered with a GP (e.g. illegal persons) are—of course—missed. At present, approximately 0.5% of the population is estimated to not be registered with a GP, due to various reasons (illegal person, uninsured, shortage of GPs in the area).
The response of the census was 76.5% (base population 385 461) and non-response was shown not to be selective, considering the age and gender of the respondents. With respect to ethnicity of the respondents, the non-indigenous population is underrepresented in the census: 12.5% in the response versus 17.5% in the Dutch population. The response rate of the health interview, a random sample of the total population (385 461), among the Dutch speaking citizens was high (64.5%) and the distribution of the respondents according to age, gender and place of residence was comparable with the sample population.
The response in the additional health interview survey from the immigrant population was 50%. The main reason for non-response was difficulties in reaching people. Non-response analysis shows that the distribution of the four ethnic groups by age and gender is comparable to the immigrant population in the Netherlands. The ICPC-specific contact registration in 104 general practices resulted in a database with roughly 1.6 million contacts, clustered into approximately 950 000 episodes of care. Eight practices were excluded from the database with contacts because of incomplete data collection on morbidity items. The exclusion had no significant effect on the representativeness of the remaining database of contacts.
Analysis
Educational attainment. Educational attainment is measured as follows: none, elementary school, high school and college or university. Two dummies were used to indicate the lowest level (none, elementary school) and the middle level (high school). The reference category (0) is ‘college or university’. Individuals younger than 25 years were excluded from the analysis because, in most cases, the question on educational attainment was not (yet) applicable to them.
Self-assessed health status. Self-assessed (poor) health is measured by the single-item question ‘In general would you describe your health as: (1) very good, (2) good, (3) neither good nor poor, (4) poor or (5) very poor.’9 The five categories were dichotomised into (very) good versus the remaining, coded 0 and 1 respectively. The dependent variable indicates the presence of poor health. Living situation is indicated by the dichotomy ‘living (not) alone’. Ethnicity is measured as non-European immigrants versus the rest. A person's health insurance status is dichotomised as publicly insured (1) versus privately insured (0). Finally, age (continuous, 25 years and over) and gender of the respondents were used as additional individual predictors of subjective health. Odds ratios from the estimated logistic regression model are presented in table 1 and show the effect of individual factors adjusted for the other factors in the model.
Self-assessed and GP-presented chronic conditions. Participants in the health interview were asked whether they suffered from one or more chronic conditions (from a fixed list) in the 12 months preceding the interview. The fixed list of conditions is developed under the auspices of Statistics Netherlands and has been regularly applied in health surveys in the Netherlands in the last decades. For 1987 and 2001 we applied different versions, in each case the latest version available at the moment of data-collection. The list covers a wide range of chronic conditions and includes high blood pressure. Strictly speaking, high blood pressure is a risk factor rather than a chronic condition, but we have chosen to follow the practice of the GPs, and in the contact registration high blood pressure is recorded as a condition (ICPC K86 and K87). Column 1 of table 2 shows the 16 conditions presented to the respondents. The following columns show the absolute number of cases and the percentage of the total population (25 years and over) by educational level. The rightmost columns of table 2 show the results from the condition-specific logistic regression analyses, contrasting the lowest and the highest educational group. The odds ratios (ORs) and the confidence intervals shown were adjusted for age, gender and ethnic differences. The latter is indicated by a dummy measuring whether or not a person is a non-European immigrant. In 8 of the 16 conditions comparisons can be made between DNSGP-1 and -2. Unfortunately, this was not possible for all conditions because the list of chronic conditions was altered between the two time points. In most cases the wording of the items was changed or broadened. Table 2 shows both the prevalence and ORs for the eight chronic conditions in 1987 and 2001.
Table 3 reports on doctor-defined chronic conditions. Doctor defined means presented to and diagnosed by the GP using the International Classification of Primary Care (ICPC). We used year-prevalence data, including existing and new cases, registered in 2001 during DNSGP-2 data collection. The list of 16 self-assessed chronic conditions (table 2) was converted into ICPC codes, shown in column 2 of table 3. Column 3 presents the prevalence per condition: number of cases per 1000 population (25 years and over). Finally, the table shows the ORs—adjusted for age, gender and ethnic differences—indicating the difference in disease prevalence between the lowest and highest educational level. For this a dummy variable was used to indicate the lowest level (none, elementary school). The reference category (0) is ‘college or university’. In table 3, as in table 2, results of 1987 data are not presented. The prevalence data of 1987 are incomparable to the 2001 data, because the registration period differed in length (3 versus 12 months) and the method of data collection (paper versus computer) was changed, and also introduces differences that cannot be adjusted for.
Results
The overall distribution of self assessed health in the study population (25 years and over) for the categories ‘(very) good’ and ‘not good/ poor’ is 77.1 and 22.9%, respectively. Table 1 shows that the odds of having poor(er) health increases with age. Relatively more females than males reported having poor health (OR: 1.07). Compared to people with education at the highest level, feeling unhealthy is more prevalent among people with a low educational level (OR: 1.61). People living alone reported more often to have ‘poor(er) health’: OR 1.38. Non-European immigrants have a much higher risk of feeling unhealthy: OR 2.82. Finally, the publicly insured (lower income) have an odds ratio of 1.55, meaning that the odds of feeling unhealthy is higher compared to the privately insured.
Tables 2 and 3 show results on prevalence of chronic conditions in the Netherlands. Almost two thirds of the respondents (629 per 1000) reported at least one chronic condition in the health interview (table 2, bottom row) in 2001. Roughly one-third (336 per 1000, not in the table) of the total study population reported more than one condition. The top five reported chronic conditions are migraine, osteoarthritis of hip(s) or knee(s), high blood pressure, neck/shoulder disorder and back disorder. These five have a prevalence varying from 139 to 183 per 1000. The number of cases per 1000, standardised to the Dutch population, is shown in parentheses.
In 14 of the 16 chronic conditions the lower educated have a higher prevalence of disease indicated by the ORs. Eight of these odds ratios are statistically significant (p < 0.01). Only in the case of cancer is the age and gender adjusted OR 0.68 (p < 0.01), indicating that the higher educated have a higher prevalence of cancer.
Table 3 shows the prevalence of chronic conditions as presented to and recorded by the GP in the year of data collection (2000/1). High blood pressure and musculoskeletal disorders occupy positions one to three in the top five most prevalent disorders. Chronic eczema and asthma/COPD rank four and five.
The rank order of conditions by prevalence differs slightly between self assessed (table 2) and GP reported (table 3); the statistical association is moderate: 0.70; p < 0.01 (Spearman's rho). Furthermore, table 3 (bottom row) reports that 410 respondents report at least one condition to the GP. Table 2 showed that 629 of the respondents report at least one condition in the health interview. This means that, on the aggregate level, roughly two-thirds (65%) of people with one or more self assessed chronic condition(s) had also visited the GP with at least one chronic condition. In all but one condition (cancer) the ORs indicate a higher prevalence of having a chronic condition in the lowest educational group. Eleven of the presented ORs are statistically significant. The ORs vary from 1.25 (high blood pressure) to 2.13 (diabetes).
Figure 1 shows the relation between the condition-specific ORs, indicating educational differences for self-assessment data (horizontal axis) and the GP-presented conditions (vertical axis). In general the ORs calculated on the data recorded by GPs are lower than those calculated on self reported conditions, but the differences in prevalence of chronic conditions by educational level correspond fairly well between self-assessed and doctor-presented data (Spearman's rho: 0.84, p < 0.01). Both methods of data collection tell the same story.
Finally, table 2 shows whether or not health inequalities have changed since DNSGP-1 (1987). The final columns show the odds ratios for eight self-assessed chronic conditions. No difference in health inequalities between 1987 and 2001 were observed for six conditions (migraine, high blood pressure, back disorder, asthma/COPD, chronic eczema, cancer). Rheumatoid arthritis and diabetes have insignificant ORs in 1987, but show statistically significant differences by education in 2001. The prevalence of diabetes doubled between 1987 and 2001. In 2001 the lower educated were 2.5 times more likely to report having diabetes, compared to those with the highest level of education.
Discussion
In addition to a general description of the design of DNSGP-2, this article presents results on health inequalities and changes therein over the last 15 years in the Netherlands. Firstly, we observed that the lower educated have a substantially higher prevalence of self-assessed poor health. In particular, non-European immigrants more frequently reported feeling unhealthy. These inequalities are important because self-rated poor health has shown to be a powerful predictor of mortality in general and also in different socio-economic groups.10
Secondly, we observed that the type of health data (self-assessed health versus morbidity presented to the GP) hardly affects the magnitude of the educational differences in the prevalence of chronic conditions. The latter finding implicates that an individual's educational attainment does not obstruct the presentation of health problems to the GP: the gatekeeper of the Dutch health system. In other recent studies, no indication was found that access to and use of general practice in the Netherlands is hampered for the lower socio-economic groups or immigrants.11,12
Thirdly, two-thirds of the study population reported to have at least one chronic condition. Roughly 40% of the population presented a chronic condition to the GP. These figures indicate a high burden of disease, but one should keep in mind that the definition of ‘chronic condition’ in the present study is broad.
Finally, compared to the highest level of education, the lower educated have higher odds of reporting and presenting chronic conditions to the GP, and the pattern of health inequalities across chronic conditions in 1987 and 2001 showed, in general, no reduction of inequality. In six conditions inequalities were shown to be stable over time, but in two cases inequality increased. Diabetes doubled in prevalence between the two surveys. Health inequalities for diabetes and rheumatoid arthritis were not apparent in 1987, but the lower educated had statistically significant higher odds of having diabetes or rheumatoid arthritis in 2001. An inverse association was observed in self-reported and GP-presented cancer. This finding is mainly due to the fact that the different cancer sites were not analysed separately here. From the literature we know that some cancer sites show positive associations, e.g. breast, colon and some show negative associations with socio-economic status, e.g. lung, stomach. Our ‘aggregated’ analysis lacks this level of detail.13
In a recent time-trend analysis, using both income and educational level as socio-economic indicators, Dalstra et al.4 showed that inequalities in self-assessed health persisted with approximately the same magnitude during the 1980s and 1990s. In none of the cases of the health indicators used did inequalities show a clear tendency to diminish. In some cases there was strong evidence that the opposite was the case. Particularly in women a substantial increase in inequalities in self-assessed health was observed, using income as a socio-economic indicator. Past studies on trends in socio-economic inequalities in self-assessed health have shown inconsistent results.4 The current study shows—because GP-diagnosed data show similar results (see figure 1)—that the external validity of inequalities in self-assessed health—at least in the Netherlands—is good. It also showed that educational differences in self-assessed chronic disease did not decrease. In two conditions (rheumatoid arthritis and diabetes) inequalities were observed in 2001, but not in 1987. The growing inequalities by educational attainment reported in previous studies, were recently reviewed by Tang et al.14 These authors showed that there is strong evidence of a negative association between socio-economic position and the prevalence of type 2 diabetes in the literature. Diabetes is an eye-catching example of a disease that seems to cluster in deprived areas and is found among individuals with a low educational attainment, of a lower income or unemployed. In addition, a study conducted in the Netherlands reported that diabetic individuals with low education also utilised fewer health services relevant to diabetic care.15
In the present study self-assessed morbidity was compared to GP-presented morbidity at the aggregate level. A limitation of this exercise is that (dis)agreement at the level of patients is missing. This analysis was recently submitted in a separate paper.16
Tackling health inequalities is an intricate undertaking involving many actors. In the Dutch health care system almost all Dutch residents are registered with a GP and the accessibility of general practice is (still) good. The opportunities intrinsic to this system (e.g. preventive action for defined target groups) are plentiful.5,6
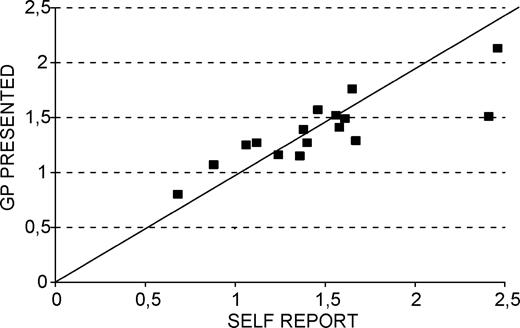
Condition-specific ORs, contrasting low versus high educational level, for self-reported and GP-presented conditions.
Logistic regression results showing odds ratios with 99% confidence intervals by socio-demographic characteristics using DNSGP-2 census data (n = 195,676) 25 years and over, 2001
| Percent cases | OR | OR | |
|---|---|---|---|
| C.I. 99% | |||
| Age (years) | – | 1.04 | 1.03–1.04 |
| Sex (female versus male) | 52.5 | 1.07 | 1.04–1.11 |
| Education (lowest versus highest) | 19.0 | 1.61 | 1.53–1.69 |
| Education (middle versus highest) | 43.1 | 1.15 | 1.10–1.20 |
| Living situation (alone versus not alone) | 15.5 | 1.38 | 1.33–1.43 |
| Ethnicity (non-western versus western) | 4.3 | 2.82 | 2.64–3.01 |
| Insurance (publicly versus privately insured) | 69.5 | 1.55 | 1.49–1.61 |
Prevalence of self-reported chronic conditions by year, by educational level (health interview, n = 8940, age 25 and older) and age-gender adjusted odds ratio for difference between lowest and highest educational level
| Chronic condition (presented in the past 12 months) | Cases per 1000a DNSGP-2, 2001 | Cases per 1000 DNSGP-1, 1987 | % among education low | % among education middle | % among education high | OR age/sex adjusted (low vs high education) DNSGP-2 | C.I.- 99% DNSGP-2 | OR age/sex adjusted (low vs high education) DNSGP-1 |
|---|---|---|---|---|---|---|---|---|
| Migraine/severe headache | 183 (180) | 109 | 18.3 | 19.5 | 15.9 | 1.40* | 1.12–1.74 | 1.33* |
| Osteoarthritis (hip, knee) | 149 (136) | b | 22.5 | 11.3 | 9.0 | 1.67* | 1.29–2.16 | b |
| High blood pressure | 143 (131) | 109 | 17.9 | 13.1 | 10.9 | 1.06 | 0.83–1.37 | 1.08 |
| Neck, shoulder disorder (severe/persistent) | 140 (134) | b | 17.2 | 13.3 | 9.9 | 1.58* | 1.23–2.03 | b |
| Back disorder (severe/persistent) | 139 (134) | 169 | 17.5 | 12.6 | 10.2 | 1.61* | 1.26–2.06 | 1.64* |
| Asthma/COPD | 79 (77) | 70 | 10.0 | 6.8 | 6.4 | 1.46* | 1.07–1.99 | 1.36* |
| Incontinence | 75 (66) | b | 11.7 | 5.5 | 4.4 | 1.56* | 1.11–2.20 | b |
| Chronic eczema | 61 (60) | 59 | 5.4 | 6.6 | 6.3 | 0.88 | 0.62–1.24 | 0.83 |
| Cancer | 59 (54) | 12 | 7.1 | 5.1 | 5.5 | 0.68* | 0.48–0.96 | 0.62 |
| Rheumatoid arthritis | 51 (47) | 43 | 6.6 | 4.7 | 3.3 | 1.38* | 0.93–2.06 | 0.73 |
| Diabetes | 46 (42) | 27 | 7.5 | 3.3 | 2.1 | 2.46* | 1.51–4.00 | 1.14 |
| Myocardial infarction | 38 (35) | b | 6.0 | 3.2 | 1.5 | 2.41* | 1.38–4.20 | b |
| Intestine disorder (severe/persistent) | 37 (35) | b | 4.4 | 3.6 | 2.8 | 1.24 | 0.78–1.97 | b |
| Vascular disorder | 34 (31) | b | 5.3 | 2.6 | 1.9 | 1.65 | 0.99–2.78 | b |
| Stroke | 28 (26) | b | 3.8 | 2.6 | 1.6 | 1.36 | 0.76–2.44 | b |
| Psoriasis | 26 (25) | b | 2.8 | 2.4 | 2.6 | 1.12 | 0.67–1.85 | b |
| One or more chronic condition(s) | 629 (635) |
*p < 0.01.
Number of cases per 1000 standardised to Dutch population (July 2001) in parentheses.
Not comparable between DNSGP-1 and -2.
Prevalence of to the GP presented chronic conditions by educational level [GP registration, n = 196.486 (census response), age 25 and older] and age-gender adjusted OR for difference between lowest and highest educational level
| Chronic condition (self-assessment rank order) | ICPC codes | Prevalence ranking | 1 year period prevalence (cases per 1000) | OR age/sex adjusted (low vs high education) DNSGP-2 | C.I. 99% |
|---|---|---|---|---|---|
| Migraine/severe headache | N01–N03,N89,N90,N92 | 7 | 36.6 | 1.27* | 1.14–1.42 |
| Osteoarthritis (hip, knee) | L84,L89–L91 | 8 | 23.2 | 1.29* | 1.13–1.48 |
| High blood pressure | K85–K87 | 1 | 111.0 | 1.25* | 1.17–1.33 |
| Neck, shoulder disorder (severe/persistent) | L01,L08,L83,L92 | 3 | 84.2 | 1.41* | 1.31–1.51 |
| Back disorder (severe/persistent) | L02,L03,L85,L86 | 2 | 97.8 | 1.49* | 1.40–1.60 |
| Asthma/COPD | R91,R95,R96 | 5 | 40.6 | 1.57* | 1.42–1.73 |
| Incontinence | U04,D17,P12 | 14 | 9.2 | 1.52* | 1.22–1.91 |
| Chronic eczema | S86–S88 | 4 | 69.4 | 1.07 | 0.99–1.16 |
| Cancer | A79,B72,B73,B74,D74–D77, F74H75, K72,L71,R84,R85,S77, S80,T71,T73,U75–U77,U79, W72,X75–X77,X81,Y77,Y78 | 10 | 17.2 | 0.80* | 0.69–0.92 |
| Rheumatoid arthritis | L88,T92 | 11 | 14.0 | 1.39* | 1.17–1.64 |
| Diabetes | T88,T90 | 6 | 39.9 | 2.13* | 1.91–2.37 |
| Myocardial infarction | K75,K76 | 13 | 11.5 | 1.51* | 1.26–1.82 |
| Intestine disorder (severe/persistent) | D81,D85,D86,D92–D94 | 9 | 19.3 | 1.16 | 1.00–1.34 |
| Vascular disorder | K91,K92 | 15 | 5.9 | 1.76* | 1.35–2.30 |
| Stroke | K89,K90 | 12 | 11.9 | 1.15 | 0.96–1.39 |
| Psoriasis | S91 | 16 | 4.8 | 1.27 | 0.95–1.69 |
| One or more condition(s) | 410 |
*p < 0.01
Between April 2000 and January 2002 various data collections were performed:
Socio-demographic census: all listed patients (385,461) were approached to co-operate in a census to determine their socio-demographic characteristics (e.g. type of insurance, educational and occupational status, country of birth, etc.). Language: Dutch, English, Turkish, Arabic. In this census people were also questioned about their present general health status (SF-36, one-item question). 294,999 responded: 76.5%.
Contact registration: in the participating general practices approx. 1.5 million contacts with patients during one calendar year—between April 2000 and January 2002—were recorded in the practice computer:
morbidity presented to the GP, coded using the International Classification of Primary Care (ICPC)17
diagnoses presented, at different points in time, are separated into ongoing or new episodes, and contacts for the same ICPC-code are clustered into episodes of disease (949,220)
type of contact is determined (home visit, office consultations, consultations by telephone)
services by the GP following the presented morbidity are recorded (e.g. drug prescription (ATC-coded), referrals (including care type of referral)
over a six-week period (randomly chosen) the GPs recorded:
consultation length
diagnostic and therapeutic activities (e.g. weight assessment, minor surgery)
the type of health complaint presented: somatic versus psychological/social (five-point scale).
Video registration: almost 75% of the GPs (n = 147) participated voluntarily in a video registration of consultations. Twenty consultations per GP were recorded over one or two successive days. The goal of this type of data collection is to determine the doctor's style of communication.
Health interview: approximately 5% of the Dutch-speaking listed patients were asked to participate in a health interview survey (19,685). 12,699 responded (64.5%). Selection for the interview was random, with a fixed target per full-time GP. The interviews were carried out over one year, with a random fourth part per successive quarter of the year. The latter was done to avoid seasonal patterns in morbidity. Children were interviewed by means of a proxy interview of a parent (12–17 years, partly proxy). Roughly 80 interviews per full-time GP were carried out. GPs have no information about which patients were interviewed.
In addition, interviews were held with non-native individuals from Turkey, Morocco, Surinam and the Dutch Antilles. These were interviewed by specialised (non-native) interviewers and, if necessary, in their own language by native interviewers. The sample for this additional interview was drawn from the census data, because this is the only source that gives information on the ethnic background of people in the study population. 2682 were approached and 1339 responded (50%). The 90 minute interviews contain the following sections (instruments):
Socio-demographic characteristics (e.g. household composition, first and current occupation, nationality)18
Health indicators: Quetelet-index, SF-36,19 disability,20 alcohol dependency,21 social problems,22 psychiatric problems,23 Euroqol,24 acute and chronic conditions,18 personality scale25
Health care utilisation, all types available, including self and informal care18
Life style, including the following items nutrition, physical activity, sleeping, alcohol, drugs and tobacco consumption18
Social context characteristics, including social network,18 threatening experiences,26 social support,27 coping,28 loneliness29
Opinions of respondents, including expectations and quality of health care30–32
Cultural identity and adaptation (for a selection of non-European immigrants only).
GP and practice staff survey: GPs, secretaries and practice nurses received a questionnaire, covering a wide range of issues: e.g. organisation of the practice and daily work, co-operation with other care providers, task delegation, attitudes (e.g. prescription of antibiotics, coping with uncertainty, job satisfaction), time management, years of experience. Furthermore, in all practices a standardised visitation instrument33 was completed.
Data linkage
A crucial aspect of the data collection is that the five data modules can be linked to each other by means of a unique anonymous patient and practice identifier. The DNSGP-2 database is hierarchical with patients registered to GPs and GPs—when not working solo—nested within general practices. In terms of survey sampling theory, DNSGP-2 can be characterised as a multistage sampling design. This means that the study population of patients was not directly sampled from the Dutch population, but via the selection of their GP. The effect of this so-called ‘cluster sampling’, can be adjusted for by using existing tools, such as multilevel modelling.
Privacy aspects
Privacy of the participating persons is guaranteed and in accordance with Dutch legislation. Patients were informed about DNSGP-2 prior to start of data collection via announcements in the practice and a personal letter by their GP, which was added to socio-demographic census that was sent to them by mail.
References
Anonymous. Decision No 1786/2002/EC. European Parliament and the council (23 September, 2002). Programme of Community action in the field of Public Health (2003-2008) (http://europa.eu.int/eur-lex/pri/en/oj/dat/2003/c_062/c_06220030315en00140020.pdf).
Mackenbach JP, Kunst AE, Cavelaars AEJM, et al. Socio-economic equalities in morbidity and mortality in Western Europe.
Shaw M, Dorling D, Gordon D, Davey Smith G. The widening gap: health inequalities and policy in Britain. Bristol: Policy Press,
Dalstra JAA, Kunst AE, Geurts JJM, Frenken FJM, Mackenbach JP. Trends in socioeconomic inequalities in the Netherlands, 1981-1999.
Ruwaard D, Kramers PGN. Public health status and forecasts 1997. Health prevention and health care in the Netherlands until 2015. Maarssen: Elsevier/de Tijdstroom,
Fleming DM. The design and management of national morbidity surveys.
Westert GP, Hoonhout LHF, Bakker DH de, Hoogen HJM van den, Schellevis FG. Huisartsen met en zonder elektronisch medisch dossier: weinig verschil in medisch handelen.
Aaronson NK, Muller M, Cohen PD, et al. Cross-validation of item selection and scoring for the SF-12 Health Survey in nine countries: results from the IQOLA Project.
Burstrom B, Fredlund P. Self rated health: is it as good a predictor of subsequent mortality among adults in lower as well as in higher social classes?
Droomers M, Westert GP. Socioeconomic status and GP visits; using multilevel techniques and different data sources.
Stronks K, Ravelli ACJ, Reijneveld SA. Immigrants in the Netherlands: equal access for equal needs?
Loon van AJM. Socioeconomic status, lifestyle and the risk of cancer of lung, breast, colon and stomach. Thesis. University Maastricht,
Tang M, Chen Y, Krewski D. Gender-related differences in the association between socioeconomic status and self-reported diabetes.
Van der Meer JB, Mackenbach JP. The care and course of diabetes: difference according to level of education.
Van der Linden, M.W., Van Lindert, H., Westert, G.P., Schellevis, F.G. Comparison of self-report and doctor defined morbidity for eighteen chronic conditions.
Lamberts H, Woods M, Hofmans-Okkes I. The international classification of primary care in the European Community. Oxford: Oxford University Press,
Schellevis FG, Westert GP, De Bakker DH. Tweede nationale studie naar ziekten en verrichtingen in de huisartspraktijk: vraagstellingen en methoden. Utrecht: Nivel,
Ware JE, Sherbourne CD. The MOS 36-item Short Form health survey (SF-36).I.Conceptual framework and item selection.
McWhinnie JR. Disability assessment in population surveys: results of the OECD common development effort.
Cornel M. Detection of problem drinkers in general practice. Thesis, University of Maastricht,
Hosman CMH. Psychosociale problematiek en hulpzoeken: een sociaal-epidemiologische studie ten behoeve van preventieve geestelijke gezondheidszorg. Lisse: Swets & Zeitlinger,
Goldberg DP. The detection of psychiatric illness by questionnaire. London: Oxford University Press,
Anonymous. EuroQol: a new facility for the measurement of health-related quality of life. The EuroQol group.
Eysenck HJ, Eysenck SBG. Manual of the Eysenck Personality Scales (EPS Adult). London: Hodder & Stoughton,
Brugha TS, Cragg D. The list of threatening experiences: the reliability and validity of a brief life events questionnaire.
Bridges KR, Sanderman R, van Sonderen E. An English language version of the social support list: preliminary reliability.
Endler NS, Parker JD, Butcher JN. A factor analytic study of coping styles and the MMPI-2 content scales.
Russell DW. UCLA Loneliness scale (version 3): reliability, validity, and factor structure.
Sixma HJ, Kerssens JJ, van Campen C, Peters L. Quality of care from the patients' perspective: from theoretical concept to a new measuring instrument.
Wensing M, Grol R, Van Weel C, Felling A. Quality assessment by using patients' evaluations of care.
Lisdonk EHvd. Ervaren en aangeboden morbiditeit in de huisartspraktijk. Een onderzoek met dagboeken. Proefschrift. Nijmegen: Katholieke Universiteit,

Comments