


Abstract
Objective: The purpose of this study was to analyse whether differences exist in social class or education level in coronary heart disease (CHD) secondary prevention and in cardiovascular risk factor control in a universal coverage health care system. Design: Cross-sectional multi-centre study. Participants and setting: 1022 CHD patients recruited from residents in the catchment areas covered by 23 primary health care facilities in Catalonia, Spain. Main outcome measures: Demographic data, cardiovascular co-morbidity, smoking, blood pressure, fasting blood glucose, triglycerides, total cholesterol, HDL and LDL cholesterol, body mass index (BMI), drug therapy used for secondary prevention, educational level, and social class based on occupation. Results: Patients at the lowest educational level were more frequently women, older, and diabetic. Patients in the middle educational level were more frequently smokers than those in the highest or the lowest level (24.7, 8.7, and 12.0%, respectively; P = 0.008) and had better systolic blood pressure levels (125 mmHg (15), 135 mmHg (16), and 134 mmHg (17), respectively; P = 0.001). All educational levels and social classes had similar adjusted rates of risk factor control. Therapeutic management was also similar among all educational levels and social classes, after adjusting for confounders. Conclusions: CHD patients in the lower SES received similar treatment for secondary prevention and achieved similar control of risk factors. No social inequalities were found in secondary prevention in CHD patients using the National Health System in Spain.
Introduction
Coronary heart disease (CHD) is expected to continue to be the predominant cause of death in industrialized countries in the future.1 Many studies have shown a strong relationship between low SES and both adverse cardiovascular risk factor profile and high CHD event rate in high-CHD-incidence regions, including the United States, Canada, the United Kingdom, and Scandinavia.2 In southern Europe the incidence of CHD is lower than in northern Europe and Anglo-Saxon countries, and less is known about this relationship, although the relationship between socioeconomic status (SES) and mortality for all causes has been well established.3 The Whitehall study showed an inverse gradient in mortality, which was highest in the lower employment categories.4 Nevertheless, it is unlikely that differences in mortality among social classes result from differences in medical care.5
On the other hand, although a lower use of preventive interventions in low SES populations has been described in countries with universal coverage health care systems,6 little is known about the possible SES inequalities in secondary prevention in CHD patients. Although many efforts have been made to define specific recommendations aiming at reducing the incidence and recurrences of CHD,7 some authors have shown that socioeconomically disadvantaged individuals are less likely to receive appropriate preventive care.8 Universal health coverage may not be enough to diminish preventive care inequalities.9
The purpose of this study was to analyze clinical trial data to determine whether CHD secondary prevention differs among social class and educational levels in terms of cardiovascular risk factor control and treatment in Catalonia. Spain presents one of the lowest incidences of CHD10,11 and the National Health System provides universal coverage for all the population.
Participants and methods
Design
This is a cross-sectional study embedded in the ICAR clinical trial (Intervención en la Comunidad de Alto Riesgo cardiovascular or, in English, Intervention in the High Coronary Risk Community) described in detail elsewhere.12 This trial aims to compare the 3-year outcome of a group of CHD patients randomly assigned to intensive secondary prevention, strictly applying the European recommendations, with that of a group receiving usual care.
Patients
CHD patients recruited for the ICAR clinical trial from 1999 to 2000.
Inclusion criteria
All patients between 30 and 80 years of age who had suffered either an acute myocardial infarction or unstable angina with electrocardiographic changes or presented an objective demonstration of ischaemia in the 6 years prior to recruitment were eligible for inclusion.
Exclusion criteria
Patients unwilling to participate in the study or with severe psychiatric illness, terminal diseases, physical disability, unstable coronary artery disease, or an acute coronary event within the last three months before data collection were excluded.
Candidate patients were identified from reference hospital discharge records and from primary care and cardiologist outpatient clinic registries where they existed.
Basal data were collected from primary care medical records and by telephonic interview.
Patients were mailed an invitation to participate in the study and a signed informed consent was requested.
Two Ethical Research Committees approved the study protocol.
CHD patients were recruited among the residents in the catchment areas covered by 23 primary health care facilities in Catalonia, Northeastern Spain. Typically each primary health facility provides health care for 5000–25 000 inhabitants.
Variables
Demographic data, the number of consultations with GPs and a cardiologist within the previous year, and smoking status were obtained from medical records. The presence of hypertension, diabetes mellitus, stroke, hypercholesterolaemia, and peripheral arteriopathy was noted. Systolic and diastolic blood pressure, fasting blood glucose, triglycerides, total cholesterol, HDL and LDL cholesterol, body mass index (BMI) [weight (kg)/height (m2)], and drug therapy were also collected from medical records. Antiplatelets, betablockers, angiotensin converting enzyme inhibitors, and lipid-lowering drugs were considered lifesaving drug treatments because of the evidence of their efficacy in secondary prevention.13 Lifesaving drug treatment was considered multiple when two or more of these drugs were used simultaneously.
Educational level was grouped into three categories: high level (patients with university education); middle level (secondary studies up to 16–18 years); and low level (patients who did not receive any education or completed only primary school).14 Social class was measured according to the Spanish National Occupation Classification,15 adapted from the British Registrar General's Scale,16 and grouped into three categories: Classes I and II, professional and intermediate occupations; Class III, skilled occupations; and Classes IV and V, unskilled and manual occupations.
Hypercholesterolaemia was considered well controlled when total and LDL cholesterol levels were <190 and 115 mg/dl, respectively.7
Hypertension was considered well controlled when systolic and diastolic blood pressure were <140 and 90 mmHg, respectively.7
Statistical analysis
The Chi-square test was used to compare proportions among the three educational levels and among the three social class groups. Analysis of variance or the Kruskal–Wallis test were used to compare the means of continuous variables among these groups. Logistic regression was used to determine the odds ratio of good risk factor control for social class and educational level, adjusted for age, sex, and previous co-morbidity. The statistical package SPSS 11.5 for MS Windows was used in the analyses.
Results
Complete data on educational and social class was obtained in 878 patients (85.9%) of the 1022 patients recruited in the ICAR study.
Mean age was 63.9 years (standard deviation 10.0) and 74.7% were men. Only 3.4% of this population had university education, 10.1 % had secondary studies, 73.3% completed only primary school, and 13.2% were illiterate. Only 8.5% of the patients were in higher social classes, 12.5% were skilled workers, and 79.0% were unskilled and manual workers.
A statistically significant direct correlation was observed between educational level and social class (r = 0.4; P < 0.001).
Educational level and patient characteristics
Patients at the lowest educational level were more frequently women, older, and diabetic. The percentage of patients with history of hypertension, hypercholesterolaemia, stroke, and peripheral artery disease was similar among educational levels (table 1).
Characteristics, co-morbidity, and treatment received by CHD patients classified by educational level
| High educational levelaN = 30 | Middle educational levelbN = 86 | Low educational levelcN = 762 | P | P-trend | |
|---|---|---|---|---|---|
| Sex (Men) | 83.3% | 88.2% | 72.4% | <0.01 | <0.01 |
| Age (Years)d | 57.9 (11.3) | 58.7 (11.3) | 64.9(9.5) | <0.01 | <0.01 |
| Cardiovascular co-morbidity | |||||
| Diabetes | 19.2% | 16.9% | 30.6% | 0.01 | 0.01 |
| Hypertension | 44.4% | 48.2% | 56.5% | 0.18 | 0.07 |
| Hypercholesterolaemia | 63.0% | 58.5% | 63.0% | 0.73 | 0.62 |
| Peripheral arteriopathy | 14.8% | 7.4% | 11.4% | 0.45 | 0.79 |
| Stroke | 3.7% | 9.8% | 10.0% | 0.55 | 0.38 |
| Any of above | 80.0% | 79.1% | 85.1% | 0.28 | 0.15 |
| Control by cardiologist | 73.3% | 68.2% | 65.7% | 0.62 | 0.34 |
| Drug therapy | |||||
| Antiplatelet | 66.7% | 77.6% | 77.7% | 0.36 | 0.28 |
| Betablockers | 50.0% | 40.0% | 35.4% | 0.20 | 0.08 |
| ACE inhibitorse | 23.3% | 24.7% | 29.5% | 0.51 | 0.26 |
| Lipid-lowering agents | 60.0% | 62.4% | 54.2% | 0.30 | 0.18 |
| Two or more of the above | 66.7% | 74.4% | 69.4% | 0.58 | 0.74 |
| Calcium channel inhibitors | 16.7% | 35.3% | 43.2% | <0.01 | <0.01 |
| Nitrates | 46.7% | 45.9% | 52.6% | 0.42 | 0.23 |
| Use of insulin or oral hypoglycaemic drugs in diabetic patients | 20.0% | 42.9% | 58.5% | 0.12 | 0.04 |
| Hypotensive therapy in hypertensive patients | 91.7% | 82.5% | 84.9% | 0.74 | 0.83 |
| Lipid-lowering drugs in hypercholesterolaemic patients | 76.5% | 77.1% | 72.0% | 0.71 | 0.45 |
a: University education
b: Secondary studies up to 18 years
c: No studies or primary school only
d: Mean (standard deviation)
e: Angiotensin converting enzyme inhibitors
Although patients with lower educational level were more likely to have received calcium channel blockers than the rest, no differences in lifesaving drug therapy were found. Furthermore, among all the educational level groups there were no differences in the proportion of patients who were checked by a cardiologist in the previous year.
The percentage of patients who had their risk factors controlled was similar among all educational levels. No differences in lipid profile, BMI, and fasting blood glucose were found among the educational level groups. Nevertheless, patients at the middle level had better systolic blood pressure levels than those in high or low level groups (table 2).
Risk factor control of CHDpatients, classified by educational level
| High educational levelaN = 30 | Middle educational levelbN = 86 | Low educational levelcN = 762 | P | P-trend | |
|---|---|---|---|---|---|
| Blood pressure within normal levelsd | 33.3% | 52.3% | 46.1% | 0.19 | 0.71 |
| Total and LDL cholesterol within normal levelse | 23.3% | 22.1% | 17.5% | 0.43 | 0.20 |
| Fasting blood glucose within normal levelsf | 73.3% | 55.1% | 59.1% | 0.45 | 0.64 |
| BMI < 25 kg/m2 | 6.3% | 11.5% | 13.4% | 0.66 | 0.39 |
| Current non-smokers | 91.3% | 75.3% | 88.0% | <0.01 | 0.19 |
| Systolic blood pressure (mmHg) | 135 (16) | 125 (15) | 134 (17) | <0.01 | 0.03 |
| Diastolic blood pressure (mmHg) | 77 (11) | 75 (11) | 78 (10) | 0.22 | 0.20 |
| Total cholesterol (mg/dl) | 200 (35) | 206 (41) | 209 (40) | 0.56 | 0.29 |
| Low-density lipoprotein cholesterol (mg/dl) | 123 (30) | 126 (38) | 132 (36) | 0.35 | 0.15 |
| High-density lipoprotein cholesterol (mg/dl) | 48 (12) | 48 (16) | 50 (14) | 0.62 | 0.34 |
| Triglycerides (mg/dl) | 126 (59) | 147(105) | 134 (74) | 0.45 | 0.65 |
| Fasting blood glucose(mg/dl) | 108 (23) | 114 (34) | 120 (45) | 0.43 | 0.19 |
Mean (standard deviation) if not otherwise indicated
a: University education
b: Secondary studies up to 18 years
c: No studies or primary school only
d: Systolic blood pressure <140 mmHg and diastolic blood pressure <90 mmHg
e: Total cholesterol < 190 mg/dl and low-density lipoprotein cholesterol <115 mg/dl
f: Fasting blood glucose <110 mg/dl
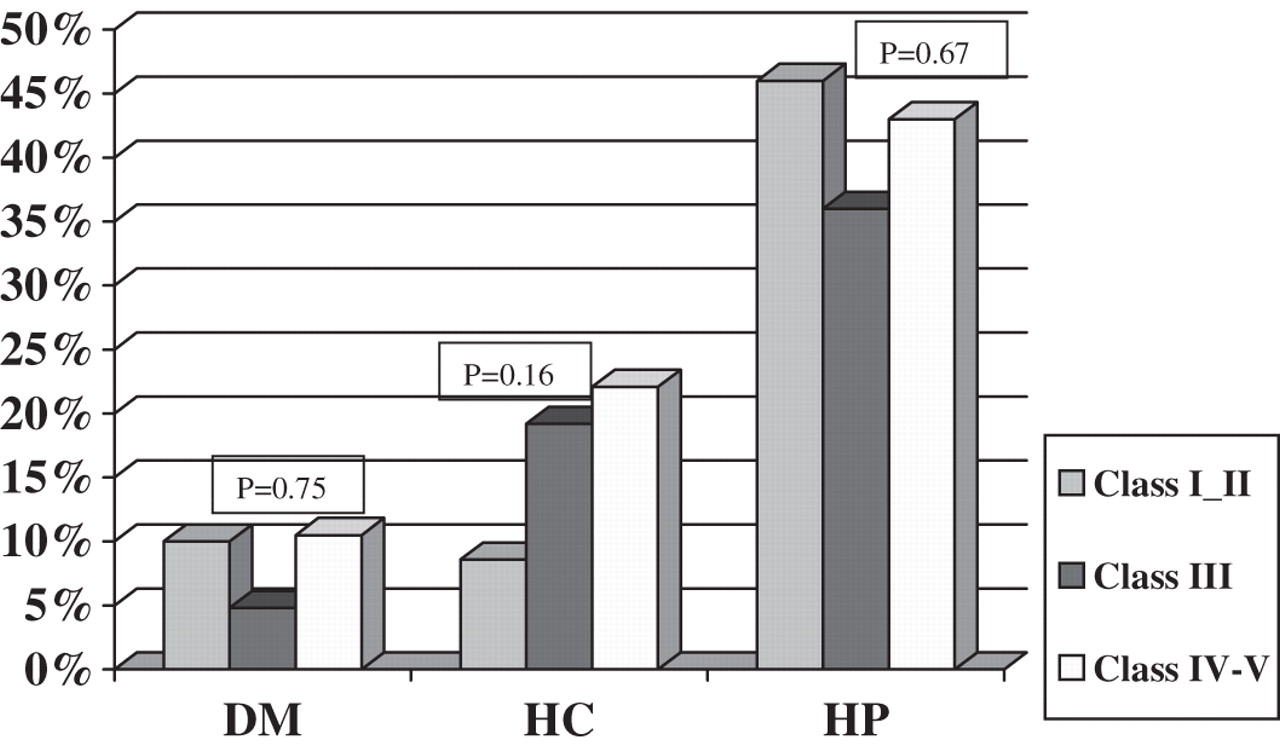
Subgroup analysis of patients with previous co-morbidity (i.e. diabetic, hypercholesterolaemic, or hypertensive patients) showed no differences in the control of blood glucose, lipid profile, or blood pressure, respectively (figure 1).
Percentage of risk factor control achieved in patients with previous co-morbidity (i.e. fasting blood glucose <110 mg/dl in diabetic patients; systolic and diastolic blood pressure <140 and <90 mmHg, respectively, in hypertensive patients; total cholesterol <190 mg/dl and LDL cholesterol <115 mg/dl in hypercholesterolaemic patients), by educational level (high, middle, and low). DM: diabetic patients; HC: hypercholesterolaemic patients; HP: hypertensive patients; low educational level: patients who received no education or primary school only; middle educational level: secondary studies up to 16–18 years; high educational level: university education
Social class and patient characteristics
No differences in co-morbidity or gender of patients were found among social class groups. Patients in social classes IV–V were slightly older (P = 0.06).
The percentage of patients checked by a cardiologist within the year prior to recruitment was similar in all social class groups (table 3).
Characteristics, drug therapy, co-morbidity, and treatment received by CHD patients, classified by social class
| Social classes I and IIaN = 60 | Social class IIIbN = 89 | Social class IV–VcN = 560 | P | P-trend | |
|---|---|---|---|---|---|
| Sex (Men) | 80.0% | 89.8% | 83.2% | 0.21 | 0.88 |
| Age (Years) | 61.2(10.9) | 63.2(10.3) | 64.2(9.9) | 0.06 | 0.02 |
| Cardiovascular co-morbidity | |||||
| Diabetes | 21.1% | 29.1% | 25.0% | 0.54 | 0.84 |
| Hypertension | 52.6% | 50.0% | 52.9% | 0.87 | 0.79 |
| Hypercholesterolaemia | 61.4% | 59.8% | 62.6% | 0.87 | 0.70 |
| Peripheral arteriopathy | 10.5% | 18.4% | 10.0% | 0.06 | 0.26 |
| Stroke | 12.3% | 4.7% | 9.4% | 0.24 | 0.99 |
| Any of above | 83.3% | 88.8% | 83.8% | 0.47 | 0.64 |
| Control by cardiologist | 68.3% | 69.7% | 65.2% | 0.65 | 0.43 |
| Drug therapy | |||||
| Antiplatelet | 80.0% | 82.0% | 79.6% | 0.87 | 0.77 |
| Betablockers | 50.0% | 38.2% | 36.4% | 0.12 | 0.06 |
| ACE inhibitors | 35.0% | 24.7% | 28.2% | 0.39 | 0.51 |
| Lipid-lowering agents | 58.3% | 62.9% | 54.2% | 0.27 | 0.23 |
| Two or more of the above | 81.7% | 74.2% | 69.5% | 0.11 | 0.04 |
| Calcium channel inhibitors | 35.0% | 39.3% | 42.8% | 0.45 | 0.20 |
| Nitrates | 48.3% | 52.8% | 52.6% | 0.81 | 0.60 |
| Use of insulin or oral hypoglycaemic drugs in diabetic patients | 41.7% | 48.0% | 59.0% | 0.34 | 0.15 |
| Hypotensive therapy in hypertensive patients | 93.3% | 84.1% | 86.5% | 0.49 | 0.48 |
| Lipid-lowering drugs in hypercholesterolaemic patients | 8.6% | 19.2% | 22.1% | 0.16 | 0.51 |
ACE: Angiotensin converting enzyme; Mean (standard deviation) if not otherwise indicated
a: Professiomnal and intermediate occupations
b: Skilled occupations
c: Unskilled and manual occupations
Calcium channel blockers, nitrates, and lifesaving drugs were similarly prescribed in all social classes. No differences in the percentage of diabetic patients receiving drug therapy to control diabetes mellitus were found among social class groups. The proportion of hypertensive and hypercholesterolaemic patients who received hypotensive and lipid-lowering agents, respectively, was also similar among social classes.
Similar control of blood pressure, blood glucose, lipid profile, smoking, and BMI was achieved irrespective of the social class (table 4).
Risk factor control of CHD patients, classified by social class
| Social classes I and IIaN = 60 | Social class IIIbN = 89 | Social classes IV and VcN = 560 | P | P-trend | |
|---|---|---|---|---|---|
| Blood pressure within recommended levelsd | 45.0% | 46.1% | 49.3% | 0.75 | 0.42 |
| Total and low-density lipoprotein cholesterol within recommended levelse | 16.7% | 19.1% | 19.5% | 0.87 | 0.63 |
| Fasting blood glucose within recommended levelsf | 62.5% | 53.3% | 61.5% | 0.47 | 0.67 |
| BMI < 25 kg/m2 | 17.1% | 8.1% | 13.2% | 0.39 | 0.99 |
| Current non-smokers | 76.9% | 85.4% | 87.1% | 0.12 | 0.06 |
| Systolic blood pressure (mmHg) | 132 (17) | 133 (14) | 132 (18) | 0.85 | 0.89 |
| Diastolic blood pressure(mmHg) | 77 (10) | 77 (10) | 77 (10) | 0.91 | 0.70 |
| Total cholesterol (mg/dl) | 209 (38) | 204 (37) | 207 (41) | 0.79 | 0.91 |
| Low-density lipoprotein cholesterol(mg/dl) | 135 (39) | 129 (29) | 131 (37) | 0.70 | 0.71 |
| High-density lipoprotein cholesterol(mg/dl) | 51 (17) | 45 (9) | 50 (14) | 0.02 | 0.54 |
| Triglycerides(mg/dl) | 125 (49) | 149 (100) | 133 (74) | 0.22 | 0.81 |
| Fasting blood glucose(mg/dl) | 110 (30) | 119 (44) | 117 (43) | 0.57 | 0.53 |
Mean (standard deviation) if not otherwise indicated
a: Professional and intermediate occupations
b: Skilled occupations
c: Unskilled and manual occupations
d: Systolic blood pressure <140 mmHg and diastolic blood pressure <90 mmHg
e: Total cholesterol< 190 mg/dl and low-density lipoprotein cholesterol<115 mg/dl)
f: Fasting blood glucose <110 mg/dl
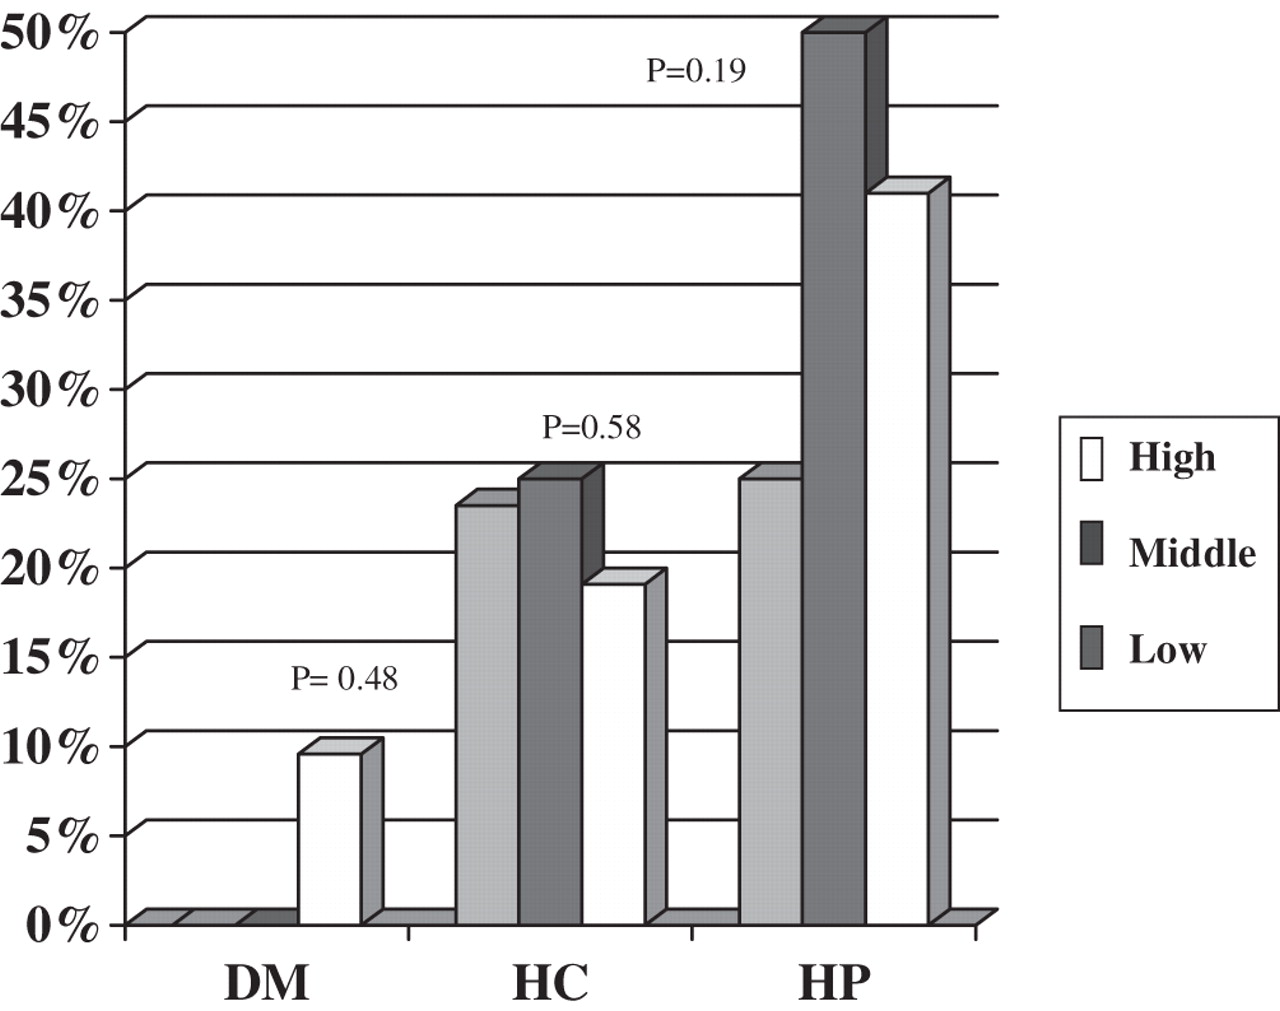
The control of risk factors in patients with previous co-morbidity (i.e. diabetic, hypercholesterolaemic, or hypertensive patients) was also similar in all social class groups (figure 2).
Percentage of risk factor control in patients with previous co-morbidity (i.e. fasting blood glucose <110 mg/dl in diabetics; Systolic and diastolic blood pressure <140 mmHg and <90 mmHg, respectively, in hypertensive patients; total cholesterol <190 mg/dl and LDL cholesterol <115 mg/dl in hypercholesterolaemic patients), by social class. DM: diabetic patients; HC: hypercholesterolaemic patients; HP: hypertensive patients; Social classes I and II: professional and intermediate occupations; social class III: skilled occupations; social classes IV and V: Unskilled and manual occupations
Multivariate analysis
After adjusting for age, sex, and co-morbidity no differences in risk factor control were observed among educational level or social class groups, except for the control of hypercholesterolaemia, which was better achieved by patients at the high educational level (table 5).
Odds ratio of good risk factor control for lower educational and social class levels, adjusted by age, sex, and co-morbidity
| Educational level OR (95% CI) | P | Social class OR (95% CI) | P | |
|---|---|---|---|---|
| Blood pressure within recommended levelsa | 0.92 (0.58–1.62) | 0.77 | 1.27 (0.84–1.93) | 0.25 |
| Total and LDL cholesterol within recommended levelsb | 0.47 (0.25–0.88) | 0.03 | 1.34 (0.77–2.32) | 0.29 |
| Fasting blood glucose within recommended levelsc | 1.01 (0.53–1.94) | 0.96 | 1.31 (0.79–2.16) | 0.29 |
| BMI < 25 kg/m2 | 0.83 (0.32–2.15) | 0.71 | 1.66 (0.72–3.78) | 0.23 |
| Smoking | 0.81 (0.50–1.94) | 0.56 | 0.85 (0.46–1.58) | 0.62 |
Mean (standard deviation) if not otherwise indicated
a: Systolic blood pressure <140 mmHg and diastolic blood pressure <90 mmHg
b: Total cholesterol <190 mg/dl and low-density lipoprotein cholesterol <115 mg/dl
c: Fasting blood glucose <110 mg/dl
The odds ratio of receiving two or more lifesaving preventive drugs for patients in low educational level and social class, after adjusting for age, sex, and co-morbidity, was 0.77, 95% CI 0.42–1.42 (P = 0.41) and 0.84, 95% CI 0.52–1.35 (P = 0.46), respectively.
Discussion
In this study, the delivery of secondary prevention interventions to CHD patients was similar in all SES groups of patients seeking medical care within the Spanish public health care system, which covers the entire population. After adjusting for age, sex, and previous co-morbidity, the achieved risk factor control was also found to be similar except in lipid profile, which was better in patients with a high educational level.
SES is a composite measure that incorporates income, education, and work status. These three indicators are inter-related but not completely overlapping variables.17 Educational level is one of the most widely used indicators of SES because it remains stable over the adult lifespan, and it has also been found to be associated with various health outcomes.18 We also studied social class based on occupation as another socioeconomic indicator to give a more complete perspective on SES characteristics.
In our study, patients in the lower educational level were predominantly women and older people, probably because the accessibility to university education has increased only recently in Spain. Several decades ago, women and less affluent people had more limited access to higher education.19
The presence of differences in the proportion of cardiovascular risk factors among SES levels remains controversial.20–24 In our study the prevalence of hypertension, hypercholesterolaemia, peripheral artery disease, and stroke observed was similar for all SES levels.
Previous data from population studies in Spain showed a higher prevalence of CHD risk factors in patients with lower educational level25; in addition, in these patients a lower risk factor modification capacity after a coronary event has been noted in other countries.8 Although in recent years smoking is on the decline among men in higher SES groups in the Spanish population,26 in our study no differences were found among SES groups in the prevalence of smoking in the CHD patients cohort. This finding could be explained by the high mean age of the population studied, which makes it difficult to introduce behavioural changes.
Many studies have shown that lower education and income level groups have poor access to health services27 and receive less intensive preventive care.28 This was not confirmed in our study. Nevertheless, these differences in quality of care and health outcomes are not fully explained by difficulty with accessibility, as was shown in studies that included medical insurance participants.29 Inequalities in the access to dentistry and gynaecological preventive care observed in previous reports from Spain could be related both with educational level and with income, because dental preventive services are not covered by health insurance and the waiting list for gynaecological preventive care is quite long.25
In our study, differences in the access to health system were not found. The proportion of patients checked by a cardiologist in the year prior to recruitment and the proportion of CHD patients using lifesaving drugs did not vary among SES levels.
These results support the observations from other studies, which suggested that differences in preventive interventions received by disadvantaged individuals may stem from other reasons than the general practitioners' provision of health care.20
Good primary care has been found to be associated with reductions in disparities between more disadvantaged and less disadvantaged communities.30 Our findings concur with other Spanish studies, support the claim that in some aspects the National Health Service can provide equity,31 and suggest that this goal is met for CHD secondary prevention.
Study characteristics
The external validity of our study is reasonable because the proportion of subjects in high SES in our sample was similar to that described in the Spanish population.32 An important characteristic of our study is that our patients were consecutively recruited from GP centres. It is possible that a small proportion of patients in higher SES did not use the National Health System. One study showed that the proportion of patients who were admitted in private hospitals to undertake coronary surgery in Spain was <16%.33 On the other hand, 67–80% of the population consults with their GP each year34,35 and their medical information is usually updated at that time. However, the possibility that some low SES individuals were missed in our study cannot be ruled out, given the fact that the catchment setting was primary care centres.
Moreover, the purpose of this study was to determine whether differences among educational level and SES existed in CHD patient management and in the risk factor control achieved. Although a relationship between educational level and social class based on occupation was found, results differed because they measure different SES dimensions. Control of cardiovascular risk factors achieved by CHD patients was similar among the different SES groups.
We conclude that secondary prevention in the Spanish National Health System is provided equitably to all patients who request medical care after a CHD event in the primary care centres.
Socioeconomic inequalities in the secondary prevention of coronary heart disease were analysed in a universal health system coverage.
Therapeutic management and risk factor control level was found to be similar in all socioeconomic levels.
Our results suggest that a public National Health System with universal coverage prevents socioeconomic inequalities among its users.
See the full roster of ICAR investigators on the following website: www.regicor.org/ICAR_inv
The authors wish to thank Elaine Lilly for her English revision of the text. This study was partially funded by grants from Institut Municipal d'Investigació Mèdica, Fundació Jordi Gol i Gurina, Fundación Mapfre, and by the following Spanish Fondo de Investigación Sanitaria research networks: RECAVA (grant FIS C03/01), RCESP (grant FIS C03/09), and HERACLES (grant FIS G03/045).
References
Murray CL, López A. Alternative projections of mortality and disability by cause 1990–2020: Global burden of disease study.
Kaplan G, Keil J. Socioeconomic factors and cardiovascular disease: a review of the literature.
Mackenbach J, Kunst A, Cavelaars A, et al. Socioeconomic inequalities in morbidity and mortality in western Europe. The EU Working Group on Socioeconomic Inequalities in Health.
Van Rossuma C, Shipleyc M, Van de Mheenb H, et al. Employment grade differences in cause specific mortality. A 25 year follow up of civil servants from the first Whitehall study.
Lostao L, Regidor E, Calle ME, et al. Evolución de las diferencias socioeconómicas en la utilización y accesibilidad de los servicios sanitarios en España entre 1987 y 1995/97.
De Backer G, Ambrosioni E, Borch-Johnsen K, et al. European guidelines on cardiovascular disease prevention in clinical practice: Third Joint Task Force of European and Other Societies on Cardiovascular Disease Prevention in Clinical Practice.
Wilhelmsen L, Rosengren A. Are there socio-economic differences in survival after acute myocardial infarction?
Katz S, Hofer T. Socioeconomic disparities in preventive care persist despite universal coverage. Breast and cervical cancer screening in Ontario and the United States.
Pérez G, Pena A, Sala J, et al. Acute myocardial infarction case fatality, incidence and mortality rates in a population registry in the province of Gerona, Spain 1990 to 1992.
Tunstall-Pedoe H, Kuulasmaa K, Amouyel P, et al. Myocardial infarction and coronary deaths in the World Health Organization MONICA project.
Muñoz MA, Marrugat J. La prevención secundaria de la enfermedad coronaria es menos agresiva en los pacientes de más de 64 años.
Brady AJB, Oliver MA, Pittard JB. Secondary prevention in 24,431 patients with coronary heart disease: Survey in primary care.
Cavelaars A, Kunst A, Geurts J, et al. Differences in self reported morbidity by educational level: A comparison of 11 western European countries.
Domingo A, Marcos J. Propuesta de un indicador de la clase social basado en la ocupación.
Adler N, Boyce T, Chesney MA, et al. Socioeconomic status and health: The challenge of the gradient.
Wiggers J, Sanson-Fisher R. Practitioner provision of preventive care in general practice consultations: association with patient educational and occupational status.
Grupo de Trabajo de la Sociedad Española de Epidemiología. La medición de la clase social en ciencias de la salud. Barcelona: SG Editores,
Luepker RV, Rosamond WD, Murphy R, et al. Socioeconomic status and coronary heart disease risk factor trends. The Minnesota Heart Survey.
Keil JE, Sandifer SH, Loadholt CB, Boyle E. Skin color and education effects on blood pressure.
Sorel JE, Ragland DR, Syme SL, Davis WB. Educational status and blood pressure: the Second National Health and Nutrition Examination Survey, 1976–1980, and the Hispanic Health and Nutrition Examination Survey, 1982–1984.
Kuskowska-Wolk H, Bergstrom R. Trends in body mass index and prevalence of obesity in Swedish men 1980–1989.
Medalie J, Papier C, Herman J, et al. Diabetes mellitus among 10,000 adult men, I: Five-year incidence and associated variables.
Informe SESPAS
Brook R, Kamberg C, Lohr K, et al. Quality of ambulatory care. Epidemiology and comparison by insurance status and income.
Shi L, Starfield B, Politzer R, Regan J. Primary care, self-rated health, and reductions in social disparities in health.
Borrell C, Fernandez E, Schiaffino A, et al. Social class inequalities in the use of and access to health services in Catalonia, Spain: what is the influence of supplemental private health insurance?
Análisis comparativo de la encuesta nacional de salud. Año
Permanyer Miralda G, Brotons Cuixart C, Ribera Solé A, et al. Desigual perfil clínico, calidad de vida y mortalidad hospitalaria en pacientes operados de injerto aortocoronario en centros públicos y privados de Cataluña.
Brugulat P, Juncà S, Martínez V, et al. La salut i els serveis sanitaris a Catalunya: la visió dels ciutadans l'any 2002. Barcelona: Direcció General de Salut Pública,

Comments