


Abstract
The Sonoda–Tajima Cell Collection includes cell samples obtained from a range of ethnic minority groups across the world but in particular from South America. The collection is made all the more valuable by the fact that some of these ethnic populations have since died out, and thus it will be impossible to prepare a similar cell collection again. The collection was donated to our institute, a public cell bank in Japan, by Drs Sonoda and Tajima to make it available to researchers throughout the world. The original cell collection was composed of cryopreserved peripheral blood samples that would obviously have been rapidly exhausted if used directly. We, therefore, immortalized some samples with the Epstein–Barr virus and established B-lymphoblastoid cell lines (B-LCLs). As there is continuing controversy over whether the B-LCL genome is stably maintained, we performed an array comparative genomic hybridization (CGH) analysis to confirm the genomic stability of the cell lines. The array CGH analysis of the B-LCL lines and their parental B cells demonstrated that genomic stability was maintained in the long-term cell cultures. The B-LCLs of the Sonoda–Tajima Collection will therefore be made available to interested scientists around the world. At present, 512 B-LCLs have been developed, and we are willing to increase the number if there is sufficient demand.
Introduction
Human T-lymphotropic virus type 1 (HTLV-I) is the causative virus of adult T-cell leukemia (Uchiyama et al. 1977) and HTLV-I–associated chronic myelopathy (Osame et al. 1986). HTLV-I is distributed worldwide and is phylogenetically classified into three major subtypes: the Central African group detected in the Central African continent; the Melanesian group located around Australia; and the Cosmopolitan (Mongoloid) group widely spread across the Asian region of the Eurasian continent (reviewed by Yamashita et al. 1996 and by Sonoda et al. 2011). HTLV-II, which is closely related to HTLV-I but is a distinct virus, is also classified into two major groups, HTLV-IIa and HTLV-IIb. HTLV-II is also detected worldwide and its distribution shows some geographic bias, that is, HTLV-IIa0 and a3 were predominantly detected in nonindigenous populations in North America; a4 and b1 were specifically detected in indigenous people in North and South America, respectively; b5 was mainly detected in indigenous populations in both North and South America; Only a2 and b4 were detected within European populations (Switzer et al. 1995).
To confirm the reported patterns of geographic and ethnic segregation of human HTLV-I and -II in human populations, Sonoda, Tajima and colleagues conducted seroepidemiological studies of indigenous populations in South America who lived in closed societies (Komurian-Pradel et al. 1992; Ijichi et al. 1993; Miura et al. 1994, 1997; Fujiyoshi et al. 1999; Li et al. 1999). In this series of analyses that included both extant populations and the preserved remains of prehistoric mummies, they showed that the Amerind populations retained the Mongoloid subtype of HTLV-I (Miura et al. 1994, 1997; Li et al. 1999; reviewed by Sonoda et al. 2011) and a distinctive subclass of HTLV-IIb (Ijichi et al. 1993; Miura et al. 1997). They also showed that there was a geographic bias in the distribution of HTLV-I/-II carriers: HTLV-I predominated in the Andes Highlands, whereas there were foci of HTLV-II in the lowlands of South America. From these results, they concluded that ancestors of the Amerind populations carried HTLV-I and -II into the South American continent from the Eurasian continent over 10,000 years ago and that the indigenous South American populations could be divided into two major ethnic groups.
During the course of these studies, a number of peripheral blood samples were obtained and cryopreserved with the consent of the donors, not only for immediate use but also for future studies. In addition to these samples, many other peripheral blood samples were collected from isolated ethnic populations in various areas around the world (fig. 1). All these samples have been donated to a not-for-profit public cell bank held at the Cell Engineering Division of RIKEN BioResource Center in Tsukuba, Japan. Overall, more than 3,500 blood samples were donated to the cell bank.
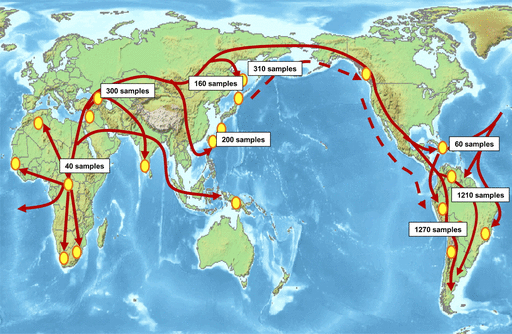
Hypothetical pathways of prehistoric human migration. Red arrows indicate hypothetical prehistoric migration routes of humans after leaving Africa approximately 70 thousand years ago. The numbers in boxes indicate the number of individuals who donated blood samples. The yellow circles indicate the approximate geographic locations where the blood samples were collected.
One obvious problem with these cryopreserved peripheral blood samples is that if they are used for experimental studies, then they would quickly run out. Because these samples are an extremely precious resource for future research in human genetics, it was decided that they should be preserved in a form that could be expanded repeatedly. One well-established method is to transform B-lymphoid cells in peripheral blood using the Epstein–Barr virus (EBV) (Nilsson 1979). The genomic stability of B-lymphoblastoid cell lines (B-LCLs) transformed by EBV has been evaluated, such as by karyotyping using conventional G-band staining (reviewed by Nilsson 1992; Okubo et al. 2001) and by analysis of particular genetic loci for mutations (Lalle et al. 1995). Those analyses indicate that the genome of these B-LCLs is stable. Recent technical advances have now opened up the possibility of a more stringent evaluation of genomic stability in B-LCLs. For example, Simon-Sanchez et al. (2006) and Herbeck et al. (2009) compared genome-wide single-nucleotide polymorphism (SNP) patterns in B-LCLs and parental B cells (i.e., the original cells that B-LCLs were derived from) and concluded that there were no statistically significant differences between the cell types. By contrast, the Wellcome Trust Case Control Consortium analyzed copy number variation (CNV) over 3,400 loci and detected differences between B-LCLs and their parental cells at a significant number of loci (The Wellcome Trust Case Control Consortium 2010).
To analyze the genomic stability of B-LCLs, we performed array comparative genomic hybridization (CGH) analysis using 11 B-LCLs and their parental cells. This analysis confirmed the stability of the genomes of the B-LCLs. We have, therefore, now established more than 500 B-LCLs from the cryopreserved cell samples of the Sonoda–Tajima Collection. The samples used for establishing B-LCLs were selected to include as many ethnic populations from South America as possible.
Materials and Methods
Peripheral Blood Samples
The ethnic populations who kindly donated peripheral blood samples following informed consent and the numbers of individuals involved are given in table 1. The approximate geographic locations where the samples were collected are shown in figure 2. Peripheral blood mononuclear cells (PBMNCs) were separated from each blood sample and cryopreserved in liquid nitrogen until use in this study. The ethical committee of the RIKEN Tsukuba Institute approved the use of these samples before the study was initiated.
Mongoloid Minority Populations Included in This Study
| Country | Location | Tribe | Other Name | Latitude (degrees N) | Longitude (degrees W) | B-LCL | Established | |
| M | F | Total | ||||||
| Venezuela | 1 | Sanema (Sanumá) | Sanumá, Chirichano, Guaika, Samatali, Samatari, Sanima, Tsanuma, Xamatari | 3.5 | 64.5 | 13 | 9 | 22 |
| 2 | Ye'Kuana | Maquiritari, Cunuana, De'cuana, Maiongong, Maquiritai, Maquiritare, Pawana, Soto, Ye'cuana | 3.5 | 64.5 | 6 | 14 | 20 | |
| Colombia/Venezuela | 3 | Piaroa | Adole, Ature, Guagua, Kuakua, Quaqua | 5 | 67 | 2 | 2 | 4 |
| Colombia | 4 | Amorua; Guahibo | –– | 6 | 67.5 | 0 | 2 | 2 |
| 5 | Etnia Siquani; Guahibo | –– | 6 | 67.5 | 2 | 1 | 3 | |
| 6 | Siquani; Guahibo | –– | 6 | 67.5 | 4 | 1 | 5 | |
| 7 | Guahibo | Goahibo, Goahiva, Guaigua, Guajibo, Guayba, Sicuani, Sikuani, Wahibo | 6 | 67.5 | 3 | 2 | 5 | |
| 8 | Ticuna | Tikuna, Tucuna, Tukúna | 4 | 69.5 | 6 | 14 | 20 | |
| 9 | Wayu | Wayuu, Guajiro, Goajiro, Guajira, Uáira, Waiu, Wayúu, Wayuunaiki | 11.5 | 73 | 36 | 62 | 98 | |
| 10 | Wayuu Epiayu | –– | 11.5 | 73 | 0 | 2 | 2 | |
| 11 | Wayuu Puchaina | –– | 11.5 | 73 | 1 | 1 | 2 | |
| 12 | Wayuu Uriana | –– | 11.5 | 73 | 2 | 2 | 4 | |
| 13 | Matapi | Yucuna, Yukuna | −1 | 69.5 | 1 | 0 | 1 | |
| 14 | Miraña | Bora, Boro, Meamuyna | −1 | 69.5 | 0 | 1 | 1 | |
| 15 | Cumbal | –– | 1 | 78 | 4 | 11 | 15 | |
| 16 | Inga | Highland Inga | 1 | 77 | 3 | 13 | 16 | |
| 17 | Kamsa | Camsá, Camëntsëá, Coche, Kamemtxa, Kamse, Sibundoy | 1 | 77 | 3 | 17 | 20 | |
| Ecuador | 18 | Cañar | Cañar Highland Quichua | −2.5 | 79 | 7 | 20 | 27 |
| 19 | Saraguro | Loja Quichua, Saraguro Quichua | −3.5 | 79.5 | 7 | 15 | 22 | |
| Bolivia | 20 | Aymara | –– | −16 to −18.5 | 68.5–69 | 15 | 13 | 28 |
| 21 | Chipaya | Puquina | −18.5 | 68.5 | 5 | 3 | 8 | |
| 22 | Quechua | North La Paz Quechua | −21.5 to −21 | 66–67.5 | 13 | 12 | 25 | |
| 23 | Mestizo | –– | −20 to −21 | 65.5–66 | 2 | 1 | 3 | |
| Paraguay | 24 | Chaco (Lengua) | Enxet | −22.5 | 59.5 | 18 | 17 | 35 |
| 25 | Chaco (Nivaclé) | Ashlushlay, Axluslay, Chulupe, Chulupí, Chulupie, Churupí, Nivaklé | 22.5 | 59.5 | 9 | 2 | 11 | |
| 26 | Chaco (Sanapaná) | Lanapsua, Quiativis, Quilyacmoc, Saapa, Sanam | −22.5 | 59.5 | 1 | 0 | 1 | |
| Chile | 27 | Atacama | Kunza, Atacameño, Likanantaí, Lipe, Ulipe | −23 to −23.5 | 68 | 14 | 13 | 27 |
| 28 | Mapuche | Mapudungun, Araucano, Mapudungu | −39 | 71.5–72 | 26 | 33 | 59 | |
| 29 | Huilliche | Huiliche, Veliche | −43 | 73 | 5 | 4 | 9 | |
| Argentina | 30 | Puna | –– | −22.5 | 65.5 | 7 | 17 | 24 |
| Total | 215 | 304 | 519 | |||||
NOTE.––Other names were referred to by Ethnologue country index (http://www.ethnologue.com/country_index.asp); ‘––’ indicates not entried in Linguist group.
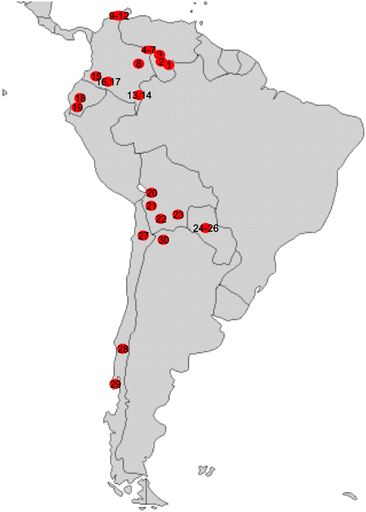
Geographic locations where blood samples were collected. Red circles indicate the approximate locations where the blood samples were collected. The numbers in circles correspond to the location numbers in table 1.
Establishment of B-LCLs
B-LCLs were established using previously reported methods (Bird et al. 1981; Rickinson et al. 1984). The B95-8 cell line was obtained from the Cell Resource Center for Biomedical Research, Tohoku University (Sendai, Miyagi, Japan) and cultured in RPMI 1640 (Gibco) supplemented with 10% fetal bovine serum (FBS). The culture supernatant of the B95-8 cells was collected, filtered to remove cells, cryopreserved, and used as the source of EBV. For infection of PBMNCs with EBV, the B95-8 culture supernatant was thawed and incubated with the PBMNCs at 37 °C for 2 h. The cells were then washed with RPMI, resuspended in RPMI1640 supplemented with 20% FBS and 0.5 μg/ml cyclosporin A (Sandimmun; Novartis Pharma), inoculated into a multiwell plate at a cell density of approximately 2 × 10⁵ cells/cm2, and cultured. Half of the medium was changed twice a week with replacement by fresh medium. After a few weeks and upon confirming efficient proliferation of the cells, the cultures were scaled up using a 2- to 4-fold dilution into 75-cm2 culture flasks. B-LCLs around passage 10 were deposited in the cell bank of the Cell Engineering Division of RIKEN BioResource Center (RIKEN Cell Bank) and were used for the following analyses.
Microsatellite Polymorphism Analysis
To authenticate the identity of each cell line, short tandem repeat (STR) polymorphisms in microsatellites were analyzed in genomic DNA using the PowerPlex1.2 kit (Promega). This PCR-based analysis kit includes the primer sets required to detect STR polymorphisms at eight loci (Masters et al. 2001; Yoshino et al. 2006).
Karyotype Analysis
Chromosome preparations were made in a standard fashion and then G-banded (Yunis et al. 1978). Chromosome numbers were counted in 50 cells (mode analysis), and then the G-band pattern was analyzed in detail in 20 of the cells to identify chromosome aberrations (karyotype analysis). These analyses were performed for us by Nihon Gene Research Laboratories (Sendai, Miyagi, Japan).
Collection of B-Lineage Cells from Blood Samples
The anti-FITC (fluorescein isothiocyanate) MultiSort Kit (Miltenyi Biotech) and an MACS MS column (Miltenyi Biotec) were used to collect CD19-positive (CD19+) B-lineage cells from PBMNCs and umbilical cord blood mononuclear cells according to the manufacturer's instructions with slight modification. Briefly, to remove any dead cells, approximately 5 × 10⁷ cells were passed through the column without staining with antibodies. Phosphate-buffered saline supplemented with 0.5% FBS and 0.05% sodium azide was used to wash the column. The collected viable cells were stained with FITC-labeled anti-human CD19 antibody (BD Biosciences) and then reacted with anti-FITC MultiSort beads. We collected CD19+ B-lineage cells attached to MultiSort beads. After removal of the beads by proteolytic cleavage, genomic DNA was extracted from the cells. Cell numbers at each step were counted with a hematocytometer, and the purity of the CD19+ cells was analyzed with an FACS Calibur flow cytometer (BD Biosciences). On average, approximately 5 × 10⁵ CD19+ cells were collected from 5 × 10⁷ PBMNCs.
Array CGH Analysis
Genomic DNA was obtained from the cells using a DNeasy Blood and Tissue Kit (Qiagen). Preparation of the fluorescent-labeled samples for array CGH analysis was performed according to the manufacturer's instructions. Briefly, 1.0–1.5 μg of genomic DNA was digested with the restriction endonucleases AluI and RsaI. Then, genomic DNAs from PBMNCs and CD19-negative (CD19−) cells were labeled with cyanine 3-dUTP (Cy3) and genomic DNAs from B-LCLs and CD19+ cells were labeled with cyanine 5-dUTP (Cy5) using a Genomic DNA Enzymatic Labeling Kit (Agilent). After evaluating labeling efficiency, Cy3-labeled and Cy5-labeled DNAs were mixed in the Oligo aCGH/ChIP-on-chip Hybridization Kit (Agilent) and then hybridized on a SurePrint G3 Human CGH 2 × 400 K microarray (Agilent) at 65 °C for 40 h in a hybridization oven, with rotation at 20 rpm. The microarrays were scanned with a DNA Microarray Scanner (Agilent) at 3-μm resolution. To quantify the intensity of the fluorescent signal of each spot on the microarray, we used Feature Extraction software version 10.5.1.1 (Agilent).
Statistical Analysis
The array CGH analysis data were evaluated to identify genomic alterations by a statistical analysis with Genomic Workbench Standard Edition version 5.0.14 (Agilent). The conditions and parameters of the statistical analysis were as follows: the Moving Average (log ratio) algorithm was linear at a 2-Mb window size, the ADM-2 algorithm threshold was set to 6.0 with Fuzzy Zero, the aberration filters were applied at a minimum number of probes of 3 in the region and 0.5 minimum absolute average log ratio for the region. After the first screening described above, the raw data of selected loci were individually scrutinized. As a result, some “aberrations” were removed from the aberration list because they were located within a noisy area, such at the telomeres, and the reliability of the aberration calls in such region was low. Although Genomic Workbench Standard Edition version 5.0.14 adopts hg18 for gene mapping, we referred to Build 36.3 in the Map Viewer constructed by National Center for Biotechnology Information (http://www.ncbi.nlm.nih.gov/projects/mapview/) for detailed mapping of genes.
V(D)J Recombination Analysis
Recombination in the V(D)J region of the immunoglobulin (Ig) heavy-chain gene in B-LCLs was analyzed by PCR as described previously with slight modification (Kiyoi et al. 1992; Abe et al. 1994). The primers used for the PCR were 5′-GAG TCG AC(A/T) C(A/G)G C(G/CXG/A)T GTA (T/C)T(T/A) CTG-3′ for the V common region and 5′-CCA AGC TTA CCT GAG GAG ACG GTG A-3′ for the J common region. PCR was performed using an ExTaq polymerase kit (TaKaRa Bio) with a reaction mixture containing 0.4 μM of the J common primer and 4 μM of the V common primer. An initial incubation at 94 °C for 5 min was followed by 40 cycles of denaturation at 94 °C for 10 s, annealing at 60 °C for 1 s, extension at 72 °C for 15 s, and finally incubation at 72 °C for 5 min. The PCR products were separated on 3% NuSieve GTG agarose gels (Lonza) and visualized by ethidium bromide staining. Expected product sizes from recombined V(D)J region were in the range 50–200 bp.
Results
The Sonoda–Tajima Cell Collection
The Sonoda–Tajima Cell Collection contains more than 3,500 PBMNC samples obtained from ethnic populations across the world (fig. 1). The collection is particularly rich in samples from South America. As stated earlier, any direct use of the PBMNC samples would soon lead to their exhaustion. In comparison with the in vitro expansion of the whole genome using PCR, establishing cell lines is a much better method for maintaining the whole genome in a stable manner. With regard to establishing cell lines from PBMNCs, the generation of B cell lines using EBV (B-LCLs) is the most common approach. The genomic DNA of B-LCLs is maintained in a stable fashion. These facts encouraged us to establish B-LCLs using the PBMNCs of the Sonoda–Tajima Cell Collection. In order to include as many ethnic groups as possible from South America and a sufficient number of individuals in each group, we selected the samples indicated in table 1 and figure 2.
When we used either fresh or cryopreserved PBMNCs in good condition to establish the B-LCLs, we were successful in all cases. However, the PBMNC samples in the Sonoda–Tajima Cell Collection have been cryopreserved for over 20 years. In addition, in sampling areas where no electricity was available, the samples were kept at relatively high temperatures prior to cryopreservation. As a consequence of these factors, the viability of some of the thawed PBMNC samples was low, that is, the cells were in poor condition after thawing, and thus it was not easy to establish B-LCLs for these samples. Overall, a success rate of approximately 80% was achieved for the establishment of B-LCLs from the PBMNC samples of the Sonoda–Tajima Cell Collection. Because the success rate was less than 100%, we decided not to use samples for which there were only one or two tubes cryopreserved. Future treatment of such samples remains to be considered. At the moment, we have established 512 B-LCLs from the Sonoda–Tajima Cell Collection. Information on the established B-LCLs is given in table 1 and figure 2.
Karyotype Analysis
In contrast to other cell lines, such as immortalized cancer cell lines, one of the most significant features of B-LCLs is their chromosome stability. B-LCL cells retain a normal chromosome karyotype even after relatively long-term culture (reviewed by Nilsson 1992; Lalle et al. 1995; Okubo et al. 2001); thus, they have been widely used for genetic analysis in many research fields. To confirm that the B-LCLs established from the Sonoda–Tajima Cell Collection maintained a normal karyotype, three B-LCL cell lines, WY084, YAN3191 and YAN3268, were karyotyped following G-banding of chromosome preparations. Chromosome numbers were counted in 50 cells (mode analysis), and then a detailed G-band analysis was performed in 20 of these cells to identify chromosome aberrations. Consistent with previous reports, the vast majority of the cells had a normal karyotype (fig. 3). In the YAN3268 cell line, all the cells analyzed had a normal chromosome number as well as a normal karyotype (fig. 3A). In the WY084 cell line, 2 of the 50 cells had a reduced chromosome number (fig. 3B). This might have been an artifact of preparation as no structural aberrations were observed in the cells. In the YAN3191 cell line, all 20 karyotyped cells had an elongated pericentromeric region on the long arm of chromosome 1 (fig. 3C). The centric heterochromatin of chromosome 1 is known to be variable and shows heteromorphism between individuals (http://www.rerf.or.jp/dept/genetics/giemsa_5_e.html).
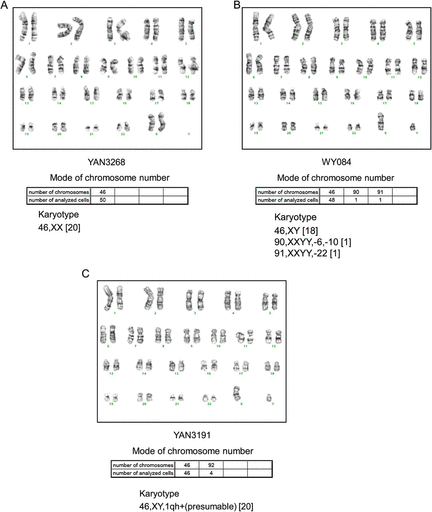
Karyotype analysis. The karyotypes of the three cell lines YAN3268 (A), WY084 (B), and YAN3191 (C) were analyzed. A representative karyotype of the sample of 20 cells karyotyped and 50 mode-analyzed cells. The chromosome notation system follows the guidelines in ISCN (An International System for Human Cytogenetic Nomenclature) 1991.
In general, if an irregular karyotype is detected, it is not possible to conclude that it arose during culture because there is a possibility it was already present in the cells of the individual from whom the initial sample was obtained, as in the YAN3191 cell line. In addition, because karyotype analysis has a limited resolution (3–5 Mbp), we cannot detect smaller rearrangements. These limitations prompted us to perform the array CGH analysis on the B-LCLs and their parental PBMNCs.
Array CGH Analysis
To avoid the influence of genetic background, such as CNV, we decided to compare the B-LCL and parental PBMNC from the same person in our experiments. We analyzed 10 B-LCLs derived from the Sonoda–Tajima Cell Collection and one B-LCL derived from a healthy Japanese volunteer.
The probe set used in the microarray was uninformative regarding the heterochromatic region of chromosome 1. However, in the YAN3191 cell line, we did not detect any variants with respect to the other chromosome 1 probes suggesting that there was no major rearrangement of the chromosome (or of the other chromosomes) and that the cell line essentially retained the innate genomic structure (fig. 4).
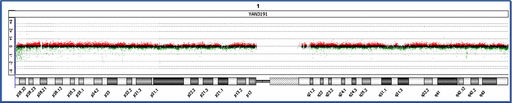
Array CGH of chromosome 1 of the YAN3191 cell line. The acquired hybridization signal for chromosome 1 is shown. Dots indicate probes arrayed on the microarray. Red, green and black signals indicate probes that were called “amplified,” “decreased,” or “no change,” respectively, at the corresponding genomic regions in the YAN3191 cell line compared with PBMNCs.
A few aberrations were observed in all 11 samples: a deletion in chromosome 14 (in the variable, diversity or joining regions of the Ig heavy chain); a deletion in chromosome 2 (in the variable or joining regions of the Ig κ light chain); an amplification in chromosome 14 (in the variable or joining regions of the T-cell receptor [TCR]-α chain); and an amplification in chromosome 7 (in the variable, joining or constant regions of the TCR-γ chain). Typical examples of chromosome 14 are shown in figure 5. In addition, a few other aberrations were detected in some but not all cell lines: a deletion at the immunoglobulin λ locus on chromosome 22; and amplification at the TCR-β on chromosome 7. A precise description of each aberration locus and aberration type described above is given in table 2 and figure 6. In addition, a few other specific aberrations were observed in some but not all B-LCLs (supplementary figs. S1–Supplementary Data, Supplementary Material online).
Genomic Loci Where Aberrations Were Detected
| Chromosome | Cytoband | Start | Stop | Pattern | Gene Name |
| Detected in all samples | |||||
| 2 | p11.2 | 88916534 | 89743016 | Deletion | Immunoglobulin kappa J, V clusters |
| 7 | p14.1 | 38262501 | 38349233 | Amplification | TCR-gamma C, J, V clusters |
| 14 | q11.2 | 21485151 | 22050050 | Amplification | TCR-alpha V, J clusters |
| 14 | q32.33 | 105314054 | 106286079 | Deletion | Immunoglobulin heavy chain V, D, J clusters |
| Detected in over five samples | |||||
| 7 | q34 | 141988254 | 142202474 | Amplification | TCR-beta V, J clusters |
| 16ab | q22.1 | 66945730 | 66967713 | Amplification/deletion | LOC100129324, sphingomyelin phosphodiesterase 3 |
| 22 | q11.22 | 20717615 | 21576029 | Deletion | Immunoglobulin lambda V, J clusters |
| Detected in 2–4 samples | |||||
| 2a | q35 | 218971508 | 218979039 | Amplification | MIRN26B, CTDSP1 |
| 3 | p21.31 | 48577843 | 48600744 | Amplification | UCN2, COL7A1 |
| Detected only in Dann and PBMNC | |||||
| 5 | q35.3 | 179147890 | 179177396 | Amplification | LTC4S, MGAT4B |
Aberration was not detected in B-lymphocyte population.
Aberration was not detected in B-LCL established from adult Japanese.
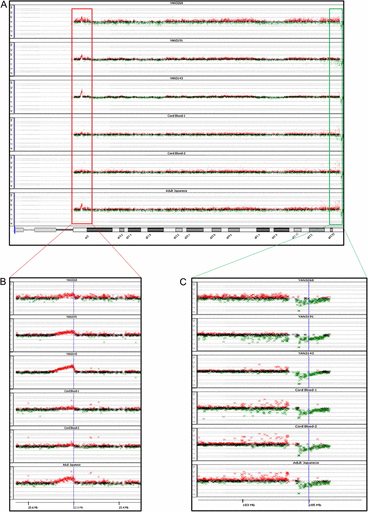
An example of array CGH analysis showing the results for chromosome 14. (A) The acquired hybridization signal for the entire chromosome 14. (B, C) Expanded images around 14q11.2 (B) and 14q32.33 (C). The dots in (A) and the crosses in (B) and (C) indicate probes arrayed on the microarray. The red, green and black signals indicate probes that were called “amplified,” “decreased,” or “no change,” respectively, in B-LCLs compared with PBMNCs in YAN3268, YAN3191, and YAN3143 and in CD19+ cells compared with CD19− cells in Cord Blood-1, Cord Blood-2, and the Adult Japanese sample.
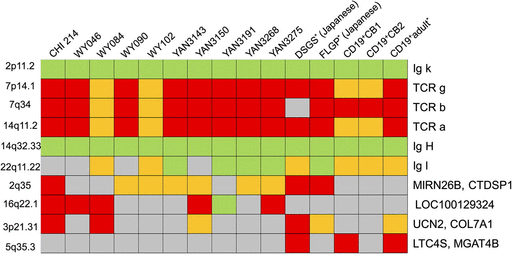
Panel of aberration loci in each cell. Red and green columns indicate the loci called as amplifications and deletions, respectively. Yellow columns indicate that the aberrations were detected under less stringent statistical conditions. Gray columns indicate no statistical differences.
In the B-LCLs, it is possible that the deletions detected in the regions associated with the Ig genes were already present in the B lymphocytes prior to EBV infection. Similarly, because the population of B-lineage cells in PBMNCs is very small, it is possible that the detected aberrations were already present in the parent B lymphocytes but not in the non-B cells. To examine this latter possibility, we attempted to compare the genomes of B-lineage and non–B-lineage cells. However, it was impossible to obtain sufficient B-lineage cells from the Sonoda–Tajima Collection. Thus, we used a blood sample from one healthy Japanese adult volunteer and two umbilical cord blood samples obtained from two independent Japanese neonates. CD19+ and CD19− cell populations were collected using the magnetic beads system described earlier (see Materials and Methods). After selection, the proportion of CD19+ cells was approximately 90% (fig. 7B and C).
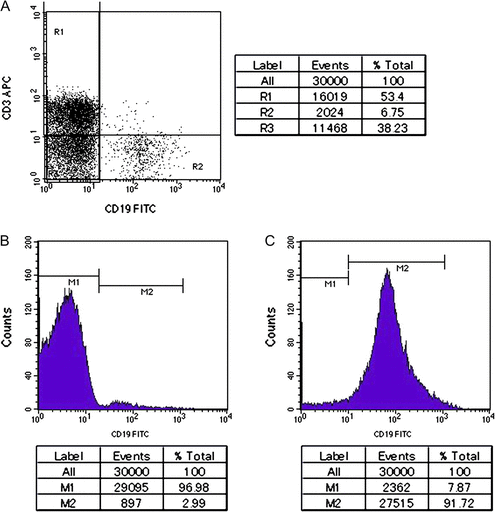
FACS analysis to check the content of CD19+ cells. (A) FACS analysis of PBMNCs stained with anti-CD3 and anti-CD19 antibodies. (B, C) FACS analysis of CD19+-depleted cell population (B) and CD19+ cell population (C) stained with anti-CD19 antibody after MACS beads separation, respectively. Lower column indicates statistical analysis for each region shown in figures.
As expected, most aberrations observed in B-LCL cell lines were also observed in all CD19+ cells: deletions at the Ig heavy chain on chromosome 14 and at the Ig κ and λ light chains on chromosomes 2 and 22; amplifications at the TCR-α locus on chromosome 14, and at the TCR-β and γ-loci on chromosome 7. A precise description of each aberration locus and aberration type is also described in table 2 and figure 6.
Because a flow cytometry analysis indicated that the major cell population in the PBMNCs was CD3+ T-lineage cells (fig. 7A), the results of the statistical analysis of array CGH suggested that “amplification” at the TCR loci were highly likely due to deletions at these loci in T-lineage cells rather than amplification in B-lineage cells.
V(D)J Recombination Analysis
The array CGH analysis clearly demonstrated that B-LCLs possessed rearranged Ig genes. To confirm the rearrangement of the Ig heavy chain, we performed a PCR analysis on genomic DNAs from the B-LCLs. The variable region of the Ig heavy chain is encoded by 3 gene clusters: approximately 40 functional variable (V) genes, 6 functional joining (J) genes, and 25 functional diversity (D) genes. At the later stages of B-lymphocyte differentiation, this region undergoes genomic rearrangements such that only one randomly selected gene from each gene cluster is connected to form the mature V(D)J variable gene, and the remaining “left over” genes are removed from the genome (summarized in OMIM #147070, http://www.ncbi.nlm.nih.gov/omim/). The PCR analysis identified V(D)J recombination in all B-LCLs (fig. 8). Both the results of the array CGH analysis and the PCR analysis were consistent with a previous report that many B-LCLs secrete Ig into the culture medium (Rosen et al. 1977). Because six of the lines showed a single PCR product, these lines were each presumed to consist of a single B-cell clone. However, the other cell lines showed two or more PCR products indicating that they consisted of two or more B-cell clones.
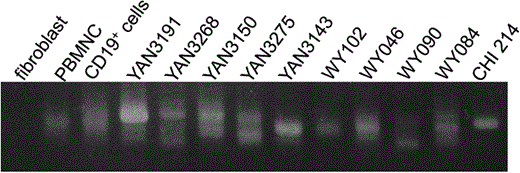
V(D)J recombination. PCR products were separated on a gel and the amplified V(D)J recombination products are shown. Fibroblasts were used as a recombination-negative control. PBMNCs and CD19+ cells (B-lineage cells) were used as multiclonal recombination-positive controls. If the cell line is monoclonal, then a single band is generated by PCR.
Discussion
Long-term cell culture lines, such as immortalized cancer cell lines, generally possess abnormal karyotypes. However, some cell lines tend to retain a normal karyotype. It is well known that B-LCLs and pluripotent stem cell lines, such as embryonic stem cells and induced pluripotent stem cells, show this behavior. Due to this characteristic, B-LCLs have been used in many projects, such as the International Histocompatibility Working Group (http://www.ihwg.org/cellbank/cell_lines/blcl.html), International HapMap Project (http://hapmap.ncbi.nlm.nih.gov/), and Human Genome Diversity Project (http://www.cephb.fr/en/hgdp/table.php). High throughput and comprehensive genome analyses have recently been reported using B-LCL collections, for example, genotyping of blood cell alloantigens (Kroll et al. 2001), detection of CNV (Redon et al. 2006), and population genetics (Li et al. 2008).
It may be inevitable, however, that long-term cell cultures will accumulate chromosomal aberrations and/or genetic mutations. Additionally, it should be noted that there is still some controversy over whether B-LCLs are truly immortalized cells. Sugimoto et al. (2004) reported that B-LCLs could no longer proliferate following long-term culture, that is, they showed the so-called “crisis” observed in human primary cell cultures. By chance, some B-LCLs can overcome this crisis phase and continue to grow indefinitely in culture, that is, show immortalization; however, such cells also showed malignant transformation with abnormal karyotypes (Sugimoto et al. 2004). These findings have prompted a vigorous debate on whether the genomes of B-LCLs are really stable.
To address this question, genome-wide evaluations of the genomic stability of B-LCLs have recently been initiated. Whole genome SNP genotyping indicated that the discrepancies between B-LCLs and their parental PBMNCs were not statistically significant (Simon-Sanchez et al. 2006; Herbeck et al. 2009). In contrast, however, another study has reported different copy numbers of certain genes in B-LCLs and their parental PBMNCs (The Wellcome Trust Case Control Consortium 2010). In relation to this issue, Bruder et al. (2008) analyzed CNVs in monozygotic twins and found somatic mosaicism for CNVs, that is, CNVs were detected not only between individuals but also within an individual, with a rate of 70–80% of blood cells affected in the most severe cases and of 10–15% in the less affected cases. CNVs form continuously in mitosis and meiosis by a diversity of mechanisms, and it is thought that CNVs are one of the major driving forces in the rapid evolution of human beings (reviewed by Hastings et al. 2009).
In our array CGH analysis, several aberrations were detected in B-LCLs when they were compared with PBMNCs. However, most of these aberrations were also detected in B-lineage cells when compared with non–B-lineage cells. Therefore, it is highly likely that most of the aberrations detected in the B-LCLs were present in their parental B cells rather than having occurred de novo during establishment of the cell cultures. However, with respect to some of the aberrations detected in some B-LCLs derived from the Sonoda–Tajima Collection (supplementary figs. S1–Supplementary Data, Supplementary Material online), it was impossible to determine whether they occurred de novo during culture or were present in the parental B cells because insufficient numbers of parental B cells were available for analysis. Of note, a deletion in chromosome 22 (in the variable and joining regions of the Ig λ light chain) was detected in several B-LCLs but not in all lines, suggesting that EBV had infected the B cells at different stages of differentiation, that is, before and after the rearrangement of the Ig λ light chain.
Interestingly, amplification at 5q35.3 was only detected in one of the two Japanese B-LCLs derived from the same individual (fig. 6). Of course, we cannot formally deny the possibility of de novo amplification during cell culture. However, this observation might indicate somatic mosaicism as described above (Bruder et al. 2008). Even if this is the case, it is not clear at present whether such somatic rearrangements are coupled with RAG transposition (Reddy et al. 2010) or some other mechanism (reviewed by Hastings et al. 2009). Moreover, with respect to aberrations of genes other than of the Ig chains in B-LCLs and primary B cells, the biological implications remain to be determined. When B-LCLs are utilized in genetic research, such aberrations need to be taken into account.
According to our array CGH results, the variation in copy numbers of some genes in B-LCLs compared with their parental PBMNCs might have been present in the parental B cells and might have been detected if only B-lineage cells had been collected and analyzed in a similar fashion to the present study. The possible consequences of any CNV between B cells and non–B cells have yet to be investigated. At present, we cannot formally exclude the possibility that such CNV occurred during the establishment and culture of the B-LCLs.
Overall, our analyses support the contention that B-LCLs provide a valuable source of genomic DNAs for a wide range of genetic studies. However, it is recommended that short-term cell cultures are utilized. Certainly, so-called immortalized B-LCLs with abnormal karyotypes (Okubo et al. 2001; Sugimoto et al. 2004) should not be used for genetic research. In addition, the occurrence of aberrations in B-LCLs when compared with whole mononuclear blood cells should be taken into account when the affected genomic loci are targeted for research.
The Sonoda–Tajima Cell Collection is a very valuable cell collection obtained from various ethnic populations across the world, particularly from South America. Because some of these populations in South America no longer exist, it will be impossible to prepare a similar collection in the future. Here, we describe the establishment of B-LCLs from the Sonoda–Tajima Cell Collection; currently, B-LCLs from more than 500 of the total of about 3,500 samples have been developed. All these B-LCLs are available from the cell bank held at the Cell Engineering Division of RIKEN BioResource Center in Japan (http://www.brc.riken.jp/lab/cell/english/). At the moment, approximately 150 B-LCLs are immediately available, whereas the others are now under preparation for rapid distribution. In addition, we are willing to establish more B-LCLs on demand from scientists around the world. We believe that our development of this resource will contribute to various fields of science such as human genetics, human evolution, the history of human migrations across continents, the pharmacokinetics of ethnic minority groups, among others.
We thank Dr I. Ishiwata at Ishiwata Hospital for providing the umbilical cord blood samples, Dr Y. Kodama at Radiation Effect Research Foundation for suggestions and comments on karyotype analysis, Dr T. Yamamoto at Nagoya University for comments on CNVs, Dr K. Moriwaki at RIKEN BioResource Center for general discussion and encouragement, H. Sone and J. Niikura for technical assistance, and other members of the Cell Engineering Division of RIKEN BioResource Center for help with various technical matters. This work was supported by the Ministry of Education, Culture, Sports, Science, and Technology in Japan.
References
Author notes
Associate editor: Takashi Gojobori
