


Abstract
Stroke is the leading cause of severe disability and the third leading cause of death, accounting for one of every 15 deaths in the USA. We investigated the association of polymorphisms in the soluble epoxide hydrolase gene (EPHX2) with incident ischemic stroke in African-Americans and Whites. Twelve single nucleotide polymorphisms (SNPs) spanning EPHX2 were genotyped in a case-cohort sample of 1336 participants from the Atherosclerosis Risk in Communities (ARIC) study. In each racial group, Cox proportional hazard models were constructed to assess the relationship between incident ischemic stroke and EPHX2 polymorphisms. A score test method was used to investigate the association of common haplotypes of the gene with risk of ischemic stroke. In African-Americans, two common EPHX2 haplotypes with significant and opposing relationships to ischemic stroke risk were identified. In Whites, two common haplotypes showed suggestive indication of an association with ischemic stroke risk but, as in African-Americans, these relationships were in opposite direction. These findings suggest that multiple variants exist within or near the EPHX2 gene, with greatly contrasting relationships to ischemic stroke incidence; some associated with a higher incidence and others with a lower incidence.
INTRODUCTION
Stroke is the leading cause of severe disability and the third leading cause of death, accounting for one of every 15 deaths in the USA. Stroke mortality and morbidity are greater among certain subgroups such as the elderly and African-Americans. Ischemic stroke accounts for ∼80% of all strokes (1). Although the genetic basis of some Mendelian forms of stroke has been elucidated (2–5), the mutations implicated in these rare disorders likely contribute little to the overall prevalence of stroke in the population at large. Thus, identification and characterization of genes implicated in the more common forms of stroke are critical to improve the understanding of the pathophysiological processes leading to its development.
Epoxyeicosatrienoic acids (EETs) are lipid metabolites of arachidonic acid, which are synthesized in vascular endothelial cells by the cytochrome P450 system (6,7). They function as potent vasodilators and participate in the regulation of vascular tone (8). They have anti-inflammatory properties (9), modulate platelet function during hemostasis (10) and promote cell proliferation (11). In the brain, both vascular endothelial cells and astrocytes provide a carefully regulated supply of EETs to the cerebral microvasculature (12,13). EETs have been shown to regulate cerebral blood flow (12) and, through their mitogenic properties, may contribute to angiogenesis in the brain (14). Hence, they may play a role in predisposition to and/or recovery from cerebrovascular injury.
Hydrolysis of the EETs to their corresponding diols by epoxide hydrolases regulates EETs levels and represents a major mechanism by which the biological effects of EETs are attenuated (7). Inactivation of EETs by EPHX2 has been proposed to contribute to ischemic brain injury in rodent models, as both EPHX2 gene deletion and pharmacological inhibition of the enzyme reduced infarct size after focal cerebral ischemia (15). We have reported that sequence variation and altered levels of expression of the EPHX2 gene may contribute to kidney and brain injuries in a rat model of genetic stroke (16). Multiple polymorphisms in the human EPHX2 gene have been identified, which result in amino acid substitutions in the protein (17,18). Significant variations in enzyme activity and stability have been shown to be associated with these variants in in vitro assays (17,19). We have recently described an association of a functional polymorphism in the human EPHX2 gene with coronary artery calcification, a marker of atherosclerosis and independent predictor of stroke risk (20). In the light of the mounting evidence of the role of endogenous EETs in processes intimately connected to cerebrovascular function, we have examined the association of polymorphisms in the EPHX2 gene with incidence of ischemic stroke in the large prospective Atherosclerosis Risk in Communities (ARIC) study.
RESULTS
Mean values, standard errors and proportions of established stroke risk factors are presented in Table 1 for incident ischemic stroke cases and the cohort random sample (CRS). Mean values for all variables except triglycerides, high density lipoprotein (HDL) cholesterol and low density lipoprotein (LDL) cholesterol were significantly different between the two groups. Moreover, stroke cases had a significantly greater frequency of African-American men and participants with hypertension and diabetes.
Figure 1 shows the gene location and race-specific allele frequencies (calculated in the CRS) for each of the polymorphisms genotyped in this study. Genotype frequency distributions were in accordance with Hardy–Weinberg equilibrium expectations in each race for all 12 polymorphisms (data not shown). Allele and genotype frequency distributions for most of the polymorphisms significantly differed between the two racial groups, with the exception of SNP6 (R287Q) (Fig. 1). SNP2 (R103C), SNP3 and SNP4 were moderately frequent in African-Americans, but rare in Whites. SNP10 (E470G) was not polymorphic in Whites. Allele frequencies of each of the 12 polymorphisms were similar to those observed in other African-American and White populations (20) (unpublished data).
A summary of the estimates of pairwise linkage disequilibrium (LD), as measured by D′ and r2, between each of the polymorphisms is presented by race in Figure 2. SNPs 2, 3, 4 and 10 were not tested in Whites because of their low frequencies. LD levels were generally lower in African-Americans when compared with Whites, consistent with previous reports (21,22).
Table 2 presents the results of analyses of association between individual non-synonymous SNPs of the EPHX2 gene and risk for incident ischemic stroke. There was no statistically significant association between each of the five non-synonymous polymorphisms in the EPHX2 gene and incident ischemic stroke in this sample of African-American and White middle-aged individuals. A rare non-synonymous variant, E470G, showed a trend toward a positive association of the A-allele (470G) with a higher risk for ischemic stroke (HRR=2.9; P=0.13) in African-Americans. This trend was observed in all three analytical models. The E470G variant was not observed in Whites. Given the rare frequency of this variant, very large sample sizes are required to obtain statistically meaningful numbers of individuals carrying the 470G allele. The numbers of individuals carrying the 470G allele in this sample was 11, including five stroke cases.
We next investigated whether the combined effects of common SNPs in the EPHX2 gene significantly influence incident clinical ischemic stroke risk in African-Americans and Whites. To this end, haplotypes were constructed from a selected subset of SNPs. Consistent with approaches to reduce the risk of false positive findings related to low frequency haplotypes (23), only haplotypes with a frequency greater or equal to 3% were considered in the association analyses. Nine common haplotypes, accounting for 93% of all African-American chromosomes, and five common haplotypes, accounting for nearly 98% of all White chromosomes, met this criterion. Table 3 shows the haplotype frequencies and results of the analyses of association between common haplotypes of the EPHX2 gene and ischemic stroke case status by race. In African-Americans, two common haplotypes showed significant associations with ischemic stroke risk: haplotype ATACGGT (frequency, 3.2%) was associated with a statistically, significantly lower risk of ischemic stroke (P=0.03), whereas haplotype ACACAGT (frequency, 11.5%) was associated with a statistically, significantly higher risk of ischemic stroke (P=0.02). Adjustment for covariates did not significantly affect these results. Cox proportional hazard analyses modeling the ratios of hazard rates of incident clinical ischemic stroke between individuals carrying zero, one or two copies of these haplotypes, and appropriately weighting for the sampling design, corroborated these findings. The ratio of hazards of incident clinical ischemic stroke per copy of haplotype ATACGGT was 0.34 (95% CI: 0.11, 1.00), whereas that of haplotype ACACAGT was 1.74 (95% CI: 1.11, 2.72) (Table 4). Haplotype ATACGGT was not uniquely tagged. Haplotype ACACAGT was uniquely tagged by SNP9, which encodes a synonymous substitution at alanine 425. We then directly evaluated the association of SNP9 with stroke incidence in African-Americans. Consistent with the haplotype analyses results, individuals carrying at least one copy of the A-allele had a 1.70-fold increased hazard rate of ischemic stroke (95% CI=1.06, 2.75; P=0.03). This association was statistically significant in unadjusted and minimally adjusted models, but was no longer statistically significant after adjusting for known stroke risk factors (HRR=1.60; 95% CI=0.90, 2.90; P=0.10). In particular, adjustment for hypertension status significantly diminished the association of SNP9 with ischemic stroke (HRR=1.40; 95% CI=0.84, 2.85; P=0.19), although no association of this SNP with hypertension status, systolic blood pressure or diastolic blood pressure was detected in either the CRS or the stroke cases (data not shown).
In Whites, there was no statistically significant association between common patterns of variation in the EPHX2 gene and incident ischemic stroke (Table 3). However, haplotype AAGTA, the most frequent haplotype in this race group, showed a trend toward an association with a higher risk for ischemic stroke (P=0.05–0.08). This haplotype is uniquely tagged by SNP5. In single variant analyses, this variant also showed a trend toward a positive association with incident ischemic stroke in Whites [HRR AA versus GG=1.6 (95% CI: 0.98, 2.6; P=0.06)]. Similar to the dual associations of EPHX2 with ischemic stroke risk observed in African-Americans, a common haplotype (AGGTA) showed a trend toward an association with a lower risk for ischemic stroke in Whites (P=0.06). This haplotype was not uniquely tagged.
DISCUSSION
There is increasing evidence that the genetic architecture underlying susceptibility to common complex diseases reflects the influence of both common and rare DNA variants (24,25), but the relative contribution of common variant versus rare variant remains to be determined. Multiple, generally rare, polymorphisms in the human EPHX2 gene have been identified, which result in amino acid substitutions in the EPHX2 protein (17,18). Significant variation in enzyme activity and stability has been shown to be associated with these variants in in vitro experimental assays (17,19). In this study, we have genotyped five non-synonymous polymorphisms of the EPHX2 gene, with established or potential relevance to enzyme structure and function, as well as seven additional common variants spanning the EPHX2 gene sequence. We have used a combination of single polymorphism- and haplotype-based methodologies to investigate the association of variation in the EPHX2 gene with incident ischemic stroke in African-Americans and Whites from the ARIC cohort.
An association between the E470G variant and the incident ischemic stroke in African-Americans is suggested. Adjusting for effects of known stroke risk factors, individuals carrying the 470G allele had a 2–3-fold hazard rates of incident ischemic stroke when compared with those who did not, although statistical significance for this effect was not achieved. Because this variant is rare in African-Americans and not present in our sample of Whites, our power to detect a statistically significant effect was limited and very large sample sizes are required to obtain statistically meaningful numbers of individuals carrying the 470G allele. Future studies in the entire ARIC cohort will clarify the role of this variant in ischemic stroke. Interestingly, in vitro enzymatic assays showed that the 470G EPHX2 isoform had a significantly greater hydrolase activity but similar phosphatase activity when compared with the wild-type isoform (17). Such an altered function, if present in vivo, may have important consequences on the regulation of EETs levels in the brain and vasculature and may contribute to cerebrovascular injury (12). None of the other non-synonymous polymorphisms, with potential relevance to enzyme structure or function, was independently associated with incident ischemic stroke.
The relationship between EPHX2 sequence variation and ischemic stroke may be exerted through higher order combinations of polymorphisms, rather than through their individual effects. Indeed, it has been suggested that haplotypes, rather than individual variants, define functional units of genes (26,27). Thus, we next investigated the association of common EPHX2 haplotypes with stroke risk. In African-Americans, two common haplotypes with opposing effects on ischemic stroke risk were identified. Haplotype ATACGGT was associated with a significantly decreased hazard rate of incident ischemic stroke, either alone or after adjusting for other known stroke risk factors. The variant(s) responsible for this effect is (are) unknown. Additional markers that uniquely tag this haplotype may be helpful in identifying the underlying causative variant(s). Haplotype ACACAGT was associated with a significantly increased hazard rate of incident ischemic stroke, and this effect was largely independent from the effect of other stroke risk factors. This haplotype is uniquely tagged by SNP9 (Ala425Ala), which was significantly associated with incidence of ischemic stroke in single polymorphism analyses, suggesting that this variant itself, or a variant(s) in LD with it, contributes to ischemic stroke risk in African-Americans. On average, synonymous SNPs are more frequent than non-synonymous SNPs, and it is generally thought that most synonymous mutations may be functionally neutral. However, studies in Escherichia coli, yeast and Drosophila support evidence for translation selection for major codons (28,29), and it has been shown that there is a strong correlation between bias in synonymous codon usage and gene expression levels (30). Moreover, given its close proximity to the junction of exon and intron 14, it is also possible that SNP9 may affect RNA splicing. Predictions from computational analysis (31,32) revealed that the G to A substitution at SNP9 may lead to the activation of an exonic splicing enhancer (ESE), with the A-allele having a 6.8-fold greater predicted SF2/ASF binding affinity than the G-allele (Supplementary Material, Fig. S1). To the best of our knowledge, alternate splice variants of this gene have not been characterized in humans. Further studies are needed to determine whether the Ala425Ala polymorphism (SNP9) may produce such variants.
The strong LD between E470G and SNP9 raises the possibility that association of SNP9 with ischemic stroke may represent, at least partly, the association of E470G with the disease. Several lines of evidence suggest that this is not so. First, the haplotype associated with greater stroke incidence and uniquely tagged by SNP9 carries the E470 allele not the G470 allele. Secondly, the association of one SNP with incident ischemic stroke is not affected when controlling for the effects of the other (data not shown), suggesting independent associations of the two SNPs with the disease.
Although we could not find conclusive evidence for an association between variation in the EPHX2 gene and ischemic stroke in Whites, there was a suggestive indication for an effect of a common EPHX2 haplotype, AAGTA, on higher ischemic stroke risk. This haplotype was associated with a modestly increased ratio of hazard rates of incident ischemic stroke, and was uniquely tagged by an SNP in intron 5, which itself showed some suggestion of an association with increased ischemic stroke incidence. It is not clear whether this SNP itself, or one or more SNPs in LD with it, is responsible for the observed effects. As in African-Americans, in addition to contributing to increased ischemic stroke risk, the EPHX2 gene may also encompass sequence variation that contributes to lower ischemic stroke risk in Whites, as suggested by the trend toward an association of the AGGTA haplotype with lower ischemic stroke risk. We have recently shown that this haplotype is also significantly associated with an increased risk for calcified plaque in the CARDIA cohort (Fornage et al., in preparation). Plaques vulnerable to rupture and, thus, prone to cause stroke, have been rarely found to contain calcium, and there is accumulating evidence that plaque calcification may confer plaque stability (33). Moreover, patients with calcified plaque are less likely to have symptomatic disease than those with non-calcified plaque (33–36). Our findings of a common EPHX2 haplotype associated with both increased susceptibility to calcified plaque and decreased risk for stroke are consistent with such data and justify further investigation about the role of this gene in the clinical manifestations of atherosclerosis.
Taken together, these data provide evidence that both common and rare variants are likely to play a role in the relationship between the EPHX2 gene and the ischemic stroke. Moreover, they provide evidence that multiple variants exist within or near the EPHX2 gene, with greatly contrasting effects on ischemic stroke incidence; some associated with a higher incidence and others with a lower incidence. Several hypotheses may be put forth to explain these results. First, multiple functional variants of the enzyme have been identified with contrasting enzymatic activity and/or stability (17,19). Hence, different haplotypes carrying different such variants may influence disease risk in a contrasting manner. Secondly, it has been recently shown that the EPHX2 is a bifunctional enzyme composed of an epoxide hydrolase domain at its C-terminus and a phosphatase domain at its N-terminus (37,38). Thus, the presence of two functionally distinct domains in the EPHX2 gene provides the opportunity for functional variants of these domains to influence the phenotype in a distinct fashion. Thirdly, it is also conceivable that the observed associations may not stem only from the effects of polymorphisms in the EPHX2 gene, but also from those of polymorphisms in a nearby gene, whose relationship to ischemic stroke may differ from and oppose that of EPHX2. However, recent data on whole-genome patterns of common DNA variation (39,40) do not support the possibility that LD extends to the characterized genes near the EPHX2.
This is the first study to describe the common patterns of EPHX2 gene variation associated with incident ischemic stroke in a well-characterized epidemiological setting, such as the ARIC cohort. However, the large number of statistical tests performed warrants caution interpretation of the findings and underscores the need for further studies to independently confirm the data reported here. Dual associations of EPHX2 gene variation with risk of coronary heart disease have been observed in a separate study (D.C. Zeldin, personal communication), lending further credibility to the hypotheses presented here. Additional studies are also needed to further investigate the functional relationships of the EPHX2 sequence variation with ischemic cerebrovascular disease. Identification of the variants influencing susceptibility to ischemic stroke is a necessary first step toward understanding the biological basis of the associations detected in this study.
MATERIALS AND METHODS
Study population
Participants were selected from the ARIC study, an ongoing prospective study of atherosclerosis and its sequelae. The cohort consists of a probability sample of 15 792 men and women aged 45–64 at the time of initial examination. Subjects were recruited from four US communities (Suburban Minneapolis, Minnesota; Washington County, Maryland; Forsyth County, North Carolina and Jackson, Mississippi). In the first three communities, the sample reflects the demographic composition of the community. In Jackson community, only black residents were enrolled. The baseline examination, conducted from 1987 to 1989, included a home interview to ascertain demographic, socioeconomic and cardiovascular risk factors and medical history; a clinical examination and a blood draw for laboratory determination. The cohort was followed by annual phone interviews, a clinic examination every 3 years and hospital and death certificate surveillance. A detailed description of the ARIC study design and methods has been previously published (41). Subjects with prevalent coronary heart disease, stroke or transient ischemic attacks (TIAs) at the baseline visit were excluded from these analyses (N=1434).
Incidence of clinical ischemic stroke was determined by review of hospital records and survey of discharge lists from local hospitals and death certificates from state vital statistics offices for potential cerebrovascular events (41,42). Validation of stroke hospitalizations in ARIC is described elsewhere (42). Briefly, a hospitalization was eligible for validation if there was (1) a discharge diagnosis indicative of stroke; (2) a discharge summary indicative of a possible stroke such as TIA, cerebral vascular disease, cerebral hemorrhage and cerebral infarction (list not exhaustive) and/or (3) a CT or MRI with cerebral vascular findings or admission to the neurological intensive care unit. Records for eligible hospitalizations were abstracted at a central center by a trained nurse using a standardized computerized algorithm. Medical records were also reviewed by a trained physician. Disagreement between computer diagnosis and physician review was adjudicated by a second physician. 315 validated incident clinical ischemic strokes were identified through 2001. A stratified random sample of the ARIC cohort (CRS, N=1021) was used as the comparison group for the clinical cases. Selection of this CRS was stratified on the basis of ultrasound examination of carotid arteries, age and sex.
Data collection
Fasting levels of total triglycerides, total and HDL cholesterol were measured by enzymatic methods. LDL cholesterol was calculated. Seated blood pressure was measured three times with a random-zero sphygmomanometer and the last two measurements were averaged. Hypertension status was defined as a systolic blood pressure level ≥140 mmHg, a diastolic blood pressure level ≥90 mmHg and/or treatment with anti-hypertensive medication. Diabetes was defined as a fasting blood glucose level ≥126 mg/dl, a non-fasting blood glucose level ≥200 mg/dl and/or a history of or treatment for diabetes. Ratio of waist (umbilical level) and hip (maximum buttocks) circumferences was calculated as a measure of adiposity. Cigarette smoking status was analyzed by comparing current smokers with individuals who had formerly or never smoked.
EPHX2 gene polymorphisms and genotyping
Twelve polymorphisms spanning the EPHX2 gene sequence were selected from previously published work, public databases and from our own resequencing efforts. Polymorphisms were selected for genotyping on the basis of their known or likely functional significance (non-synonymous SNPs), frequency (>5%) and/or their ability to tag haplotype blocks based on r2-values (43). Genotyping was performed using the TaqMan assay (Applied Biosystems) or the MassARRAY assay (Sequenom) as previously described (44). Genotype determination was done blinded to case-cohort status. For each polymorphism, race-specific genotype frequencies were estimated by gene counting in the CRS. Agreement of the genotype frequencies with Hardy–Weinberg equilibrium expectations was tested using a χ2 goodness-of-fit test.
Statistical methods
Weighted analyses were used to draw inferences to the entire ARIC cohort from whom the CRS was drawn. The weight for a given stratum of the CRS equaled the total number of eligible participants in the study population stratum divided by the total number of participants sampled from that stratum. The proportions, mean values and standard errors of established stroke risk factors were reported as weighted results for incident clinical ischemic stroke cases and the CRS.
Individual SNPs analyses.
For each polymorphism, Cox proportional hazards models were used to estimate the ratios of hazard rates of incident clinical ischemic stroke between individuals in the different genotype categories. The method of Barlow was used to adjust for the sampling strategy in the Cox proportional hazards models (45). Three general models were estimated: model 1 was an unadjusted model containing only the genotype category; model 2 included age, sex and field center as covariates and model 3 included covariates in model 2 and hypertension status, diabetes status, smoking status and waist–hip ratio. For low frequency polymorphisms, heterozygous and homozygous for the minor allele were combined into a single category. All analyses were performed separately by race.
Haplotype analyses
Within each race, only polymorphisms with a minor allele frequency of ≥10% were further considered for the haplotype analyses. SNPs with pairwise r2>0.8 were considered redundant and only one of them was included in the haplotype analyses. Hence, SNPs included in the haplotype analyses constituted a minimal set of highly informative markers (tagSNPs) while minimizing redundant data. This set comprised SNPs 1, 2, 4, 7, 9, 11 and 12 in African-Americans and SNPs 1, 5, 6, 7 and 11 in Whites.
Significance of haplotype effects on each of the traits was evaluated using a regression method for unphased haplotypes based on score statistics (46,47). This method uses the generalized linear model framework, but accounts for haplotype ambiguity by modeling the probabilities of the possible haplotype pairs per subject (46). Score statistics were constructed to test the null hypothesis of no haplotype effects on the probability of being a stroke case. Statistical significance was evaluated by a permutation test that takes into account the number of haplotypes and, therefore, adjusts for multiple comparisons. Adjustment for covariates followed the same scheme as described earlier. Only individuals whose genotype was non-missing in 80% of the selected tagSNPs were included in haplotype-based analyses (N=439 and 813, for African-Americans and Whites, respectively). All analyses were performed separately by race.
Although the score method has the advantage that permutation P-values for significance tests can be easily computed, it does not estimate the regression parameters, hence the magnitude of effects of haplotypes on traits. Each individual was assigned the most probable pair of haplotypes, as estimated by EM algorithm implemented in the score method described earlier. For those haplotypes showing a significant association with ischemic stroke by the score test, haplotype effects size was estimated by the Barlow method described earlier, modeling the ratios of hazard rates of incident clinical ischemic stroke between individuals carrying zero, one or two copies of the given haplotype.
SUPPLEMENTARY MATERIAL
Supplementary Material is available at HMG Online.
ACKNOWLEDGEMENTS
The authors thank the staff and participants of the ARIC study for their important contributions. This research was supported by grants NS41466 and HL69126 to M.F., by grant ES012856 to C.R.L. and by funds from the NIEHS Division of Intramural Research to D.C.Z. The ARIC study is carried out as a collaborative study supported by National Heart, Lung and Blood Institute contracts N01-HC-55015, N01-HC-55016, N01-HC-55018, N01-HC-55019, N01-HC-55020, N01-HC-55021 and N01-HC-55022. ‘Funding to pay the Open Access publication charges for this article was provided by NS41466 and HL69126’.
Conflict of Interest statement. D.C.Z. is a co-inventor on U.S. Patent No. 6,531,506 entitled ‘Inhibition of Soluble Epoxide Hydrolases for the Treatment of Hypertension’.
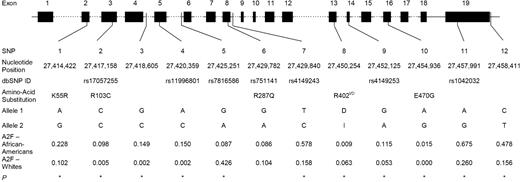
Figure 1. Gene location and minor allele frequency (in CRS only) of 12 genotyped polymorphisms in the EPHX2 gene by race. Exons are indicated by boxes and are numbered. Polymorphism position is given relative to the NCBI35 chromosome 8 sequence. Non-synonymous substitutions are shown. I/D corresponds to the presence or absence of three nucleotides (TCG) at positions 27, 450 and 254 resulting in the insertion of an arginine residue at position 402 of the enzyme. A2F: frequency of allele 2. *P<0.05 for difference in genotype distributions between the two races.
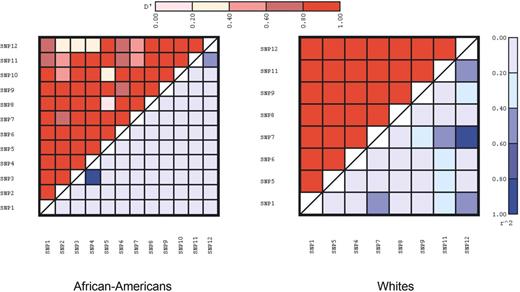
Figure 2. Pairwise estimates of LD by race (left panel, African-Americans and right panel, Whites). D′ is shown in the upper diagonal and r2 in the lower diagonal. SNP2, SNP3, SNP4, and SNP10 (E470G) were not included in Whites.
Baseline characteristics of the study sample
| Incident ischemic stroke cases (N=315) | Cohort random sample (N=1021) | P-value | |
|---|---|---|---|
| Age at visit 1 (years) | 57.3 (0.6) | 53.8 (0.10) | <0.0001 |
| Waist–Hip ratio | 0.95 (0.007) | 0.92 (0.002) | 0.0001 |
| HDL cholesterol (mmol/l) | 1.33 (0.05) | 1.36 (0.01) | 0.53 |
| LDL cholesterol (mmol/l) | 3.58 (0.14) | 3.48 (0.03) | 0.46 |
| Triglycerides (mmol/l) | 1.55 (0.10) | 1.46 (0.03) | 0.38* |
| African-Americans (%) | 47.0 | 26.1 | 0.0001 |
| Men (%) | 53.3 | 43.4 | 0.001 |
| Current smoker (%) | 34.1 | 24.8 | 0.001 |
| Hypertensive (%) | 63.8 | 29.8 | <0.0001 |
| Diabetic (%) | 32.3 | 12.0 | 0.0004 |
Data are presented as mean values (standard error) or proportions.
*P-value for difference in geometric means.
Analysis of association between non-synonymous polymorphisms of the EPHX2 gene and incident ischemic stroke
| African-Americans | P-value | Whites | P-value | |||||
|---|---|---|---|---|---|---|---|---|
| Hazard ratios | Hazard ratios | |||||||
| K55R | GG+AG | AA | GG+AG | AA | ||||
| Model 1a | 0.9 (0.6; 1.5) | Ref. | 0.81 | 0.9 (0.6; 1.4) | Ref. | 0.61 | ||
| Model 2b | 0.9 (0.6; 1.4) | Ref. | 0.87 | 0.8 (0.5; 1.3) | Ref. | 0.42 | ||
| Model 3c | 0.9 (0.5; 1.6) | Ref. | 0.61 | 0.8 (0.5; 1.4) | Ref. | 0.45 | ||
| R103C | TT+TC | CC | TT+TC | CC | ||||
| Model 1 | 0.8 (0.5; 1.3) | Ref. | 0.38 | 1.5 (0.4; 5.7) | Ref. | 0.51 | ||
| Model 2 | 0.8 (0.5; 1.4) | Ref. | 0.45 | 1.7 (0.5; 6.3) | Ref. | 0.43 | ||
| Model 3 | 0.8 (0.5; 1.5) | Ref. | 0.49 | 2.0 (0.5; 8.5) | Ref. | 0.33 | ||
| R287Q | AA+AG | GG | AA+AG | GG | ||||
| Model 1 | 1.1 (0.6; 1.8) | Ref. | 0.85 | 0.8 (0.5; 1.3) | Ref. | 0.49 | ||
| Model 2 | 1.1 (0.6; 1.8) | Ref. | 0.84 | 1.0 (0.6; 1.6) | Ref. | 0.95 | ||
| Model 3 | 1.1 (0.5; 2.0) | Ref. | 0.75 | 1.1 (0.6; 1.8) | Ref. | 0.75 | ||
| R402I/D | R402I/D | R402D/D | R402I/I+R402I/D | R402D/D | ||||
| Model 1 | 1.2 (0.2; 6.9) | Ref. | 0.82 | 0.8 (0.4; 1.3) | Ref. | 0.29 | ||
| Model 2 | 1.0 (0.2; 6.0) | Ref. | 0.98 | 0.8 (0.5; 1.5) | Ref. | 0.54 | ||
| Model 3 | 0.7 (0.1; 5.3) | Ref. | 0.68 | 0.9 (0.5; 1.7) | Ref. | 0.75 | ||
| E470G | AG (470E/G) | GG (470E) | ||||||
| Model 1 | 2.2 (0.6; 8.2) | Ref. | 0.12 | |||||
| Model 2 | 2.7 (0.8; 9.8) | Ref. | 0.12 | |||||
| Model 3 | 2.9 (0.7; 11.9) | Ref. | 0.13 | |||||
aUnadjusted.
bAdjusted for age, sex and center.
cAdjusted for age, sex, center, hypertension status, diabetes status, smoking and waist–hip ratio.
Frequency distribution and results of analyses of the association between common haplotypes of the EPHX2 gene and ischemic stroke case status by race
| Haplotypea | E(Frequency) | Model 1 | Model 2 | Model 3 | |||
|---|---|---|---|---|---|---|---|
| Scoreb | P-value | Score | P-value | Score | P-value | ||
| African-Americans | |||||||
| A T A C G G T | 0.032 | −2.19 | 0.03 | −2.08 | 0.04 | −2.49 | 0.02 |
| A C C C G G C | 0.091 | −0.53 | 0.6 | −0.52 | 0.6 | 0.98 | 0.34 |
| A C A T G G T | 0.092 | −0.52 | 0.6 | −0.52 | 0.6 | −0.06 | 0.94 |
| A C C C G G T | 0.043 | −0.49 | 0.61 | −0.45 | 0.65 | 0.03 | 0.98 |
| G C A C G G T | 0.193 | −0.33 | 0.71 | −0.4 | 0.7 | −1.11 | 0.26 |
| A C A T G G C | 0.094 | 0.27 | 0.77 | 0.2 | 0.86 | 0.18 | 0.86 |
| A C A T G A C | 0.207 | 0.19 | 0.85 | 0.24 | 0.82 | −0.55 | 0.6 |
| A T A C G A C | 0.06 | 0.41 | 0.68 | 0.35 | 0.71 | 0.77 | 0.47 |
| A C A C A G T | 0.115 | 2.33 | 0.02 | 2.32 | 0.02 | 2.21 | 0.04 |
| Whites | |||||||
| A G G T A | 0.314 | −1.45 | 0.14 | −1.85 | 0.08 | −1.85 | 0.06 |
| G G G C G | 0.092 | −0.68 | 0.50 | −0.82 | 0.40 | −0.95 | 0.34 |
| A G A T G | 0.092 | −0.68 | 0.48 | −0.22 | 0.82 | −0.01 | 0.99 |
| A G G C G | 0.056 | 0.96 | 0.33 | 1.28 | 0.23 | 1.41 | 0.16 |
| A A G T A | 0.422 | 1.91 | 0.06 | 1.99 | 0.05 | 1.73 | 0.08 |
SNPs that uniquely tag common haplotypes are shown in bold.
aHaplotypes are designated by the corresponding nucleotides at SNPs 1, 2, 4, 7, 9, 11 and 12 in African-Americans and SNPs 1, 5, 6, 7 and 11 in Whites, in that order.
bA negative score represents a lower than average risk for stroke and a positive score represents a higher than average risk. Models 1, 2, and 3 have been defined in Table 2.
Association between selected common haplotypes and incident ischemic stroke in African-Americans
| Haplotypea | Hazard ratio per copy of haplotypeb (95% confidence interval) | P-value |
|---|---|---|
| A T A C G G T | ||
| Model 1 | 0.34 (0.11; 1.00) | 0.05 |
| Model 2 | 0.35 (0.12; 1.02) | 0.06 |
| Model 3 | 0.29 (0.09; 0.91) | 0.03 |
| A C A C A G T | ||
| Model 1 | 1.74 (1.11; 2.72) | 0.01 |
| Model 2 | 1.63 (1.05; 2.54) | 0.03 |
| Model 3 | 1.74 (0.99; 3.00) | 0.05 |
aHaplotypes are designated by the corresponding nucleotides at SNPs 1, 2, 4, 7, 9, 11 and 12, in that order.
bRelative to individuals not carrying the given haplotype. SNPs that uniquely tag common haplotypes are shown in bold.
References
Levy, E., Carman, M.D., Fernandez-Madrid, I.J., Power, M.D., Lieberburg, I., van Duinen, S.G., Bots, G.T., Luyendijk, W. and Frangione, B. (
Craig, H.D., Gunel, M., Cepeda, O., Johnson, E.W., Ptacek, L., Steinberg, G.K., Ogilvy, C.S., Berg, M.J., Crawford, S.C., Scott, R.M. et al. (
Joutel, A., Corpechot, C., Ducros, A., Vahedi, K., Chabriat, H., Mouton, P., Alamowitch, S., Domenga, V., Cecillion, M., Marechal, E. et al. (
Kobayashi, Y., Momoi, M.Y., Tominaga, K., Shimoizumi, H., Nihei, K., Yanagisawa, M., Kagawa, Y. and Ohta, S. (
Capdevila, J.H., Falck, J.R. and Estabrook, R.W. (
Zeldin, D.C. (
Imig, J.D., Navar, L.G., Roman, R.J., Reddy, K.K. and Falck, J.R. (
Node, K., Huo, Y., Ruan, X., Yang, B., Spiecker, M., Ley, K., Zeldin, D.C. and Liao, J.K. (
Heizer, M.L., McKinney, J.S. and Ellis, E.F. (
Davis, B.B., Thompson, D.A., Howard, L.L., Morisseau, C., Hammock, B.D. and Weiss, R.H. (
Alkayed, N.J., Birks, E.K., Hudetz, A.G., Roman, R.J., Henderson, L. and Harder, D.R. (
Medhora, M., Narayanan, J. and Harder, D. (
Zhang, C. and Harder, D.R. (
Otsuka, T., Sugo, N., Koehler, R.C., Hurn, P.D., Traystman, R.J. and Alkayed, N.J. (
Fornage, M., Hinojos, C.A., Nurowska, B.W., Boerwinkle, E., Hammock, B.D., Morisseau, C.H. and Doris, P.A. (
Przybyla-Zawislak, B.D., Srivastava, P.K., Vazquez-Matias, J., Mohrenweiser, H.W., Maxwell, J.E., Hammock, B.D., Bradbury, J.A., Enayetallah, A.E., Zeldin, D.C. and Grant, D.F. (
Sandberg, M., Hassett, C., Adman, E.T., Meijer, J. and Omiecinski, C.J. (
Srivastava, P.K., Sharma, V.K., Kalonia, D.S. and Grant, D.F. (
Fornage, M., Boerwinkle, E., Doris, P.A., Jacobs, D., Liu, K. and Wong, N.D. (
Shifman, S., Kuypers, J., Kokoris, M., Yakir, B. and Darvasi, A. (
Reich, D.E., Cargill, M., Bolk, S., Ireland, J., Sabeti, P.C., Richter, D.J., Lavery, T., Kouyoumjian, R., Farhadian, S.F., Ward, R. et al. (
Comeron, J.M., Kreitman, M. and De La Vega, F.M. (
Lohmueller, K.E., Pearce, C.L., Pike, M., Lander, E.S. and Hirschhorn, J.N. (
Cohen, J.C., Kiss, R.S., Pertsemlidis, A., Marcel, Y.L., McPherson, R. and Hobbs, H.H. (
Clark, A.G. (
Schaid, D.J. (
Comeron, J.M. and Aguade, M. (
Comeron, J.M. and Kreitman, M. (
Cartegni, L., Wang, J., Zhu, Z., Zhang, M.Q. and Krainer, A.R. (
Nalla, V.K. and Rogan, P.K. (
Beckman, J.A., Ganz, J., Creager, M.A., Ganz, P. and Kinlay, S. (
Nandalur, K.R., Baskurt, E., Hagspiel, K.D., Phillips, C.D. and Kramer, C.M. (
Hunt, J.L., Fairman, R., Mitchell, M.E., Carpenter, J.P., Golden, M., Khalapyan, T., Wolfe, M., Neschis, D., Milner, R., Scoll, B. et al. (
Shaalan, W.E., Cheng, H., Gewertz, B., McKinsey, J.F., Schwartz, L.B., Katz, D., Cao, D., Desai, T., Glagov, S. and Bassiouny, H.S. (
Cronin, A., Mowbray, S., Durk, H., Homburg, S., Fleming, I., Fisslthaler, B., Oesch, F. and Arand, M. (
Newman, J.W., Morisseau, C., Harris, T.R. and Hammock, B.D. (
Hinds, D.A., Stuve, L.L., Nilsen, G.B., Halperin, E., Eskin, E., Ballinger, D.G., Frazer, K.A. and Cox, D.R. (
The International HapMap Consortium (
The ARIC Investigators. (
Rosamond, W.D., Folsom, A.R., Chambless, L.E., Wang, C.H., McGovern, P.G., Howard, G., Copper, L.S. and Shahar, E. (
Carlson, C.S., Eberle, M.A., Rieder, M.J., Yi, Q., Kruglyak, L. and Nickerson, D.A. (
Fornage, M. and Doris, P.A. (
Barlow, W.E. (
Schaid, D.J., Rowland, C.M., Tines, D.E., Jacobson, R.M. and Poland, G.A. (
