


Abstract
Huntington's disease (HD) pathology is well understood at a histological level but a comprehensive molecular analysis of the effect of the disease in the human brain has not previously been available. To elucidate the molecular phenotype of HD on a genome-wide scale, we compared mRNA profiles from 44 human HD brains with those from 36 unaffected controls using microarray analysis. Four brain regions were analyzed: caudate nucleus, cerebellum, prefrontal association cortex [Brodmann's area 9 (BA9)] and motor cortex [Brodmann's area 4 (BA4)]. The greatest number and magnitude of differentially expressed mRNAs were detected in the caudate nucleus, followed by motor cortex, then cerebellum. Thus, the molecular phenotype of HD generally parallels established neuropathology. Surprisingly, no mRNA changes were detected in prefrontal association cortex, thereby revealing subtleties of pathology not previously disclosed by histological methods. To establish that the observed changes were not simply the result of cell loss, we examined mRNA levels in laser-capture microdissected neurons from Grade 1 HD caudate compared to control. These analyses confirmed changes in expression seen in tissue homogenates; we thus conclude that mRNA changes are not attributable to cell loss alone. These data from bona fide HD brains comprise an important reference for hypotheses related to HD and other neurodegenerative diseases.
INTRODUCTION
Huntington's disease (HD) is an autosomal dominant neurological disorder associated with dysfunction and degeneration of the basal ganglia. It has a mid-life onset and progresses inexorably over 15–20 years, with characteristic motor and cognitive symptoms, to death. A CAG expansion in the HD gene leads to the expression of an expanded polyglutamine tract in the encoded huntingtin protein (1). Mutant huntingtin is expressed ubiquitously but its pathology is regionally specific with the earliest and most severe changes noted in the striatum. Factors underlying this specificity remain unclear (2).
Neuropathological staging of human HD uses a five-point system on the basis of the macroscopic appearance of the brain and cell counts in the head of the caudate nucleus (2). In Grade 0 HD, the brain is macroscopically normal. Microscopic examination shows no astrocytosis and <40% loss of neurons, although neuronal loss in Grade 0 HD brains is generally closer to 30–40% than it is to 0%. In Grade 1 HD, moderate astrocytosis becomes apparent in the medial caudate and dorsal putamen, and neuronal loss has increased to 50%. By Grade 4, macroscopic atrophy is very severe, astrocytosis is prevalent in many areas and caudate neuronal loss is >90%.
The observed neuropathology of human HD represents the end result of a cascade of events to which some neurons are more susceptible and others more resistant. Although the most obvious and striking neuropathology of HD is the dramatic loss of medium spiny neurons in the caudate nucleus, thorough examination shows that other brain regions are affected in HD, and cortical cell loss is often reported. Other areas such as cerebellum typically show little or no detectable cell loss, although the whole brain appears atrophic (3). Objectively attaining genome-wide definitions of sensitive and resistant cell populations provides a more complete reference for understanding critical aspects of disease vulnerability.
Here we show that mRNA changes are extensive in Grades 0–2 HD brains. Overall, we observe that human RNA expression changes are most prevalent in brain regions susceptible to neurodegeneration. Consistent changes in expression also occur in individual cells and thus the observed decreases in expression in the caudate do not simply reflect cell loss. These data highlight aspects of HD not readily apparent from neuropathological studies. We find that functionally distinct areas of the cerebral cortex exhibit vastly different levels of altered gene expression, with motor regions showing greater effects than cognitive regions. Gene ontology (GO) analysis of the functions of differentially expressed genes suggests increased expression of genes related to central nervous system (CNS) development in both caudate and motor cortex. While identifying new aspects of HD and deepening our view of its known neuropathology, the human gene expression data provide a heretofore-missing reference for evaluating animal and in vitro models of HD in which specific mechanistic hypotheses can be explored.
RESULTS
Regional differences and similarities in gene expression within HD brains
Using microarrays, we examined mRNA levels in 44 human HD brains and 36 age- and sex-matched controls in a global and unbiased analysis (Tables 1 and 2). Neuropathological staging of the HD cases ranged from Vonsattel Grades 0–4, with the majority assessed as Grades 0–2 (Table 1). Analyses included tissue dissected from caudate, the brain region with the earliest and most severe pathology in HD (2), cerebellum, which has very little pathology, and two cortical areas, BA4 (motor cortex) and BA9 (prefrontal association cortex). BA4 is involved in motor function, which is typically affected early in HD, whereas BA9 is involved in cognitive processing, which is often preserved in early stage disease. Samples were included in the study only if they passed RNA quality tests and corresponding case records showed no evidence of ischemia or other agonal events that could confound the analysis (Table 1, Materials and Methods) (4). A small number of additional samples were excluded on the basis of systematic quality assessment post-hybridization to Affymetrix HG-U133A and HG-U133B arrays (see Materials and Methods). Primary analyses compared the Vonsattel Grade 0–2 HD cases with controls, treating each brain region separately. A statistical criterion of P<0.001 was used as the threshold for differential expression; at this threshold, one would expect ∼0.1% or 45 of the 45 000 probe sets on the arrays to be called differentially expressed by chance.
Analysis using Bioconductor software (5) revealed that HD caudate had the largest number of mRNA changes. In caudate (N=34 HD/32 controls), 21% (9763) of the probe sets demonstrated significant differential expression (Table 2) (Supplementary Material, Table S1). As grade increased, the magnitudes of caudate changes became larger, although this trend was only statistically significant for downregulated mRNAs (Fig. 1). Only ∼1% (513) of probe sets showed mRNA changes in the cerebellum (N=33 HD/28 controls, Table 2) (Supplementary Material, Table S1). The magnitudes of gene expression changes were also smaller in the cerebellum than in the caudate (Fig. 2 and Table 3) (Supplementary Material, Table S1).
We next examined gene expression in the cortical areas. In HD BA4 motor cortex (N=16 HD/15 controls), 3% (1482) of the probe sets detected changes in mRNA expression (Table 2) (Supplementary Material, Table S2). In stark contrast to HD BA4, there were no changes in expression in HD BA9 beyond the number expected by chance (N=10 HD/8 controls, Table 2) (Supplementary Material, Table S2). This held true even when samples from HD BA9 with Grades 3–4 pathology were considered (Supplementary Material, Table S2).
Overall, the regional changes in gene expression are consistent with the neuropathology in early grade HD, with caudate being the most affected area, the cerebellum and BA9 cortex being relatively spared and the BA4 cortex showing an intermediate pathology.
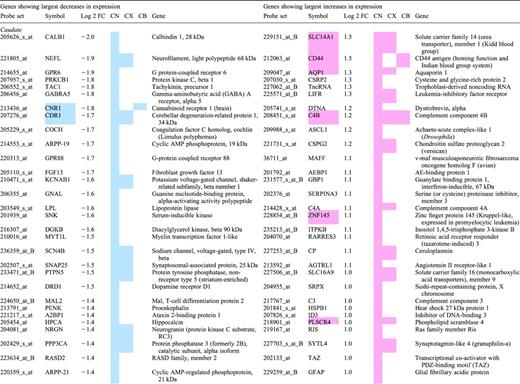
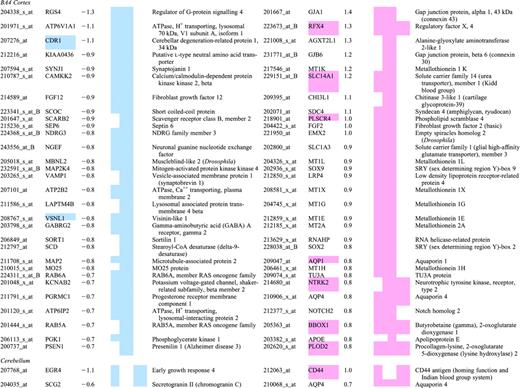
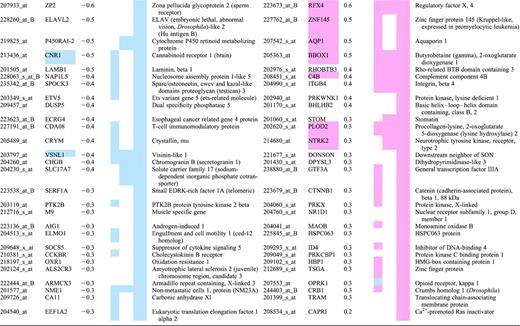
We next examined some of the specific genes affected by HD in the various regions to consider the cellular and molecular processes underlying the changes. mRNAs showing the largest fold change in differential expression between HD and controls are shown in Table 3; those differentially expressed in more than one brain region are highlighted. The expression of genes associated with gliosis and neuroinflammatory processes, such as glial fibrillary acidic protein, gap junction proteins and complement components, were found to be up-regulated, particularly in caudate. These apparent mRNA increases may reflect the differences in represented cell populations in the samples, as glial:neuronal ratios are known to be higher in degenerating brain regions (2).
In comparing mRNA changes between caudate and cortex, a feature of the human HD microarray phenotype not apparent from the known neuropathology was revealed. Of the 1482 dysregulated BA4 probe sets (P<0.001), 806 were significantly dysregulated in the same direction in HD caudate, whereas only 13 changes were discordant (Table 3) (Supplementary Material, Tables S1 and S2). This underscores a previously unappreciated uniformity to effects in brain regions commonly thought to be differentially affected by HD.
Caudate expression changes are not simply the result of cell loss
Although it was hypothesized that the extent of gene expression changes in various brain regions would correlate with the overall pattern of disease pathology, this result also raised the question of whether mRNA/cell changes could be seen beyond those due to differences in cell ratios. To investigate whether the mRNA changes we observed in the caudate were independent of neuronal loss, we carried out laser-capture microdissection (LCM) analyses of a small number of brains (four HD Grade 1, four controls). This technique ensured that the same number of neurons would be included in each sample (6). Although the statistical power of these analyses was limited, the HD versus control LCM samples show strong similarities to the brain homogenates, particularly among genes with decreased expression. Of probe sets detecting differential expression in HD caudate homogenates (P<0.001), 65% of those showing increased expression and 77% of those showing decreased expression show the same direction of change in the LCM data (Fig. 3). We further assessed the relationship between the homogenate and LCM data by performing a Kolmogorov–Smirnov (KS) test and examining the correlation coefficient between moderated t-statistics of the differentially expressed caudate probe sets within the LCM data set (see Materials and Methods). In none of 10 000 data permutations did we observe a KS score as large as the one obtained in the data. In addition, the correlation coefficients of differentially expressed caudate probe sets are higher than those for similarly expressed ones: Kendall tau (Pearson's rho) for similarly expressed genes=0.03 (0.06); for upregulated probe sets=0.10 (0.16) and for downregulated probe sets 0.20 (0.28). These results are consistent with the hypothesis of association between the homogenate and LCM data sets for the genes differentially expressed between HD and control.
We then used the LCM data to identify the changes in differentially expressed caudate mRNAs, which occur on an mRNA/cell level. The top 50 mRNAs showing differential expression in both LCM and homogenate samples are shown in Table 4. mRNAs whose products have been shown previously to be decreased in HD were detected, including those encoding the adenosine A2A and cannabinoid CB1 receptors, substance P, protein kinase C beta and calbindin 1.
Signaling pathways and axonal structural elements show the greatest impact of gene expression changes
Analyses to identify transcriptional changes within known pathways were conducted to complement findings on individual genes. To identify objectively the biological pathways in which the dysregulated mRNAs function, the GO database was queried (http://www.geneontology.org) (7) using all the probe set IDs showing differential expression in HD caudate or BA4 cortex at P<0.001 (see Materials and Methods) (Table 5). Consistent with previous observations in HD brain and model systems, many of the pathways that show the highest proportion of mRNA changes in caudate relate to neuronal signaling and homeostasis (8). The majority of changes in these categories have lower expression in HD. The largest group of mRNAs showing changed expression in the caudate encodes neurotransmitter receptors. In this category, alterations extend to many molecular subtypes, including metabotropic and ionotropic receptor subunits, and those conveying signals from different transmitters, including excitatory amino acids, GABA, dopamine and cannabinoids. These results extend previous in vivo and in vitro observations in human HD brain (9).
Changes in gene expression in several categories related to ion transport are observed in both caudate and BA4 cortex (Table 5). Consistent with previous data from R6/2 mice (8,10,11), a considerable number of Ca2+-binding protein and Ca2+, K+ and Na+ channel mRNAs are downregulated. A novel finding in the present data set is that mRNAs encoding proton channel subunits also display large fold changes in their expression. Most of these changes are in mRNAs encoding vacuolar proton channel complex subunits, and these are likely to affect a number of important neuron-related processes including neurotransmitter release from synaptic vesicles (12) and autophagy (13,14). Other interesting and new observations are the over-representation of nodes related to CNS development and neurogenesis in both HD caudate and BA4. These genes are generally upregulated in HD (Table 5), supporting the recent observation of increased neurogenesis in HD brain (15).
Although HD caudate and HD BA4 show many overlapping gene expression changes, some interesting differences in represented biological processes were also observed. Notably, mRNAs encoding microtubule structure and transport components, including tubulin isoforms, were decreased in HD BA4 but not in HD caudate. These changes could represent a defect in the capacity of the cortical cells to maintain their axonal projections, thus impinging on corticostriatal signaling. Alternatively, such mRNA changes may reflect retrograde axonal dysfunction and degeneration in corticostriatal neurons initiated by striatal medium spiny neuron dysfunction; this explanation could also account for the observed asymmetry between the large number of mRNA changes in BA4 and the absence of changes in BA9.
Accumulation of polyglutamine proteins and aberrant protein–protein interactions have been correlated with HD pathology, and preventing or reversing these processes is often proposed as a way to overcome the effects of HD. Indeed, chaperonins, heat shock proteins and other protein-folding enzymes have been identified in suppressor/enhancer screens of polyglutamine toxicity (16–18). We find only limited evidence that these sorts of genes are induced as an auto-protective mechanism. In caudate and BA4 cortex, a number of mRNAs encoding peptidyl prolyl cis–trans isomerases, heat shock proteins, chaperonins, protein trafficking machinery and unfolded protein response proteins are dysregulated, but there is no consistent pattern to the changes. Moreover, there is little evidence for the normal expression of these genes being higher in areas of the brain relatively unaffected by HD (data not shown). These analyses do not address post-transcriptional regulation, which is known to be important for several of these pathways.
DISCUSSION
Molecular pathology of HD
The human HD profiles reported here are the culmination of work by many investigators to create a public record of HD-related gene expression (10,11,19–24). These data come from a large number of well-preserved samples and are likely to be the definitive picture of gene expression in human HD brain for some time to come.
The major findings of this study involve new and richer descriptions of human HD. The accuracy of these descriptions is confirmed by their agreement with known features of HD, both in their wide sweep and in their detail. Broadly, we find that the transcriptional pathology of HD shows a distinct regional pattern that parallels the known pattern of neurodegeneration: caudate>motor cortex>cerebellum. Also, our data reveal striking similarities in the effects provoked in caudate and motor cortex. This overlap suggests a shared molecular mechanism of HD-related dysfunction in both regions, despite the fact that the HD-sensitive (glutamatergic) corticostriatal pyramidal neurons have a different neurochemistry than the HD-sensitive (GABAergic) medium spiny neurons of the caudate.
The gene expression profiles also highlight new subtleties of the effects of HD within the cortex. Our data indicate that there are profound HD-related differences between prefrontal association cortex and motor cortex. To our knowledge, there are no published data on the comparative cellular pathology between BA4 and BA9 with which we may compare our findings. The present findings are consistent with recent neuroimaging data, however; using high resolution magnetic resonance imaging, shrinkage of areas in the cortical ribbon associated with motor function has been detected in early HD (25). This new appreciation of cortical dysfunction may eventually offer insights into the spectrum of motor and psychiatric presentations found in HD patients.
When considered in detail, our data is also consistent with mRNA changes in HD brains reported from in situ hybridization studies (26–29). Extrapolations from the gene expression data to protein levels are also consistent with reported changes in G-protein-coupled receptor densities (30–32) and immunohistochemical changes, such as the downregulation of calbindin (33).
Cell loss and cellular dysfunction
One limitation of studies using tissue samples from HD brains is that changes in susceptible cells are inextricably mixed with those reflecting previous neurodegeneration. Thus, some of the apparent differental gene expression may be inflated by (or even attributed to) shifts in cell populations, specifically the loss of neurons and gain of astrocytes and microglia. The LCM data, however, indicate that at least some of the detected changes are due to medium spiny neuron dysfunction on an mRNA/cell level. Also, the confounding effect of previous neuronal loss is likely to be much smaller in the BA4 motor cortex: preliminary studies suggest cell loss of only 4–20% in Grades 0–2 BA4 (D. Thu and R.L.M. Faull, unpublished data). Moreover, cell loss is probably negligible in the cerebellum. Thus, the changes we report here are not merely a trivial representation of brain tissue from which neurons are missing.
Occasionally, the brains of individuals manifesting symptoms of HD show no detectable neurodegeneration (34,35). In addition, mouse models of HD can exhibit severe behavioral changes without detectable neuronal loss (36,37). These findings suggest that HD-affected neurons are dysfunctional for a time before they eventually die and that this dysfunctional state contributes to disease. Further evidence for the existence of cellular dysfunction upstream of cell death comes from our analyses of laser-captured neurons that confirm a subset of molecular changes at an mRNA/cell level.
The high proportion of genes showing HD-related differential expression, involving up to 21% of all genes in the caudate, suggests that caution be exercised in projecting the functional impact of any single molecular change. Hypotheses underpinned by changes in the expression of groups of genes, such as those seen in more than one area of the brain or common functional pathways, may prove to be more robust.
Conclusions and implications for future studies
In summary, the data presented here provide an objective and comprehensive molecular description of low-grade HD neuropathology for the first time. These findings demonstrate that differential gene expression in HD brain shows a distinct regional pattern that generally parallels, but is not limited to, the known pattern of neuronal loss. The gene expression profiles of HD caudate and HD motor cortex are strikingly similar, suggesting that there may be similar general molecular characteristics to the neurodegenerative process in different regions of the brain.
These data also reveal novel HD-related molecular differences between motor cortex and a cortical area implicated in cognition. Further examination of the properties of neurons resistant to mutant HD-induced transcriptional changes may reveal criticial pathogenic or protective pathways.
Ongoing studies of HD mechanisms should consider the molecular information provided from this large collection of well-preserved HD brains. One immediate application of these findings is in the assessment of disease hypotheses related to transcription (6,9,11,38). To find a platform for studying the etiology of gene expression changes, however, one must first identify HD models that faithfully reproduce those seen in human HD brain (39).
MATERIALS AND METHODS
Human microarray samples
Affymetrix GeneChip microarray analyses of caudate nucleus, frontal cortex and cerebellum samples were conducted with RNA extracted from fresh-frozen samples collected with minimal postmortem interval to autopsy from 44 HD-gene-positive cases and 36 age- and sex-matched controls (Table 1; NCBI Gene Expression Omnibus entry GSE3790; EBI Array Express entry E-AFMX-6). All samples were carefully selected on the basis of RNA quality and antemortem variables, and the HD cases were additionally analyzed on the basis of the presence or absence of disease symptoms and Vonsattel grade of disease pathology (scale=0–4) (2). Tissues were collected from precise anatomical regions and stored at −80°C. Where available for each case, frozen blocks of the head of the caudate nucleus, frontal cortex [motor cortex (BA4) or prefrontal association cortex (BA9)] and cerebellum (non-vermal cerebellar hemisphere) were further dissected to provide 10–200 mg tissue samples for RNA extraction. Pathological grading of HD cases was performed from corresponding formalin-fixed, paraffin-embedded caudate nucleus sections according to the Vonsattel scale (2), by two neuropathologists with special interest and expertise in HD pathology. This grading scale is based on the overall pattern of neuropathology of the caudate nucleus and on the numbers and ratio of neurons and astrocytes. A subset of cases were cross-referenced across collection sites to confirm consistency of the grading procedure. DNA was extracted from all cases and controls and genotyped for the CAG repeat length alleles in IT15 (HD gene), as described previously (40). Postmortem interval to autopsy was available for the majority of samples and detailed clinical information for many. RNA integrity was assessed by capillary electrophoresis on a bioanalyzer 2100 (Agilent) using 300 ng of total RNA. RNA samples without sharp ribosomal RNA peaks were generally excluded from further processing steps.
Microarray sample processing
RNA was extracted using TRIzol (Invitrogen) or Tri-Reagent (Sigma) followed by RNeasy column cleanup (Qiagen) using the manufacturers' protocols. Ten micrograms of total RNA from each sample were used to prepare biotinylated fragmented cRNA according to the GeneChip® Expression Analysis Protocol (Rev. 2, March 2003), with products from Affymetrix. Microarrays (Human Genome U133A and U133B) were hybridized for 16 h in a 45°C incubator with constant rotation at 60 r.p.m. Chips were washed and stained on the Fluidics Station 400 and scanned using the GeneArray® 2500, according to the GeneChip Expression Analysis Protocol (Affymetrix).
Microarray quality control
Two procedures were used to assess array quality and remove outlier chips; arrays defined as outliers by either procedure were excluded from further analyses. We used the PM/MM difference outlier algorithm of Li and Wong (41), implemented in dChip software (http://www.biostat.Harvard.edu/complab/dchip). In addition, we used a quality assessment algorithm based on weights from robust regression models fits of gene expression with both chip and probe effects (42). For these robust regression models, outlier probes receive lower weight in the model fitting. Chips with aberrant patterns of low weights were excluded from further analyses.
Laser-capture microdissection
Methylene blue-stained neuronal profiles were microdissected from 7 µm sections of human brain tissue using an AutoPix instrument (Arcturus) as previously described (6). RNA from 5000 neuronal profiles per brain were extracted with the PicoPure isolation kit (Arcturus) and prepared for hybridization to HG-U133 Plus 2.0 arrays using a Two-Cycle Target Amplification kit (Affymetrix). Four HD Grade 1 and four (4) age- and gender-matched controls were included in the present analysis. Microarray analyses were conducted as described below (for homogenate RNA samples), except that no correction was made for age, gender or collection site. (However, sample groups were matched for these criteria.)
We tested the similarity of mRNA changes found after LCM and mRNA changes previously detected in caudate. Considering the 44 692 HG-U133 Plus 2.0 probe sets present on HG-U133 A and HG-U133 B chips, we ordered them according to their absolute expression change in LCM data and used the KS statistic to quantify similarity with expression changes detected in caudate (P<0.001, ordered by increasing P-value). The KS statistic takes large values when the relative ordering of probe sets is similar in both lists (43). We also examined the correlation between the two sets (both Kendall tau and Pearson's rho). Assigning an appropriate P-value in this case is difficult, as formal hypothesis tests assume independence of the probe sets within each list. We did, however, explore the permutation distribution of the KS statistic. Here, we randomly permuted the order of probe sets in the LCM list of expression changes and computed the resulting KS statistic 10 000 times. None of the permutations resulted in a larger KS statistic than the one observed with the original data.
Statistical analyses of differential gene expression
Statistical analyses of gene expression measures for included chips were carried out with open source R software packages available as part of the BioConductor project (http://www.bioconductor.org). Gene expression was quantified by robust multi-array analysis (44,45) using the affy package (46).
To identify genes differentially expressed between HD (Grades 0–2) and controls for each brain region, we computed empirical Bayes moderated t-statistics with the limma package (47), correcting gene expression for collection site (Boston or New Zealand), gender and age [<45, (45–60), (60–70) and 70+ years]. Unless otherwise stated, reported P-values are nominal, unadjusted. R code for these analyses is available on request.
GO analysis
GO categories were tested for over-representation in the list of the 9763 most significant probe sets (P<0.001) in HD caudate and the 1482 most significant probe sets (P<0.001) in HD BA4 cortex compared with control. P-values for over-representation were calculated by Fisher's exact test if either the number of probes in a category on the list or the number of probe sets not on the list were less than 10, with Pearson's chi-squared test used otherwise. The most significantly over-represented categories are shown in Table 5. We also tested whether more categories attained a given P-value for over-representation than would be expected by chance. This was done by randomly selecting 9763 of the 44 860 probe sets to be on the list and repeating the analysis for each category for the caudate and 1482 of the 44 860 for cortex. The whole process was repeated 3691 times for caudate and 9000 times for cortex, and in none of the replicate lists were as many categories over-represented as in the actual data. This suggests that the results shown in Table 5 are due to genuine differential expression of certain gene categories, rather than stochastic variation.
SUPPLEMENTARY MATERIAL
Supplementary Material is available at HMG Online.
ACKNOWLEDGEMENTS
We would like to thank all the HD families who have contributed to this research, the New Zealand Neurological Foundation Brain Bank, the Hereditary Disease Foundation's Rare Tissue and Venezuela Project Tissue Collections, Marie-Francoise Chesselet, the Harvard Brain Tissue Resource Center and the UCLA Human Brain and Spinal Fluid Resource Center. We are grateful to Kathy Newell, Matthew Frosch and Jean Paul Vonsattel for sharing their insights regarding HD neuropathology. We thank the Wales Gene Park and Cardiff University Central Biotechnology Services, Christine Keller-McGandy, Ismail Azzabi and Claude Alves for technical assistance with array samples and the DNA diagnostic Laboratory of Massachusetts General Hospital, Marcy MacDonald and Jayalakshmi Mysore for HD genotyping. Thanks also to Juan Botas, Marcy MacDonald, Todd Golub, Carl Johnson, Peter Detloff, Roger Albin and Robert Ferrante for critical review of the manuscript. Funding was provided by the Hereditary Disease Foundation's Cure HD Initiative, High Q Foundation, USA National Institutes of Health (CA74841 to C.K., A.K.A.), Ecole Polytechnique Fédérale de Lausanne (R.L.-C.), Medical Research Council UK (L.J., L.A.E.), Biotechnology and Biological Sciences Research Council UK (L.J., A.H., G.H.), Wales Office for Research and Development (C.H.), Health Research Council of New Zealand, New Zealand Neurological Foundation and University of Auckland (R.L.M.F., D.T.), National Center of Competence in Research on Molecular Oncology, a research program of the Swiss National Science Foundation (T.S., M.D.) and the Novartis Foundation (A.K.).
Conflicts of Interest statement. None declared.
Present address: MRC Centre for Neurodegeneration Research, Department of Psychological Medicine, Box PO 70, Institute of Psychiatry, King's College London, De Crespigny Park, London SE5 8AF, UK.
The authors wish it to be known that, in their opinion, the last three authors should be regarded as joint Senior Authors.
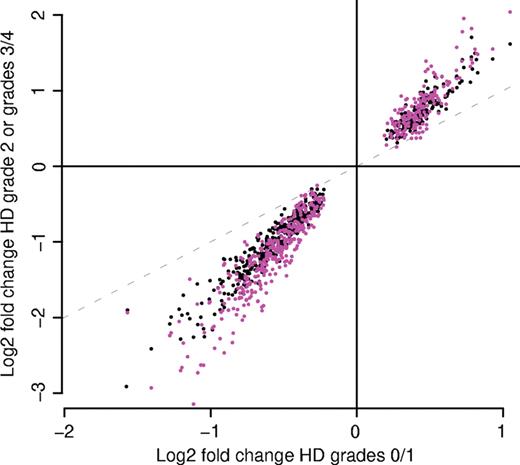
Figure 1. The magnitude of gene expression change increases with pathological grade. The log 2 fold change in Vonsattel Grade 0/1 HD cases (x-axis) is plotted against either the log 2 fold change in Grade 2 HD cases (y-axis, black dots) or the log 2 fold change in Grade 3/4 cases (y-axis, fuschia dots). The data displayed pertains to the 500 probe sets with the smallest P-values when Grades 0, 1 and 2 are considered together.
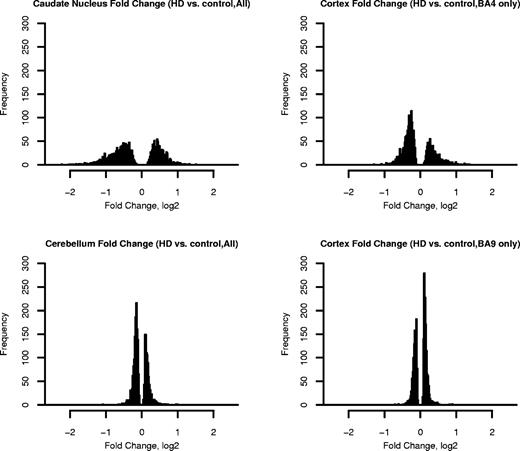
Figure 2. Histograms showing distributions of fold change magnitudes in four brain regions. Grades 0–2 HD cases were compared with unaffected controls. For clarity, only information from the 5% of probe sets with smallest P-values is shown. Fold changes are expressed on the log 2 scale.
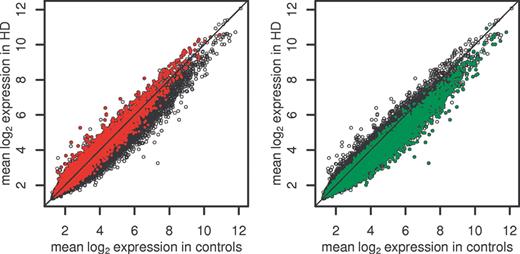
Figure 3. Behavior of probe sets in LCM with respect to prediction by caudate homogenate data (HD versus control caudate). Probe sets meeting P<0.001 in the homogenate data set are represented by red points if increased (left panel) and green points if decreased (right panel). (Probe sets not meeting P<0.001 are represented by open circles.)
Characteristics of the human brain samples analyzed by microarray
| Brain region | Cerebellum | Caudate | Frontal cortex | Total | ||
|---|---|---|---|---|---|---|
| BA4a | BA9a | combined | ||||
| Number of samples included in analysisb,c | 67 | 70 | 36 | 30 | 66 | 203b |
| Controls | 28 | 32 | 17 | 12 | 29 | 89 |
| Male | 17 | 23 | 11 | 8 | 19 | 59 |
| Female | 11 | 9 | 6 | 4 | 10 | 30 |
| Age (years) | ||||||
| IQR | 48.8–69.8 | 47.5–69.8 | 49.0–69.0 | 35.0–68.0 | 46.0–68.0 | |
| Median | 63.5 | 62.5 | 63 | 56 | 62 | |
| Genotyped | ||||||
| IQR | 17–21.3 | 17–20.3 | 17–21 | 17.8–20.8 | 17–21 | |
| Median | 19 | 19 | 19 | 20 | 19 | |
| HD | 39 | 38 | 19 | 18 | 37 | 114 |
| Male | 23 | 23 | 9 | 13 | 22 | 68 |
| Female | 16 | 15 | 10 | 5 | 15 | 46 |
| Age (years) | ||||||
| IQR | 46.5–68.5 | 47.8–69.8 | 48.5–66.0 | 40.5–64.8 | 45.0–65.0 | |
| Median | 59 | 61.5 | 62 | 54 | 58 | |
| Genotyped | ||||||
| IQR | 42–45 | 42–45 | 42–44.5 | 43–45.8 | 42–46 | |
| Median | 43 | 42.5 | 42 | 44.5 | 43 | |
| Grade 0 | 3e | 3e | 1 | 2e | 3e | 9 |
| Grade 1 | 13f | 13e | 8 | 4f | 12f | 38 |
| Grade 2 | 15 | 16 | 9 | 5 | 14 | 45 |
| Grades 3–4 | 8 | 6 | 1 | 7 | 8 | 22 |
IQR, interquartile range (25th–75th percentile). Medians with decimal places represent an even number of samples where the final median value is the average of the two middle samples.
aBA4 and BA9 samples were from different cases. Thirty-two BA4 and 20 BA9 cases were also able to be analyzed for cerebellum and caudate.
bSamples where the A and/or B chip passed post-hybridization quality control (201 A chips and 203 B chips).
cThere were 52 cases for which samples from cerebellum, caudate and frontal cortex were analyzed.
dLargest allelic CAG repeat in the HD gene of each individual. HD samples are all in the pathological range (>35 repeats).
eIncludes one presymptomatic case.
fIncludes two presymptomatic cases.
Regional mRNA changes in human HD brain
| Sample group | Tissue | Grade | Number of samples | Number of probe setsa | Detectable SDb | |||
|---|---|---|---|---|---|---|---|---|
| HD | Control | Total | Increased in HD | Decreased in HD | ||||
| All cases | Caudate | 0–2 | 34 | 32 | 9763 | 5331 | 4432 | 0.85 |
| Cerebellum | 0–2 | 33 | 28 | 513 | 131 | 382 | 0.89 | |
| Subsets of cases | BA4 cortex | 0–2 | 16 | 15 | 1482 | 524 | 958 | 1.32 |
| BA9 cortex | 0–2 | 10 | 8 | 6 | 1 | 5 | 1.9 | |
| BA9 cortex | 3–4 | 5 | 12 | 19 | 19 | 0 | 2.23 | |
aHD cases versus control; P<0.001 at which the predicted false discovery=45 probe sets in the ‘Total’ column for each set of samples. Statistical analyses of gene expression measures were carried out with open source R software packages available as part of the BioConductor project (http://www.bioconductor.org).
bThe power to detect changes increases with the number of replicates. The standard deviation at which a difference is detected within a group at P<0.001 for the various different sample sizes is summarized in the column ‘detectable SD’. The number of predicted false discoveries (45 per cohort) is independent of the number of replicates.
Top 30 mRNAs in each region showing differential expression in human Huntington's disease brain
 |
 |
 |
|
|
|
Grades 0–2 HD cases were compared to unaffected controls on Affymetrix HG-U133A and HG-U133B arrays. A statistical cutoff of P<0.001 was used as criteria for differential expression. Differentially expressed probesets were ranked based on their fold change, HD/control. The 30 genes with the largest magnitude decreases in HD (left panels) and increases in HD (right panels) are shown for the caudate, cerebral cortex (Brodmann's area 4) and cerebellum. Probesets for ESTs and genes without annotation have been omitted from this table. In cases where multiple probesets represent the same mRNA, the probeset with the largest magnitude of change is shown. Several genes appear in the top 30 lists in more than one brain region; they are indicated by a colored cell in the Gene Symbol column. Color in the columns CN, CX and CB is used to indicate if a probeset met the P<0.001 criteria and its direction of change in caudate (CN), BA4 cortex (CX) or cerebellum (CB). Blue is used to represent reduced expression in HD, light red is used to indicate increased expression in HD.
Top 30 mRNAs in each region showing differential expression in human Huntington's disease brain
|
|
|
|
|
|
Grades 0–2 HD cases were compared to unaffected controls on Affymetrix HG-U133A and HG-U133B arrays. A statistical cutoff of P<0.001 was used as criteria for differential expression. Differentially expressed probesets were ranked based on their fold change, HD/control. The 30 genes with the largest magnitude decreases in HD (left panels) and increases in HD (right panels) are shown for the caudate, cerebral cortex (Brodmann's area 4) and cerebellum. Probesets for ESTs and genes without annotation have been omitted from this table. In cases where multiple probesets represent the same mRNA, the probeset with the largest magnitude of change is shown. Several genes appear in the top 30 lists in more than one brain region; they are indicated by a colored cell in the Gene Symbol column. Color in the columns CN, CX and CB is used to indicate if a probeset met the P<0.001 criteria and its direction of change in caudate (CN), BA4 cortex (CX) or cerebellum (CB). Blue is used to represent reduced expression in HD, light red is used to indicate increased expression in HD.
Largest LCM mRNA changes concordant with caudate homogenate (HD versus control)
| Probe set ID | Log 2 FC | Name | Gene symbol |
|---|---|---|---|
| 203548_s_at | −2.90 | Lipoprotein lipase | LPL |
| 202429_s_at | −2.84 | Protein phosphatase 3 (formerly 2B), catalytic subunit, alpha isoform (calcineurin A alpha) | PPP3CA |
| 213436_at | −2.48 | Cannabinoid receptor 1 (brain) | CNR1 |
| 207957_s_at | −2.45 | Protein kinase C, beta 1 | PRKCB1 |
| 221482_s_at | −2.29 | Cyclic AMP phosphoprotein, 19 kDa | ARPP-19 |
| 218200_s_at | −2.20 | NADH dehydrogenase (ubiquinone) 1 beta subcomplex, 2, 8 kDa | NDUFB2 |
| 226390_at | −2.19 | START domain containing 4, sterol regulated | STARD4 |
| 224587_at | −2.12 | Activated RNA polymerase II transcription cofactor 4 | PC4 |
| 204796_at | −2.09 | Echinoderm microtubule associated protein-like 1 | EML1 |
| 214655_at | −2.05 | G protein-coupled receptor 6 | GPR6 |
| 208870_x_at | −2.05 | ATP synthase, H+ transporting, mitochondrial F1 complex, gamma polypeptide 1 | ATP5C1 |
| 228640_at | −2.05 | BH-protocadherin (brain–heart) | PCDH7 |
| 205110_s_at | −2.04 | Fibroblast growth factor 13 | FGF13 |
| 200738_s_at | −2.01 | Phosphoglycerate kinase 1 | PGK1 |
| 205280_at | −2.01 | Glycine receptor, beta | GLRB |
| 221805_at | −1.99 | Neurofilament, light polypeptide 68 kDa | NEFL |
| 231341_at | −1.98 | Solute carrier family 35, member D3 | SLC35D3 |
| 230130_at | −1.98 | Slit homolog 2 (Drosophila) | SLIT2 |
| 226185_at | −1.91 | CDP-diacylglycerol synthase (phosphatidate cytidylyltransferase) 1 | CDS1 |
| 208857_s_at | −1.90 | Protein-l-isoaspartate (d-aspartate) o-methyltransferase | PCMT1 |
| 222572_at | −1.90 | Protein phosphatase 2C, magnesium-dependent, catalytic subunit | PPM2C |
| 200650_s_at | −1.89 | Lactate dehydrogenase A | LDHA |
| 201889_at | −1.88 | Family with sequence similarity 3, member C | FAM3C |
| 205625_s_at | −1.88 | Calbindin 1, 28 kDa | CALB1 |
| 205348_s_at | −1.85 | Dynein, cytoplasmic, intermediate polypeptide 1 | DNCI1 |
| 200093_s_at | −1.81 | Histidine triad nucleotide-binding protein 1 | HINT1 |
| 202930_s_at | −1.79 | Succinate-CoA ligase, ADP-forming, beta subunit | SUCLA2 |
| 202196_s_at | −1.78 | Dickkopf homolog 3 (Xenopus laevis) | DKK3 |
| 204675_at | −1.78 | Steroid-5-alpha-reductase, alpha polypeptide 1 (3-oxo-5 alpha-steroid delta 4-dehydrogenase alpha 1) | SRD5A1 |
| 221434_s_at | −1.78 | Hypothetical protein DC50 | DC50 |
| 203817_at | −1.78 | Guanylate cyclase 1, soluble, beta 3 | GUCY1B3 |
| 200640_at | −1.76 | Tyrosine 3-monooxygenase/tryptophan 5-monooxygenase activation protein, zeta polypeptide | YWHAZ |
| 205352_at | −1.76 | Serine (or cysteine) proteinase inhibitor, clade I (neuroserpin), member 1 | SERPINI1 |
| 217722_s_at | −1.75 | Mesenchymal stem cell protein DSC92 | NEUGRIN |
| 202762_at | −1.75 | Rho-associated, coiled-coil containing protein kinase 2 | ROCK2 |
| 205122_at | −1.74 | Transmembrane protein with EGF-like and two follistatin-like domains 1 | TMEFF1 |
| 226884_at | −1.72 | Leucine-rich repeat neuronal 1 | LRRN1 |
| 200662_s_at | −1.72 | Translocase of outer mitochondrial membrane 20 (yeast) homolog | TOMM20 |
| 222870_s_at | −1.72 | UDP-GlcNAc:betaGal beta-1,3-N-acetylglucosaminyltransferase 1 | B3GNT1 |
| 210078_s_at | −1.71 | Potassium voltage-gated channel, shaker-related subfamily, beta member 1 | KCNAB1 |
| 221207_s_at | −1.71 | Neurobeachin | NBEA |
| 206552_s_at | −1.70 | Tachykinin, precursor 1 (substance K, substance P, neurokinin) | TAC1 |
| 233437_at | −1.70 | Gamma-aminobutyric acid (GABA) A receptor, alpha 4 | GABRA4 |
| 201362_at | −1.69 | NS1-binding protein | NS1-BP |
| 220313_at | −1.68 | G-protein coupled receptor 88 | GPR88 |
| 219619_at | −1.68 | DIRAS family, GTP-binding RAS-like 2 | DIRAS2 |
| 203404_at | −1.64 | Armadillo repeat protein ALEX2 | ALEX2 |
| 240532_at | −1.63 | Vesicular inhibitory amino acid transporter | VIAAT |
| 206858_s_at | 1.63 | Homeobox C6 | HOXC6 |
| 229019_at | −1.63 | Zinc finger protein 533 | ZNF533 |
RNAs showing differential expression in the same direction (increased or decreased) in both LCM-dissected neurons and caudate homogenates from HD cases versus controls (P<0.05 for LCM and P<0.001 for caudate homogenates. Shown are the top 50 mRNA changes ranked by M in the LCM data for (non-redundant annotated probesets only, as for Table 2).
Biological processes with the highest proportions of dysregulated probe sets in HD caudate and BA4 cortex
| Brain region | Node | Number in node | Caudate | Cortex | ||||
|---|---|---|---|---|---|---|---|---|
| Changed | % | P-value | Changed | % | P-value | |||
| GO biological process | ||||||||
| Synaptic transmission | 7268 | 360 | 143 | 39.7 | 0 | 29 | 8.1 | 1.86E−07 |
| Neurogenesis | 7399 | 526 | 180 | 34.2 | 2.50E−12 | 34 | 6.5 | 2.08E−05 |
| ATP synthesis coupled proton transport | 15 986 | 58 | 34 | 59 | 5.98E−12 | 8 | 13.8 | 6.03E−04 |
| Protein amino acid phosphorylation | 6468 | 1120 | 336 | 30 | 1.17E−11 | |||
| CNS development | 7417 | 117 | 53 | 45.3 | 3.99E−10 | 13 | 11.1 | 1.05E−06 |
| Ca2+ ion transport | 6816 | 139 | 57 | 41 | 2.21E−08 | 13 | 9.4 | 3.05E−05 |
| Proton transport | 15 992 | 104 | 45 | 43.3 | 6.06E−08 | 11 | 10.6 | 1.55E−05 |
| Protein kinase C activation | 7205 | 38 | 21 | 55.2 | 3.08E−07 | |||
| Intracellular signalling cascade | 7242 | 675 | 199 | 29.6 | 6.71E−07 | |||
| Inactivation of MAPK | 188 | 29 | 17 | 58.6 | 8.21E−07 | |||
| K+ ion transport | 6813 | 255 | 87 | 34.1 | 1.00E−06 | 23 | 9 | 1.39E−07 |
| Neurotransmitter secretion | 7269 | 17 | 12 | 70.6 | 2.38E−05 | |||
| Vesicle-mediated transport | 16 192 | 69 | 29 | 42 | 2.46E−05 | |||
| Ion transport | 6811 | 341 | 105 | 30.8 | 3.03E−05 | 29 | 8.5 | 3.11E−08 |
| Muscle contraction | 6936 | 153 | 53 | 34.6 | 6.29E−05 | |||
| Regulation of G-protein coupled receptors | 8277 | 54 | 23 | 42.6 | 1.12E−04 | |||
| Neuronal differentiation | 30 182 | 10 | 8 | 80 | 1.52E−04 | |||
| Signal transduction | 7165 | 1822 | 460 | 25.2 | 1.71E−04 | |||
| Regulation of cell differentiation | 45 595 | 23 | 12 | 52.2 | 2.16E−04 | |||
| Cytokinesis | 910 | 42 | 18 | 42.9 | 4.91E−04 | |||
| Transcription from Pol III promoter | 6383 | 33 | 15 | 45.5 | 5.15E−04 | |||
| Small GTPase-mediated signal tranduction | 7264 | 407 | 116 | 28.5 | 5.55E−04 | |||
| Protein localisation | 8104 | 25 | 12 | 48 | 7.76E−04 | |||
| Peptidyl-prolyl cis–trans isomerase activity | 3755 | 83 | 30 | 36.1 | 8.05E−04 | |||
| Microtubule polymerization | 46 785 | 40 | 13 | 32.5 | 0 | |||
| Transport | 6810 | 934 | 69 | 7.4 | 6.96E−13 | |||
| Microtubule-based movement | 7018 | 82 | 14 | 17.1 | 1.30E−12 | |||
| Metabolism | 8152 | 570 | 40 | 7 | 2.67E−07 | |||
| Glycolysis | 6096 | 85 | 11 | 12.9 | 3.04E−07 | |||
| Protein transport | 15 031 | 391 | 27 | 6.9 | 2.92E−05 | |||
| Intracellular protein transport | 6886 | 314 | 23 | 7.3 | 2.95E−05 | |||
| Lipid metabolism | 6629 | 230 | 17 | 7.4 | 2.41E−04 | |||
| Glucose metabolism | 6006 | 28 | 6 | 21.4 | 2.55E−04 | |||
| Vesicle docking during endocytosis | 6904 | 21 | 5 | 23.8 | 5.04E−04 | |||
The GO database was queried as described in Methods. Only categories where P<0.001 are shown: in caudate total biological process nodes with P<0.05 was 44 in caudate and 26 in cortex.
References
The Huntington's Disease Collaborative Research Group (
Vonsattel, J.P., Myers, R.H., Stevens, T.J., Ferrante, R.J., Bird, E.D. and Richardson, E.P., Jr (
Gutekunst, C.A., Norflus, F. and Hersch, S.M. (
Tomita, H., Vawter, M.P., Walsh, D.M., Evans, S.J., Choudary, P.V., Li, J., Overman, K.M., Atz, M.E., Myers, R.M. and Jones, E.G. (
Gentleman, R., Carey, V., Bates, D., Bolstad, B., Dettling, M., Dudoit, S., Ellis, B., Gautier, L., Ge, Y., Gentry, J. et al. (
Zucker, B., Luthi-Carter, R., Kama, J.A., Dunah, A.W., Stern, E.A., Fox, J.H., Standaert, D.G., Young, A.B. and Augood, S.J. (
The Gene Ontology Consortium. (
Luthi-Carter, R., Strand, A., Peters, N.L., Solano, S.M., Hollingsworth, Z.R., Menon, A.S., Frey, A.S., Spektor, B.S., Penney, E.B., Schilling, G. et al. (
Luthi-Carter, R., Strand, A.D., Hanson, S.A., Kooperberg, C., Schilling, G., La Spada, A.R., Merry, D.E., Young, A.B., Ross, C.A., Borchelt, D.R. et al. (
Luthi-Carter, R., Hanson, S.A., Strand, A.D., Bergstrom, D.A., Chun, W., Peters, N.L., Woods, A.M., Chan, E.Y., Kooperberg, C., Krainc, D. et al. (
Edwardson, J.M., Wang, C.-T., Gong, B., Wyttenbach, A., Bai, J., Jackson, M.B., Chapman, E.R. and Morton, A.J. (
Ravikumar, B., Vacher, C., Berger, Z., Davies, J.E., Luo, S., Oroz, L.G., Scaravilli, F., Easton, D.F., Duden, R., O'Kane, C.J. et al. (
Kegel, K.B., Kim, M., Sapp, E., McIntyre, C., Castano, J.G., Aronin, N. and DiFiglia, M. (
Curtis, M.A., Penney, E.B., Pearson, J., Dragunow, M., Connor, B. and Faull, R.L.M. (
Wyttenbach, A., Carmichael, J., Swartz, J., Furlong, R.A., Narain, Y., Rankin, J. and Rubinsztein, D.C. (
Jana, N.R., Tanaka, M., Wang, G. and Nukina, N. (
Warrick, J.M., Chan, H.Y., Gray-Board, G.L., Chai, Y., Paulson, H.L. and Bonini, N.M. (
Kiehl, T.R., Olson, J.M. and Pulst, S.M. (
Chan, E.Y.W., Luthi-Carter, R., Strand, A., Solano, S.M., Hanson, S.A., DeJohn, M.M., Kooperberg, C., Chase, K.O., DiFiglia, M., Young, A.B. et al. (
Sipione, S., Rigamonti, D., Valenza, M., Zuccato, C., Conti, L., Pritchard, J., Kooperberg, C., Olson, J.M. and Cattaneo, E. (
Orr, H.T. (
Lieberman, A.P., Harmison, G., Strand, A.D., Olson, J.M. and Fischbeck, K.H. (
Xu, X.L., Olson, J.M. and Zhao, L.P. (
Rosas, H.D., Koroshetz, W.J., Chen, Y.I., Skeuse, C., Vangel, M., Cudkowicz, M.E., Caplan, K., Marek, K., Seidman, L.J., Makris, N. et al. (
Richfield, E.K., Maguire-Zeiss, K.A., Cox, C., Gilmore, J. and Voorn, P. (
Augood, S.J., Faull, R.L.M., Love, D.R. and Emson, P.C. (
Augood, S.J., Faull, R.L.M. and Emson, P.C. (
Arzberger, T., Krampfl, K., Leimgruber, S. and Weindl, A. (
Glass, M., Dragunow, M. and Faull, R.L.M. (
Reisine, T.D., Fields, J.Z., Stern, L.Z., Johnson, P.C., Bird, E.D. and Yamamura, H.I. (
Richfield, E.K., O'Brien, C.F., Eskin, T. and Shoulson, I. (
Seto-Ohshima, A., Emson, P.C., Lawson, E., Mountjoy, C.Q. and Carrasco, L.H. (
Mizuno, H., Shibayama, H., Tanaka, F., Doyu, M., Sobue, G., Iwata, H., Kobayashi, H., Yamada, K., Iwai, K., Takeuchi, T. et al. (
Caramins, M., Halliday, G., McCusker, E. and Trent, R.J. (
Turmaine, M., Raza, A., Mahal, A., Mangiarini, L., Bates, G.P. and Davies, S.W. (
Stack, E.C., Kubilus, J.K., Smith, K., Cormier, K., Del Signore, S.J., Guelin, E., Ryu, H., Hersch, S. and Ferrante, R.J. (
Zhai, Z., Jeong, H., Cui, L., Krainc, D. and Tjian, R. (
Tobin, A.J. and Signer, E.R. (
Warner, J.P., Barron, L.H. and Brock, D.J. (
Li, C., and Wong, W.H. (
Collin, F. (
Mootha, V.K., Lindgren, C.M., Eriksson, K.-F., Subramanian, A., Sihag, S., Lehar, J., Puigserver, P., Carlsson, E., Ridderstrale, M., Laurila, E. et al. (
Bolstad, B.M., Irizarry R.A., Astrand, M. and Speed, T.P. (
Irizarry, R.A., Bolstad, B.M., Collin, F., Cope, L.M., Hobbs, B. and Speed, T.P. (
Gautier, L., Cope, L., Bolstad, B.M., and Irizarry, R.A. (
