


Abstract
We examined 13 single nucleotide polymorphisms (SNPs) spanning the coding region of the µ-opioid receptor gene (OPRM1), among 382 European Americans (EAs) affected with substance dependence [alcohol dependence (AD) and/or drug dependence (DD)] and 338 EA healthy controls. These SNPs delineated two haplotype blocks. Genotype distributions for all SNPs were in Hardy–Weinberg equilibrium (HWE) in controls, but in cases, four SNPs in Block I and three SNPs in Block II showed deviation from HWE. Significant differences were found between cases and controls in allele and/or genotype frequencies for six SNPs in Block I and two SNPs in Block II. Association of SNP4 in Block I with DD (allele: P=0.004), SNP5 in Block I with AD and DD (allele: P≤0.005 for both) and two SNPs in Block II with AD (SNP11 genotype: P=0.002; SNP12 genotype: P=0.001) were significant after correction for multiple testing. Frequency distributions of haplotypes (constructed by five tag SNPs) differed significantly for cases and controls (P<0.001 for both AD and DD). Logistic regression analyses confirmed the association between OPRM1 variants and substance dependence, when sex and age of subjects and alleles, genotypes, haplotypes or diplotypes of five tag SNPs were considered. Population structure analyses excluded population stratification artifact. Additional supporting evidence for association between OPRM1 and AD was obtained in a smaller Russian sample (247 cases and 100 controls). These findings suggest that OPRM1 intronic variants play a role in susceptibility to AD and DD in populations of European ancestry.
INTRODUCTION
The µ-opioid receptor (MOR; encoded by genetic locus OPRM1) is widely distributed in the brain, and is highly expressed in the thalamus, caudate putamen and globus pallidus (1). MOR has a high affinity for β-endorphin and enkephalin but a low affinity for dynorphin (which preferentially binds to the κ-opioid receptor), and it also binds exogenous opioid drugs (e.g. morphine, heroin and methadone) with a high affinity. MORs are thought to be responsible for most opioidergic actions such as euphoria, analgesia and opiate drug withdrawal (2).
Disruption of the MOR gene (Oprm) in mice abolishes morphine-induced analgesia, place-preference activity and physical-dependence, even in the presence of intact δ- and κ-opioid receptors (DOR and KOR) (3,4). In addition, non-opioid substances, such as cocaine and alcohol, may exert some of their effects directly or indirectly by interacting with the MOR. Cocaine and ethanol each affect the function of both mesolimbic dopamine and endogenous opioid systems. They stimulate dopamine release in rat nucleus accumbens (NAc), the terminal region in the mesolimbic dopamine pathway, which is thought to be the critical brain region mediating the reinforcing effects of drugs of abuse (5). They also increase brain levels of β-endorphin, which triggers neuronal MOR to generate a reward sensation (6,7). Ethanol alone or in combination with cocaine raises MOR levels in rat brain (8). As these two systems are intimately related, altered levels or function of the MOR may in turn modulate NAc dopaminergic activity. For example, infusion of MOR agonists into the ventral tegmental area (VTA), in which the MOR is expressed, increases dopamine release into the NAc, whereas infusion of MOR antagonists decreases dopamine release (9). Furthermore, the murine MOR gene (Oprm) has been mapped close to a major quantitative trait locus (QTL) controlling morphine preference in inbred mice (10,11). Naltrexone, one of only three approved pharmacotherapies for AD, is thought to exert its actions primarily by blocking the MOR (12,13).
These observations suggest that the MOR, and therefore, potentially the OPRM1 gene, are of major importance in drug dependence and alcoholism. At least 20 studies have attempted to identify associations between OPRM1 variants and vulnerability to substance dependence. Of particular interest is a single nucleotide polymorphism (SNP) located at position 118 in exon 1 (118A/G), causing an amino acid substitution (Asn40 to Asp40) that removes a highly conserved N-glycosylation site in the extracellular domain of the protein (14,15). The MOR encoded by variant Asp40 has been reported to bind the endogenous opioid peptide β-endorphin with 3-fold greater affinity than receptors coded by variant Asn40 (15). However, three follow-up studies either failed to confirm this finding (16,17) or provided evidence for reduced receptor expression due to variant Asp40 (18). Because of its potential functional significance, SNP Asn40Asp has been intensively studied for its potential association with substance dependence phenotypes, but the results from these studies are inconclusive (19). Among the published reports, four studies demonstrated that the Asp40 allele was more prevalent among heroin or AD individuals (20–22) or was associated with a heavier drinking pattern (23), consistent with the interpretation that the Asp40 allele may cause enhanced sensitivity to the effects of alcohol or drugs of abuse. Three other studies reported opposite results, i.e. a lower frequency of the Asp40 allele in the substance-dependent group (24–26). The remaining 13 studies failed to show an association with this variant (14,15,23,27–36).
The second most commonly studied polymorphism in the OPRM1 gene is the 17C/T SNP, which is located at position 17 of exon 1 and causes an amino acid change from Ala6(C) to Val6(T). Although one study showed a trend towards an increased frequency of the Val6 allele in AD subjects (37), all other studies have shown no association (14,26,27,31,32,34). Several rare polymorphisms within the coding regions, for example, Ser147Cys in exon 2 and Ile292Val in exon 3, have also been studied, but their significance is unknown (14,30).
Two studies used haplotype-based approaches to investigate the impact of variations in OPRM1 on the risk for substance-dependence. The OPRM1 variants examined in these studies were located in the putative 5′ regulatory region (−2044C/A, −1793T/A, −1699insT, −1469T/C and −1320A/G), the 5′ untranslated region (5′ UTR) (−111C/T), and exon 1 (Ala6Val and Asn40Asp). Haplotypes composed of polymorphisms mainly in the putative transcription regulatory region were found to be weakly associated with substance dependence (28,32). Finally, Kranzler et al. (38) observed a modest association of a polymorphic (CA)n repeat in intron 1 with AD or DD.
Gene variants in the 5′ regulatory region (including the promoter region) can alter the transcription initiation site or the capacity of transcription factors to bind to the DNA sequence, and consequently, affect transcription levels. In addition, sequence variation in the 5′ UTR may result in mRNA instability or altered translational efficiency, or even different protein expression levels in different tissues. Results obtained by Hoehe et al. (28) and Luo et al. (32) may be due to the fact that the polymorphisms examined are within the 5′ region of the OPRM1 gene. A more difficult question is how to interpret the contradictory results of the most-studied SNP, Asn40Asp. As noted earlier, although SNP Asn40Asp is very likely a functional polymorphism, most previous studies do not support its role as a risk locus for substance dependence. The conflicting results could be due to any of several possible explanations, including inadequate statistical power, genetic heterogeneity or admixture within the population groups studied. Indeed, the frequency of the Asp40 allele varied from as low as 0.047 in African Americans (AAs) and 0.154 in European Americans (EAs), and was as high as 0.485 in those of Asian descent (27). Nevertheless, these explanations are still not sufficient, as some of the previous studies were conducted in large samples and subjects were from relatively homogeneous population groups. The frequently negative but occasionally positive findings from SNP Asn40Asp raise another possibility: Asn40Asp, although a clearly functional variant with relevant physiological effects (39), may be in linkage disequilibrium (LD) with an additional risk locus that has a greater effect on disease susceptibility. Such LD could plausibly vary by population, as well. Exonic variants in OPRM1 have already been vigorously examined. Except for the Asn40Asp and Ala6Val SNPs in exon 1, other exonic variants are not sufficiently polymorphic to account for a substantial proportion of disease risk on the population level (14,28). As a consequence, our attention was drawn to gene variants within introns, which may serve as binding sites for transcriptional enhancers or inhibitory factors that may be located in introns or other non-coding regions. Even a SNP variant may greatly change the affinity of these transcriptional regulatory factors for the intronic DNA sequence and directly alter mRNA levels (40). In fact, Shi et al. (30) investigated an OPRM1 SNP in intron 2 (IVS2+31G→A) in 232 Han Chinese heroin addicts and found that heterozygous subjects (A/G) reported greater heroin intake than did GG homozygotes. The mechanism for this finding is unknown.
In addition, intronic sequence can be involved in alternative DNA splicing. To date, nine human OPRM1 splice variants have been identified (41–43). They contain the same exons 1, 2 and 3 as the original human OPRM1, which normally has four exons. However, they differ from this sequence and from each other by splicing downstream from exon 3. All splice variants result in amino acid sequence changes in the C-terminus of the MOR and may affect the activity (e.g. phosphorylation and internalization) of the receptor.
Most OPRM1 variants have not previously been examined for association with AD or DD, possibly because attention has been firmly focused on the ‘functional’ exon 1 variant discussed earlier. We hypothesized that the variants located 3′ to the exon 1 variants might influence susceptibility to substance dependence. If any such variants were found to be in LD with SNP Asn40Asp, they could also account, in part, for previously reported findings.
We examined the association of alleles, genotypes, haplotypes and diplotypes of 13 SNPs covering the coding region of OPRM1 (Fig. 1) with substance dependence [including AD and DD (cocaine and opioid)] in a large EA case-control sample. Furthermore, 37 ancestry informative markers (AIMs), which can efficiently distinguish the ancestry of major American populations (44,45), were genotyped in all EA subjects, and were used to evaluate the potential for spurious association resulting from population stratification and admixture effects. Finally, replication of the findings obtained in the EA sample was sought in a smaller Russian sample consisting of alcohol-dependent and control subjects.
RESULTS
Hardy–Weinberg equilibrium (HWE) tests and haplotype blocks
HWE tests were performed using the program HWSIM (46) with 10 000 simulations. The genotype frequency distributions of the 13 OPRM1 SNPs were in HWE in all EA control subjects, but those of seven SNPs (SNPs 2–5 in intron 1 and SNPs 10–12 in intron 3) were in Hardy–Weinberg disequilibrium (HWD) (two-tailed P<0.05) in EAs with AD and/or DD.
LD analyses of our EA case and control subjects using the program Haploview (47) showed that the 13 SNPs were located in two separate haplotype blocks (Fig. 2). SNPs 1–7 (SNP1 in exon 1 and SNP2–7 in intron 1) were in Block I and SNPs 8–13 (SNP8 in intron 2, SNP9–12 in intron 3 and SNP13 in the downstream region) were in Block II. The LD patterns of the 13 SNPs in the EA cases were very similar to those of the EA controls.
Association of OPRM1 SNPs and substance dependence
The allele and genotype frequencies of the 13 SNPs in EA cases and controls are listed in Table 1A and 1B. Comparison of genotype frequency distributions and allele frequencies revealed significant differences between AD and/or DD cases and normal controls for six SNPs in Block I (SNPs 2–7 in intron 1) and two SNPs (SNPs 11 and 12 in intron 3) in Block II. The minor alleles of six SNPs (SNPs 2–7) in Block I occurred significantly more frequently in AD and/or DD subjects than in normal controls (P<0.05 in all cases). In contrast, the minor alleles of two SNPs (SNPs 11 and 12) in Block II were significantly less frequent in AD and/or DD cases than in normal controls (both P<0.05). The significance threshold P-value was set at 0.005 by the program SNPSpD (48) for both AD and DD multi-locus case-control studies. The association of SNP4 (rs3823010) in intron 1 with DD (allele: P=0.004), SNP5 (rs495491) in intron 1 with both AD and DD (allele: P=0.005 and 0.004, respectively) and two SNPs in intron 3 with AD [SNP11 (rs609148) genotype: P=0.002; SNP12 (rs648893) genotype: P=0.001] remained significant after correction for multiple testing. In addition, when the DD cohort was analyzed as separate (and partially overlapping) cocaine- and opioid-dependent subgroups (CD and OD), the results tended to be more statistically significant for the OD sample, although its size was small. P-values for both allele-wise and genotype-wise association analyses are summarized in Figure 3.
To confirm the major findings, two SNPs in each haplotype block, SNP4 (rs3823010) and SNP5 (rs495491) (in Block I), and SNP11 (rs609148) and SNP12 (rs648893) (in Block II), were genotyped in the sample of Russian AD and control subjects. Genotype frequency distributions of the four markers were in HWE in both Russian cases and controls. As in EA samples, SNP4 and SNP5 were located in the OPRM1 haplotype Block I (D′=1.000 for both Russian cases and controls) and SNP11 and SNP12 were located in the haplotype Block II (D′=1.000 for both Russian cases and controls). As can be seen in Table 1C, the minor allele (C-allele) of SNP5 (rs495491) was significantly more common in cases than in controls (χ2=5.15, df=1, P=0.023), and SNP5 C/C homozygotes were twice as common in Russian cases (11.6%) as in Russian controls (5.1%) (χ2=5.01, df=2, P=0.081). Although no significant results were found for SNPs 4, 11 and 12, as for EA samples, the minor allele of SNP4 tended to be more frequent in Russian cases (19.6%) than in Russian controls (16.7%), but the minor allele of SNP11 and SNP12 tended to be less frequent in Russian cases (24.9 and 25.4%, respectively) than in Russian controls (27.8 and 29.9%, respectively).
Selection of five tag SNPs and haplotype association with substance dependence
Because the 13 OPRM1 SNPs studied were located in two haplotype blocks, we used the Tagger function in the program Haploview to select a comparatively non-redundant set of SNPs (i.e. tag SNPs) that could predict other SNP markers. Three SNPs in Block I (SNPs 1, 4 and 5) and two SNPs in Block II (SNPs 11 and 12), which capture most of the allelic diversity of the 13 OPRM1 SNPs, were selected for haplotype analysis.
Estimation of haplotype frequencies and comparison of haplotype frequency distributions between cases and controls were conducted using the program PHASE (49). As shown in Table 2, there was a significant difference between EA cases and controls (EA–AD versus EA–Con: overall P=5×10⁻⁵; EA–DD versus EA–Con: overall P=2.5×10⁻⁴). In this population, the haplotype AGTTC, which contains major alleles of SNPs 4 and 5 in Block I and minor alleles of SNPs 11 and 12 in Block II, was significantly more common in controls than in cases [AGTTC versus all other haplotypes: χ2=4.36, df=1, P=0.037 (AD); χ2=9.63, df=1, P=0.002 (DD)]. In contrast, the counterpart haplotype AACCT, containing minor alleles of SNPs 4 and 5 in Block I and major alleles of SNPs 11 and 12 in Block II, was significantly more common in EA cases than in EA controls [AACCT versus all other haplotypes: χ2=5.54, df=1, P=0.019 (AD); χ2=6.93, df=1, P=0.008 (DD)] (note that the common ‘A’ allele at SNP1 was present in both). When the frequency distributions of haplotypes constructed from SNPs 4 and 5 in Block I and SNPs 11 and 12 in Block II were compared for Russian AD cases and controls, no significant difference was found (overall P=0.153). However, haplotype GTTC, comprising the major alleles of SNPs 4 and 5 in Block I and the minor alleles of SNPs 11 and 12 in Block II, was more frequent in Russian controls (27.4%) than in Russian cases (22.5%). Although, this did not reach significance, the finding in the Russian samples was in the same direction as that in the EA samples. Similarly, there was a non-significant trend for the counterpart haplotype ACCT (consisting of the minor alleles of SNPs 4 and 5 in Block I and the major alleles of SNPs 11 and 12 in Block II) to be more frequent in Russian cases (17.2%) than in Russian controls (14.6%). However, the difference in frequency of the two haplotypes, GTTC and ACCT, in Russian cases and controls did not approach significance (haplotype GTTC: χ2=1.71, df=1, P=0.191; haplotype GTTC: χ2=0.57, df=1, P=0.448).
Population stratification excluded
Population structure analyses revealed that all 720 of the self-reported EA subjects (382 cases and 338 controls) were ‘genetic’ EAs, with the average European ancestry being 0.987±0.033 (mean±SD). In these 720 ‘genetic’ EA subjects, the total estimated weight of African ancestry proportion was 9.661, i.e. the degree of admixture of the ‘genetic’ EAs in this study was 1.3% (9.661/734). The proportion of European ancestry for subjects exceeded 0.9 for all but 10 EA cases and five EA controls, for whom this proportion varied from 0.5 to 0.9. The low degree of admixture in the EA samples indicated that population structure did not exert a substantial effect on this EA case-control study. To investigate further whether a difference in European ancestry proportions between the EA cases and controls could compromise the association result, the potential of stratification for our sample was evaluated using the program STRAT (and the ancestry proportions from STRUCTURE), which implements the method described in Pritchard and Rosenberg (50). No significant difference in European ancestry proportions was found between EA cases and controls (∑χ2=278.378, df=83, P=ns). Therefore, the positive association result obtained in the EA case-control analysis was unlikely to be due to population admixture. In addition, as expected, based on the known non-African origin of the Russian population, the frequency of the FY(−) polymorphism was very low in the Russian samples (frequency <0.0025) (51).
Regression analysis: OPRM1 alleles, genotypes, haplotypes and diplotypes affect risk for substance dependence
As shown in the online Supplement 1, significant differences in sex and age between EA cases and controls were observed (P-values <0.001 for both variables). Thus, we tested whether the association between OPRM1 variants (five tag SNPs, i.e. SNPs 1, 4, 5, 11 and 12) and substance dependence was attributable to differences in age- and/or sex-related penetrance. Backward stepwise logistic regression analysis showed that SNP5 (rs495491) in Block I and SNP11 (rs609148) in Block II were associated with AD and DD, when the sex and age information of subjects was taken into consideration. Specifically, the minor allele (C-allele) of SNP5 was a risk factor for both AD [β=0.77, P=0.045, odds ratio (OR)=2.17] and DD (β=0.69, P=0.048, OR=2.00) and it exerted its effect on susceptibility to AD and DD via a recessive mode of action. In other words, subjects homozygous for the SNP5 C-allele had 2.17 and 2.00 times of risk to be affected with AD and DD, respectively, compared with the SNP5 T-allele. In contrast, the minor allele (T-allele) of SNP11 was a protective allele for both AD (β=−0.50, P=0.032, OR=0.60) and DD (β=−0.56, P=0.019, OR=0.57) consistent with a dominant mode of action. Thus, the presence of the SNP11 T-allele reduced the risk of AD and DD by 0.40 and 0.43, respectively. Although the SNP11 T-allele also showed a protective role for DD in an additive model of inheritance (β=−0.81, P=0.040, OR=0.44, as demonstrated by the results of the allele regression analysis or Model 1), the results were less significant than those obtained with a dominant mode of action for DD (P=0.019). Thus, the SNP11 T-allele is more likely to play a protective role for DD via a dominant mode of action.
Haplotype and diplotype trend regression (DTR) analysis also showed an association between OPRM1 variants and substance dependence. The aforementioned haplotype AGTTC, which contained the major alleles of SNPs 4 and 5 and the minor alleles of SNPs 11 and 12 and which was significantly more frequent in EA controls than in EA cases, was protective for AD (β=−1.01, P=0.011, OR=0.37) and DD (β=−1.37, P=0.002, OR=0.26). Furthermore, two diplotypes containing the haplotype AGTTC showed a protective effect for both AD (AGTCT/AGTTC: β=−0.68, P=0.046, OR=0.51; AGTTC/AGCCT: β=−1.51, P=0.009, OR=0.22) and DD (AGTCT/AGTTC: β=−0.74, P=0.030, OR=0.48; AGTTC/AGCCT: β=−1.63, P=0.011, OR=0.20). When we performed forward logistic regression analysis, the results were consistent with the results obtained using the backward stepwise method.
DISCUSSION
The aim of this study was to explore whether genetic variation at the OPRM1 locus is a risk factor for AD and/or DD. While there have been numerous previous studies of specific variants (generally relatively uninformative ones, mapping either 5′ to the locus or in exon 1), this is, to our knowledge, the first attempt to evaluate a series of markers spanning the coding sequence of the locus; also, no previous study has, to our knowledge, considered informative markers that map 3′ to exon 1. We previously tested the association of the two most commonly studied OPRM variants, Ala6Val and Asn40Asp (located in exon 1), with substance dependence [(27) sample expanded in the present study]. However, as for most previous studies, allelic association analyses were not significant. Thus, we focused our effort on informative markers 3′ to this region, which are located in OPRM1 introns.
First, HWE analyses demonstrated that OPRM1 intronic SNPs affected risk for AD and/or DD. This approach tests whether genotype frequencies at a locus in a test group reflect an equilibrium state, which should occur (in the absence of an effect on phenotype), assuming no overlapping generations, a large sample size with random mating, no mutation, no migration and no selection. A genotype distribution that is not in HWE (i.e. is in HWD) in a case group may suggest an association between this locus and the disease studied (52). HWD tests have been applied in fine-scale mapping of mutations responsible for diseases (52–54). Here, we found that the genotypic distributions of four intronic SNPs in Block I (SNPs 2–5) and three intronic SNPs in Block II (SNPs 10–12) were in HWD in substance dependent EA subjects (P<0.05). When the EA case subjects were divided by the substance of dependence, SNPs 2–5 in Block I and SNPs 11 and 12 in Block II were still in HWD in EA subjects with AD, and SNPs 4 and 5 in Block I and SNP10 in Block II were still in HWD in EA subjects with DD. These HWDs suggest that there may be associations between these markers and diseases.
Although HWD can indicate a valid disease-locus association, two primary alternative explanations, genotyping error and population admixture, must be considered (55,56). In this study, genotyping quality was controlled by genotyping DNA samples in duplicate analysis, which indicated a low genotyping error rate (see ‘Genotyping’ below). In addition, the influence of some other systematic flaws can be excluded as all selected SNPs were in HWE in EA control samples. Moreover, Leal (57) reported that if multiple markers that are in LD are not in HWE, genetic factors rather than genotyping errors would be the expected origin of the violation of HWE. Therefore, HWD in our cases was unlikely to be due to genotyping errors. As discussed below, it is also unlikely that population admixture resulted in HWD in our EA cases.
Second, results from linkage disequilibrium (LD) analyses suggested that SNPs within intron 1 might confer vulnerability to AD and/or DD. SNP Asn40Asp, located in exon 1, has been the most commonly studied variant in the OPRM1 gene because of its potential functional effects. However, the conflicting results regarding this marker prompted us to assume that another locus influencing the risk to AD and DD might exist elsewhere in OPRM1 and be in substantial LD with this marker. We used high-density SNP LD mapping (average distance between SNPs ∼6000 bp) to examine this hypothesis. LD analyses of the OPRM1 SNP markers in our substance-dependent EA cases showed that SNP Asn40Asp was in the same haplotype block as six SNPs within intron 1. In particular, pair-wise LD analyses showed that SNP Asn40Asp was in complete LD (D′=1.000) with four of the six intronic SNP markers in Block I (SNPs 3, 4, 6 and 7) in EA subjects with AD. In EA subjects with DD, SNP Asn40Asp was in complete LD (D′=1.000) with five intronic SNPs in Block I (SNPs 3–7). Thus, prior positive results with Asn40Asp may be attributable in part to LD with other functional variants. This could help us explain the observed variability in association findings with that marker, as LD relationships would be expected to vary more between populations than do functional effects.
Third, allele-wise and genotype-wise analyses confirmed the association between OPRM1 intronic markers and AD and/or DD. We observed significant differences between substance-dependent EA cases and controls in allele and/or genotype frequency distributions of six intronic SNPs in Block I and two intronic SNPs in Block II. As 13 OPRM1 SNP markers were included in the association analysis, significant adjustment for multiple testing was necessary. As the 13 OPRM1 SNP markers were located in two separate haplotype blocks and strong LD between SNPs was observed in each LD block, we used the program SNPSpD (48) as an alternative to the standard Bonferroni method to correct for multiple comparisons. This program takes marker LD into consideration and generates an experiment-wide significance threshold to keep Type I error (or false positive disease association) less than 0.05. After correction by the latter method (significant threshold P-value was set at 0.005), association results for SNPs 4 and 5 in Block I and SNPs 11 and 12 in Block II remained significant. In addition, analysis of four OPRM1 SNP markers (SNPs 4, 5, 11 and 12) in a Russian AD replication sample generally supported the above findings. The modest significance levels obtained in the Russian population may be attributable to the comparatively smaller number of Russian control subjects.
Fourth, haplotype-based analyses also supported the association between OPRM1 variants and substance dependence. As strong LD was observed for the SNPs in the two haplotype blocks, including all the 13 SNPs in haplotype analysis could substantially dilute the haplotype association results because of redundancy in the genotype information for some of the markers. A number of studies have demonstrated that regions of high LD display low haplotype diversity (58–60). This implies that common haplotypes can be efficiently tagged using tag SNPs derived from a subset of the common variants. Therefore, to avoid the inclusion of redundant genotype information for haplotype analysis, using the program Haploview Tagger (with r2 set at 0.8, as SNPs with shared variance of r2=0.8 can be considered somewhat redundant), we identified three tag SNPs in Block I (SNPs 1, 4 and 5) and two tag SNPs in Block II (SNPs 11 and 12).
As more than half of the tested markers were not in HWE in the EA cases, the program PHASE was applied to estimate haplotype frequencies for both EA cases and controls. This program is based on the Bayesian statistical method and the Partition Ligation algorithm. Even if HWE is violated, the program PHASE can still be used for reconstructing haplotypes from the genotype data and for accurately estimating haplotype frequencies (49). In this study, we found significant associations between the five tag SNP haplotypes and AD and DD in EA subjects. Moreover, the haplotype results are consistent with those from allelic association analysis, i.e. haplotype AGTTC, containing major alleles of SNPs 4 and 5 in block I and minor alleles of SNPs 11 and 12 in Block II, was significantly more common in EA controls than in EA cases, while haplotype AACCT, containing minor allele of SNPs 4 and 5 in Block I and major alleles of SNPs 11 and 12 in Block II, was significantly more common in EA cases than in EA controls. In addition, haplotype association analysis results from the Russian samples supported this conclusion.
Fifth, population admixture (in this sample of European ancestry) was excluded as an explanation for the above findings through the application of a set of AIMs. Based on the genotype data of the 37 AIMs analyzed using the program STRUCTURE, all self-reported EA subjects could be assigned to a ‘genetic’ EA population group. This is in agreement with our own previous observations (45,61) and with the findings by Tang et al. (62) that genetic clustering for several groups, including EAs, corresponds very closely to self-identified race. In our EA cases and controls, although no individual had EA ancestry proportion as high as 1.0, the degree of admixture was very low (the average admixture degree being only 1.3%). In addition, the ancestry proportions of our EA cases were not significantly different from those of our EA controls when analyzed using the program STRAT. Therefore, there was minimal potential for Type I errors to result from population stratification.
Finally, logistic regression analyses confirmed the association between OPRM1 gene variants and AD and/or DD. To reduce the heterogeneity that may confound case-control studies, ideally, the sex and age of cases and controls should be matched. However, in this study, the EA cases and controls differed significantly on these variables. Hence, we used the backward stepwise logistic regression analysis to control for these differences statistically. This method uses the χ2 statistic to identify variables to be removed from the model; the covariates remaining in the final regression model contributed most to the difference between cases and controls. By this method, we found that the minor allele of SNP5 (rs495491) in Block I was a risk allele for AD and DD via a recessive mode of action, whereas the minor allele of SNP11 (rs609148) in Block II was a protective allele with respect to AD and DD, exerting a dominant effect. These results were in agreement with the findings by allelic association analyses that the minor alleles of several SNPs (including SNP5) in Block I were significantly more frequent, whereas the minor alleles of two SNPs (including SNP11) in Block II were significantly less frequent, in cases than in controls. In logistic regression analysis, as covariates were included in a single model with allele, genotype, haplotype or diplotype data, concern over multiple testing is reduced. In the Russian samples, as both case and control subjects were male and matched on age, regression analysis was not performed.
Haplotype regression analysis also supported the findings of haplotype association analysis, i.e. a specific haplotype AGTTC, which harbored major alleles of SNPs 4 and 5 and minor alleles of SNPs 11 and 12, protected against AD and DD. In addition, we performed the DTR analysis to verify the finding from individual marker or haplotype analysis. Luo et al. (52,63) have reported that DTR might be a more powerful approach than haplotype analysis because it provides more information about the gene and its association with a disease. By DTR, we found that two diplotypes, harboring the specific haplotype AGTTC, contributed to the protection against risk for AD and DD. This suggests that interaction of a number of OPRM1 variants affecting expression (including Asn40Asp) could confer variable liability to substance dependence. However, we did not observe a greater protective role for the diplotype homozygous for haplotype AGTTC, despite a frequency of approximately 6%. In addition, as diplotypes with frequency less than 0.01 were omitted (i.e. 259/1207=21.4% of haplotypes or diplotypes were discarded), we cannot exclude the possibility that certain rare diplotypes or haplotypes may confer vulnerability to substance dependence.
Although our AD sample was substantially larger than our DD sample, in most cases, we observed statistically stronger evidence of association for DD than for AD for SNPs from haplotype block I (Table 1A). This suggests that OPRM1 Block I genetic variation is a more important predisposing factor for DD than for AD. In contrast, the opposite pattern existed for SNPs in Block II (Table 1B). We infer from these patterns that there may be two distinct coding region risk loci mapped to OPRM1, one of which is more important for DD risk (mapped to the 5′ haplotype block, Block I), and one that is more important for AD risk (mapped to the 3′ haplotype block, Block II). In addition, the data hint at a possible difference in mode of action for these distinct loci, with the Block I locus data more consistent with an allele-wise (recessive) effect and the Block II data more consistent with a genotype-wise (dominant) effect. One possible explanation for this observation is that the Block I and Block II variants could act by different functional mechanisms, one of which is more relevant to DD, and the other, to AD, but it is also possible that this apparent difference is a chance finding. We predicted that the association would be strongest for opioid-dependent subjects, because of the direct interaction of opioids with the MOR. Further association analysis was consistent with this prediction (Table 1A and 1B), although the sample size for OD was small. This apparent difference is easy to understand in the context of OD and CD pathophysiology; direct opioidergic mechanisms might reasonably be more important for OD than for CD.
In conclusion, the present study showed that multiple intronic SNPs in OPRM1 may increase risk for substance dependence in the EA and Russian populations. These data are consistent with the interpretation that there are at least two bi-allelic risk variants at the OPRM1 locus, one mapping to the haplotype Block I, and the other, to the haplotype Block II. In particular, SNPs located in intron 1, which are in close LD with the most frequently studied SNP Asn40Asp, and SNPs in intron 3, which may be involved in alternative gene splicing or transcription regulation, are worthy of further investigation. It would be of great interest to determine if a significant association of substance dependence with OPRM1 gene variants can be detected in other population groups (e.g. African-Americans). Furthermore, it will be important to examine the potential functional effects of these variants, to establish a mechanism by which they increase or decrease an individual's susceptibility to substance dependence.
MATERIALS AND METHODS
Subjects
All subjects provided informed, written consents to participate in this study, which was approved by the relevant institutional review boards. We recruited 382 EA subjects meeting the DSM-III-R (American Psychiatric Association, 1987) or DSM-IV (American Psychiatric Association, 1994) criteria for a lifetime diagnosis of AD and/or DD (cocaine or opioid). Among them, 318 were affected with AD and 199 were affected with DD, including 171 with CD and 91 with OD. Of the AD–EA subjects, 42.2% (n=135) had comorbid DD, whereas more than half of the DD–EA subjects (n=135 or 67.9%) had comorbid AD. Of the 382 cases, 287 (75.1%) were male and 95 (24.9%) were female. Subjects' average age was 40.1±9.6 (mean±SD) (one subject with age information unknown). Three hundred and thirty-eight EA control subjects were screened using the Structured Clinical Interview for DSM-III-R (SCID), the Computerized Diagnostic Interview Schedule for DSM-III-R (C-DIS-R) or the Schedule for Affective Disorders and Schizophrenia-Lifetime Version (SADS-L) (64) to exclude major Axis I disorders, including substance dependence, psychotic disorders (including schizophrenia), major mood disorders and major anxiety disorders. Among them, 141 (41.7%) were male and 197 (58.3%) were female. The average age was 27.2±7.9 (mean±SD) for the 330 EA control subjects whose age was available. The EA case and control subjects were recruited at either the University of Connecticut Health Center or the VA Connecticut Healthcare System, West Haven Campus.
In addition, 247 male Russian subjects with AD and 100 male Russian control subjects were recruited. The method for diagnosis and recruitment has been described earlier by Lappalainen et al. (51). All AD Russian subjects were recruited at the Leningrad Regional Center of Addictions (LRCA) affiliated with St Petersburg State Pavlov Medical University. The standard treatment program in LRCA consists of three phases: inpatient detoxification (7–10 days), inpatient rehabilitation (3–4 weeks) and follow-up care at an outpatient psychiatric office or health center. Psychiatric interviews of the participants were conducted during the inpatient rehabilitation phase. An ICD-10 (International Classification of Diseases, version 10) diagnosis of AD was established through clinical interviews by a research psychiatrist. Individuals with primary psychotic disorders were excluded. Ten percent of the participants fulfilled the diagnostic criteria for lifetime or current drug abuse or dependence. These participants had been hospitalized for treatment of AD before the current episode for a median of two times. The participants reported in unstructured interviews having an average age of onset of drinking of 16 years (SD=3) and an average age of onset of heavy drinking (alcohol abuse) of 23 years (SD=5). Family history of alcoholism in a first-degree relative was reported by 45% of the participants. The control group was composed of military personnel of the local subdivision who participated in an epidemiological study of cardiac disease. The participants were screened using non-structured clinical interview to exclude the presence of psychiatric and substance use disorders at the time of recruitment for the study. The average age of Russian cases was 40.0±10 (mean±SD) and for Russian controls, it was 40.0±5 (mean±SD).
Genotyping
Thirteen SNPs at the OPRM1 locus were selected from the dbSNP database (http://www.ncbi.nlm.nih.gov/SNP/) of the National Center for Biotechnology Information (NCBI) (designated by rs#) or from the Applied Biosystems SNP database (http://www.appliedbiosystems.com/). These markers cover 80 045 bp of the OPRM1 coding region with an average intermarker spacing of 6157 bp (Fig. 1). SNP1 (or the most commonly studied SNP Asn40Asp), is in exon 1; SNPs 2–7 are in intron 1; SNP8 is in intron 2; SNPs 9–12 are in intron 3; SNP13 is in the downstream region of the OPRM1 gene. The heterozygosity of these markers in the NCBI SNP database ranges from 0.101 to 0.499.
SNP Asn40Asp was genotyped by a restriction fragment length polymorphism (RFLP) genotyping method (27). All other SNPs were genotyped using the TaqMan assay in a 384-well microplate format. Briefly, 1 ng of DNA was amplified in a final volume of 2 µl containing 0.05 µl of 20× (or 0.025 µl of 40×) MGB probes and primers, 1 µl of 2× TaqMan Universal PCR Master Mix, and 0.004 µl of 100× BSA (New England Biolabs Inc., Beverly, MA). Amplification conditions were 95°C for 10 min, followed by 60 cycles of 92°C for 15 s and 60°C for 1 min. Allelic discrimination was performed using the ABI PRISM® 7900 Sequence Detection System (Applied Biosystems Inc., Foster City, CA, USA). SNPs genotyped by the Taqman technique were assayed in duplicate and discordant genotypes were discarded. The genotype discordant (i.e. non-matching) rate was <0.5% for both case and control samples. For SNPs genotyped by PCR-RFLPs, 8% of samples were re-genotyped as a quality check, with complete concordance.
For population admixture analysis, 37 AIMs described by Yang et al. (44) and Luo et al. (45) were genotyped in all the EA case and control subjects. In the Russian sample, we only genotyped the FY (+/−) SNP, which is the most informative of the AIMs in terms of differentiating European and African populations. Some of the genotypes for the exon I variants were included in our earlier reports (27), as were most of the AIM markers (52).
HWE and LD analysis
Deviation from HWE was assessed using the HWSIM program (46). P-values (two-tailed) were estimated empirically through use of Monte Carlo simulations (10 000 iterations) based on observed genotype frequency. Significance levels were determined as the proportion of times the simulated distribution reached or exceeded the observed deviation from HWE. The program Haploview 3.2 (47) was used to compute pair-wise LD statistics. Standardized LD coefficients (D′=D/Dmax, proportion of observed LD out of maximum possible LD) for all SNP pairs were plotted. Haplotype blocks (segments of strong LD within which there is little evidence for ancestral recombination events) were defined according to the criteria of Gabriel et al. (65).
Allelic association study
The program PowerMarker 3.0 (66) was applied in calculating marker allele and genotype frequencies, as well as testing for association between OPRM1 SNP markers and substance dependence through the single-locus case control test function in this program package. To avoid the possibility of false-positive results (i.e. Type I errors), the significance of multi-locus association studies was corrected for multiple comparisons. The program SNPSpD (i.e. the SNP spectral decomposition approach) described by Nyholt (48) was used to generate the experiment-wide significance threshold required to keep Type I error rate below 5%, taking into account the redundancy of information provided by SNPs which were in LD.
Tag SNP selection and haplotype analysis
To avoid over-fitting and unbounded haplotype tests in the association analysis, the program Tagger implemented in Haploview 3.2 (47) was applied to select the tag SNPs that could efficiently capture common genetic variation in the OPRM1 region. Selection of tag SNPs is based on r2, the proportion of total variation in one SNP being explained by another SNP. A stringent r2 threshold (r2>0.8) would allow the selection of a set of tag SNPs to resolve more than 80% of all existing haplotypes (58).
The possible association of OPRM1 haplotypes (constructed by alleles of the tag SNPs) with substance dependence was analyzed through the program PHASE 2.1 (49). The advantage of the algorithm used by PHASE over the Expectation–Maximization (EM) algorithm is its ability to construct valid haplotypes even when the assumptions of HWE are violated (67). PHASE not only estimates the probabilities of all likely pairs of haplotypes (i.e. diplotypes) for each subject from genotype data, but it also provides the overall estimated haplotype frequency distributions in the whole sample. To produce reliable probability estimates, we performed 10 000 iterations of each run. In addition, PHASE was used to perform a permutation test for significant differences in haplotype frequencies between cases and controls. The number of permutation was set to 20 000.
Population structure analysis
We used the method of Pritchard and Rosenberg (50) to assess the possibility of population stratification in our EA case and control subjects. The ancestry proportion for each EA subject was estimated by the program STRUCTURE 2.1 (68) based on the genotype data of the 37 AIMs. Simulation parameters were set to 100 000 burn-ins followed by 100 000 runs and K was set to 2. The Pritchard and Rosenberg stratification test statistic was computed with STRAT software (69) with the output statistic (i.e. the ancestry proportions of EA cases and controls) generated by the program STRUCTURE as the input file.
Regression analysis
Potential confounding effects due to sex and age differences between cases and controls may occur. Therefore, a backward stepwise logistic regression method described by Luo et al. (63) was performed, with the diagnosis as the dependent variable, and the sex and age of subjects and alleles, genotypes, haplotypes or diplotypes as the independent variables. For allele data, only the information of the minor allele from each SNP was entered in the regression model. Minor alleles were coded as 1, 0.5 or 0, respectively, for the minor allele homozygote, the heterozygote or the major allele homozygote. In the genotype regression model, we analyzed three modes of inheritance. For recessive inheritance, genotypes were coded as 1 (the minor allele homozygote) or 0 (heterozygous or homozygous for the major allele). For dominant inheritance, genotypes were coded as 1 (heterozygous or homozygous for the minor allele) or 0 (the major allele homozygote). For additive inheritance, genotypes were coded as 1 (the minor allele homozygote), 0.5 (the heterozygote) or 0 (the major allele homozygote). In fact, the results generated by the additive mode of inheritance would be the same as those obtained from allele regression analysis. Haplotype or diplotype probabilities obtained by the PHASE program were entered in the haplotype or DTR model. Rare haplotypes or diplotypes with population frequencies less than 0.01 were omitted. In the regression analyses, only the sex of subjects was used as a categorical variable; all other variables were numerical. Regression analyses were conducted using the program SPSS 13.0 for Windows (SPSS Inc., Chicago, IL, USA).
SUPPLEMENTARY MATERIAL
Supplementary Material is available at HMG Online.
ACKNOWLEDGEMENTS
We appreciate excellent technical assistance from Ann Marie Lacobelle and Greg Kay. This work was supported in part by funds from the U.S. Department of Veterans Affairs [the National Center for PTSD Research, the VA Medical Research Program and the VA Connecticut-Massachusetts Mental Illness Research, Education and Clinical Center (MIRECC), and the VA Research Enhancement Award Program (REAP)], the National Institute on Drug Abuse (R01-DA12849, R01-DA12690 and K24-DA15105), the National Institute on Alcohol Abuse and Alcoholism (R01-AA11330, P50 AA12870, K08-AA13732 and K24-AA13736) and the National Center for Research Resources (M01-RR06192; University of Connecticut General Clinical Research Center).
Conflict of Interest statement. None declared.
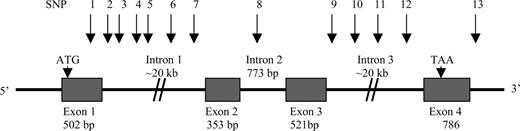
Figure 1. The human µ-opioid receptor gene (OPRM1) structure and 13 SNP variants. SNP1 (rs1799971, 118A/G or Asn40Asp), SNP2 (rs511435, A/G), SNP3 (rs524731, A/C), SNP4 (rs3823010, A/G), SNP5 (rs495491, C/T), SNP6 (rs1381376, A/G), SNP7 (rs3778156, A/G), SNP8 (rs2075572, C/G), SNP9 (rs548646, C/T), SNP10 (rs9322447, A/G), SNP11 (rs609148, C/T), SNP12 (rs648893, C/T), SNP13 (rs671531, A/G).
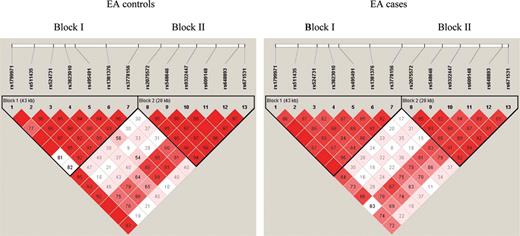
Figure 2. Linkage disequilibrium (LD) plot of 13 OPRM1 SNPs in EA cases with substance (alcohol and/or drug) dependence (right) and controls (left). The D′ value corresponding to each SNP pair is displayed in the square. The numbers in the squares are D′ ×100. Empty squares meant D′=1 (i.e. complete LD between two SNPs). Squares are colored bright red if the D′ value is high (i.e. LD is strong) and the confidence in the value of D′ is high as well.
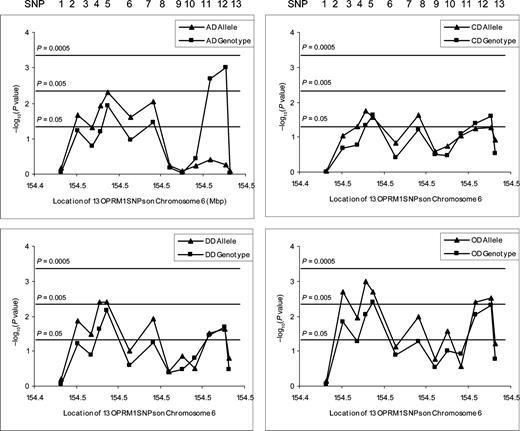
Figure 3. Association significance (denoted as −log10P-value) of 13 OPRM1 SNPs in AD, DD, CD and OD is plotted against the position of SNPs on Chromosome 6. Allele-wise P-values for AD, DD, CD and OD were designated by triangles, respectively. Genotype-wise P-values for AD, DD, CD and OD were squares, respectively. (Note that the AD and DD groups overlap, and the DD group, further, contains the OD and CD groups.)
Comparison of allele and genotype frequencies of seven OPRM1 SNPs (SNP1–7 in Block I) between EA cases and controls
| SNP ID | Allele/genotype | EA–Con (n=338) | EA–AD (n=318) | P-value | EA–DD (n=199) | P-value | EA–CD (n=171) | P-value | EA–OD (n=91) | P-value |
|---|---|---|---|---|---|---|---|---|---|---|
| SNP1 | A | 0.871 | 0.880 | 0.650 | 0.882 | 0.612 | 0.874 | 0.921 | 0.869 | 0.723 |
| G | 0.129 | 0.120 | 0.118 | 0.126 | 0.131 | |||||
| A/A | 0.756 | 0.772 | 0.889 | 0.775 | 0.874 | 0.759 | 0.991 | 0.761 | 0.900 | |
| A/G | 0.231 | 0.215 | 0.215 | 0.229 | 0.216 | |||||
| G/G | 0.013 | 0.013 | 0.010 | 0.012 | 0.023 | |||||
| SNP2 | A | 0.208 | 0.263 | 0.021 | 0.276 | 0.014 | 0.256 | 0.089 | 0.302 | 0.002 |
| G | 0.792 | 0.737 | 0.724 | 0.744 | 0.698 | |||||
| A/A | 0.060 | 0.110 | 0.060 | 0.109 | 0.060 | 0.101 | 0.214 | 0.116 | 0.015 | |
| A/G | 0.300 | 0.307 | 0.333 | 0.310 | 0.372 | |||||
| G/G | 0.640 | 0.583 | 0.558 | 0.589 | 0.512 | |||||
| SNP3 | A | 0.204 | 0.250 | 0.050 | 0.262 | 0.032 | 0.259 | 0.050 | 0.276 | 0.011 |
| C | 0.796 | 0.750 | 0.738 | 0.741 | 0.724 | |||||
| A/A | 0.063 | 0.099 | 0.165 | 0.094 | 0.130 | 0.102 | 0.175 | 0.092 | 0.053 | |
| A/C | 0.282 | 0.301 | 0.335 | 0.313 | 0.368 | |||||
| C/C | 0.655 | 0.600 | 0.571 | 0.585 | 0.540 | |||||
| SNP4 | A | 0.154 | 0.209 | 0.012 | 0.226 | 0.004 | 0.215 | 0.018 | 0.236 | 0.001 |
| G | 0.846 | 0.791 | 0.774 | 0.785 | 0.764 | |||||
| A/A | 0.041 | 0.070 | 0.063 | 0.093 | 0.024 | 0.095 | 0.048 | 0.092 | 0.009 | |
| A/G | 0.226 | 0.278 | 0.266 | 0.240 | 0.287 | |||||
| G/G | 0.733 | 0.652 | 0.641 | 0.665 | 0.621 | |||||
| SNP5 | C | 0.244 | 0.315 | 0.005 | 0.326 | 0.004 | 0.310 | 0.026 | 0.322 | 0.002 |
| T | 0.756 | 0.685 | 0.674 | 0.690 | 0.678 | |||||
| C/C | 0.064 | 0.131 | 0.012 | 0.145 | 0.007 | 0.139 | 0.024 | 0.133 | 0.004 | |
| C/T | 0.359 | 0.369 | 0.363 | 0.343 | 0.378 | |||||
| T/T | 0.577 | 0.500 | 0.492 | 0.518 | 0.489 | |||||
| SNP6 | A | 0.150 | 0.198 | 0.024 | 0.190 | 0.097 | 0.186 | 0.147 | 0.186 | 0.074 |
| G | 0.850 | 0.802 | 0.810 | 0.814 | 0.814 | |||||
| A/A | 0.037 | 0.062 | 0.106 | 0.047 | 0.252 | 0.055 | 0.390 | 0.023 | 0.128 | |
| A/G | 0.226 | 0.271 | 0.284 | 0.262 | 0.326 | |||||
| G/G | 0.737 | 0.667 | 0.669 | 0.683 | 0.651 | |||||
| SNP7 | A | 0.848 | 0.792 | 0.009 | 0.786 | 0.012 | 0.790 | 0.023 | 0.800 | 0.010 |
| G | 0.152 | 0.208 | 0.214 | 0.210 | 0.200 | |||||
| A/A | 0.734 | 0.638 | 0.034 | 0.651 | 0.056 | 0.665 | 0.063 | 0.645 | 0.052 | |
| A/G | 0.229 | 0.308 | 0.271 | 0.250 | 0.311 | |||||
| G/G | 0.037 | 0.054 | 0.078 | 0.085 | 0.044 |
Note that there is overlap between the ‘affected’ groups. EA–Con, EA controls; EA–AD, EA cases with alcohol dependence; EA–DD, EA cases with drug dependence; EA–CD, EA cases with cocaine dependence; EA–OD, EA cases with opioid dependence. n, number of individuals; P, P-value for the χ2 test.
Comparison of allele and genotype frequencies of six OPRM1 SNPs (SNP8–13 in Block II) between EA cases and controls
| SNP ID | Allele/genotype | EA–Con (n=338) | EA–AD (n=318) | P-value | EA–DD (n=199) | P-value | EA–CD (n=171) | P-value | EA–OD (n=91) | P-value |
|---|---|---|---|---|---|---|---|---|---|---|
| SNP8 | C | 0.566 | 0.550 | 0.576 | 0.595 | 0.373 | 0.604 | 0.255 | 0.629 | 0.168 |
| G | 0.434 | 0.450 | 0.405 | 0.396 | 0.371 | |||||
| C/C | 0.323 | 0.320 | 0.648 | 0.378 | 0.412 | 0.392 | 0.304 | 0.400 | 0.288 | |
| C/G | 0.486 | 0.460 | 0.433 | 0.424 | 0.459 | |||||
| G/G | 0.191 | 0.220 | 0.189 | 0.184 | 0.141 | |||||
| SNP9 | C | 0.665 | 0.658 | 0.804 | 0.709 | 0.135 | 0.707 | 0.176 | 0.753 | 0.027 |
| T | 0.335 | 0.342 | 0.291 | 0.293 | 0.247 | |||||
| C/C | 0.448 | 0.436 | 0.945 | 0.513 | 0.330 | 0.518 | 0.340 | 0.562 | 0.095 | |
| C/T | 0.433 | 0.445 | 0.393 | 0.378 | 0.382 | |||||
| T/T | 0.119 | 0.119 | 0.094 | 0.104 | 0.056 | |||||
| SNP10 | A | 0.478 | 0.508 | 0.602 | 0.445 | 0.305 | 0.421 | 0.092 | 0.449 | 0.270 |
| G | 0.522 | 0.492 | 0.555 | 0.579 | 0.551 | |||||
| A/A | 0.234 | 0.275 | 0.356 | 0.241 | 0.155 | 0.218 | 0.081 | 0.239 | 0.122 | |
| A/G | 0.488 | 0.434 | 0.408 | 0.406 | 0.420 | |||||
| G/G | 0.278 | 0.291 | 0.351 | 0.376 | 0.341 | |||||
| SNP11 | C | 0.748 | 0.770 | 0.381 | 0.807 | 0.030 | 0.803 | 0.057 | 0.839 | 0.004 |
| T | 0.252 | 0.230 | 0.193 | 0.197 | 0.161 | |||||
| C/C | 0.548 | 0.632 | 0.002 | 0.661 | 0.036 | 0.661 | 0.040 | 0.689 | 0.009 | |
| C/T | 0.401 | 0.276 | 0.292 | 0.285 | 0.300 | |||||
| T/T | 0.051 | 0.092 | 0.047 | 0.054 | 0.011 | |||||
| SNP12 | C | 0.252 | 0.238 | 0.548 | 0.191 | 0.024 | 0.197 | 0.054 | 0.163 | 0.003 |
| T | 0.748 | 0.762 | 0.809 | 0.803 | 0.837 | |||||
| C/C | 0.054 | 0.105 | 0.001 | 0.052 | 0.021 | 0.060 | 0.026 | 0.022 | 0.005 | |
| C/T | 0.397 | 0.266 | 0.278 | 0.273 | 0.281 | |||||
| T/T | 0.549 | 0.629 | 0.670 | 0.667 | 0.697 | |||||
| SNP13 | A | 0.348 | 0.354 | 0.813 | 0.305 | 0.155 | 0.299 | 0.124 | 0.281 | 0.061 |
| G | 0.652 | 0.646 | 0.695 | 0.701 | 0.719 | |||||
| A/A | 0.134 | 0.135 | 0.955 | 0.115 | 0.332 | 0.110 | 0.292 | 0.090 | 0.174 | |
| A/G | 0.428 | 0.426 | 0.380 | 0.378 | 0.382 | |||||
| G/G | 0.438 | 0.439 | 0.505 | 0.512 | 0.528 |
Note that there is overlap between the ‘affected’ groups. EA–Con, EA controls; EA–AD, EA cases with alcohol dependence; EA–DD, EA cases with drug dependence; EA–CD, EA cases with cocaine dependence; EA–OD, EA cases with opioid dependence. n, number of individuals; P, P-value for the χ2 test.
Comparison of allele and genotype frequencies of four OPRM1 SNPs (SNPs 4 and 5 in Block I and SNPs 11 and 12 in Block II) between Russian cases and controls
| SNP ID | Allele/genotype | Rus–Con (n=100) | Rus-AD (n=247) | P-value |
|---|---|---|---|---|
| SNP4 | A | 0.167 | 0.196 | 0.381 |
| G | 0.833 | 0.804 | ||
| A/A | 0.030 | 0.029 | 0.549 | |
| A/G | 0.273 | 0.333 | ||
| G/G | 0.697 | 0.638 | ||
| SNP5 | C | 0.227 | 0.314 | 0.023 |
| T | 0.773 | 0.686 | ||
| C/C | 0.050 | 0.115 | 0.081 | |
| C/T | 0.354 | 0.397 | ||
| T/T | 0.596 | 0.488 | ||
| SNP11 | C | 0.722 | 0.751 | 0.429 |
| T | 0.278 | 0.249 | ||
| C/C | 0.505 | 0.572 | 0.437 | |
| C/T | 0.433 | 0.358 | ||
| T/T | 0.062 | 0.070 | ||
| SNP12 | C | 0.299 | 0.254 | 0.232 |
| T | 0.701 | 0.746 | ||
| C/C | 0.082 | 0.074 | 0.394 | |
| C/T | 0.433 | 0.361 | ||
| T/T | 0.485 | 0.565 |
Rus–Con, Russian controls; Rus–AD, Russian cases with alcohol dependence. n, number of individuals; P, P-value for χ2 test.
Comparison of OPRM1 haplotype frequencies between cases and controls
| Haplotypea | EA–Con (n=315) | EA–AD (n=310) | EA–DD (n=194) | Haplotypea | Rus–Con (n=100) | Rus–AD (n=247) |
|---|---|---|---|---|---|---|
| (tag SNPs1, 4, 5, 11 and 12) | (tag SNPs 4, 5, 11 and 12) | |||||
| AGTCT | 0.397 | 0.340 | 0.381 | GTCT | 0.495 | 0.456 |
| AGTTC | 0.231 | 0.182 | 0.150 | GTTC | 0.274 | 0.225 |
| AACCT | 0.136 | 0.187 | 0.202 | ACCT | 0.146 | 0.172 |
| GGTCT | 0.118 | 0.106 | 0.102 | GCCT | 0.065 | 0.116 |
| AGCCT | 0.092 | 0.098 | 0.103 | |||
| bP-value for testing H0: | 5×10⁻⁵ | 2.5×10⁻⁴ | bP-value for testing H0: | 0.153 | ||
EA–Con, EA–AD, EA–DD, Rus–Con, Rus–AD, n: same as in Tables 1.
aHaplotypes with frequency less than 2% are not listed.
bP-values for testing H0 (no association) were obtained by the program PHASE (49).
References
Delfs, J.M., Kong, H., Mestek, A., Chen, Y., Yu, L., Reisine, T. and Chesselet, M.F. (
Uhl, G.R., Sora, I. and Wang, Z. (
Matthes, H.W., Maldonado, R., Simonin, F., Valverde, O., Slowe, S., Kitchen, I., Befort, K., Dierich, A., Le, M.M., Dolle, P. et al. (
Sora, I., Takahashi, N., Funada, M., Ujike, H., Revay, R.S., Donovan, D.M., Miner, L.L. and Uhl, G.R. (
Di, C.G. and Imperato, A. (
Gianoulakis, C. and Barcomb, A. (
Roth-Deri, I., Zangen, A., Aleli, M., Goelman, R.G., Pelled, G., Nakash, R., Gispan-Herman, I., Green, T., Shaham, Y. and Yadid, G. (
Rosin, A., Kitchen, I. and Georgieva, J. (
Spanagel, R., Herz, A. and Shippenberg, T.S. (
Berrettini, W.H., Ferraro, T.N., Alexander, R.C., Buchberg, A.M. and Vogel, W.H. (
Alexander, R.C., Heydt, D., Ferraro, T.N., Vogel, W. and Berrettini, W.H. (
O'Malley, S.S., Jaffe, A.J., Chang, G., Schottenfeld, R.S., Meyer, R.E. and Rounsaville, B. (
Volpicelli, J.R., Alterman, A.I., Hayashida, M. and O'brien, C.P. (
Bergen, A.W., Kokoszka, J., Peterson, R., Long, J.C., Virkkunen, M., Linnoila, M. and Goldman, D. (
Bond, C., LaForge, K.S., Tian, M., Melia, D., Zhang, S., Borg, L., Gong, J., Schluger, J., Strong, J.A., Leal, S.M. et al. (
Befort, K., Filliol, D., Decaillot, F.M., Gaveriaux-Ruff, C., Hoehe, M.R. and Kieffer, B.L. (
Beyer, A., Koch, T., Schroder, H., Schulz, S. and Hollt, V. (
Zhang, Y., Wang, D., Johnson, A.D., Papp, A.C. and Sadee, W. (
Arias, A., Feinn, R. and Kranzler, H.R. Association of an Asn40Asp (A118G) polymorphism in the µ-opioid receptor gene with substance dependence: a meta-analysis.
Szeto, C.Y., Tang, N.L., Lee, D.T. and Stadlin, A. (
Bart, G., Heilig, M., LaForge, K.S., Pollak, L., Leal, S.M., Ott, J. and Kreek, M.J. (
Bart, G., Kreek, M.J., Ott, J., LaForge, K.S., Proudnikov, D., Pollak, L. and Heilig, M. (
Kim, S.G., Kim, C.M., Kang, D.H., Kim, Y.J., Byun, W.T., Kim, S.Y., Park, J.M., Kim, M.J. and Oslin, D.W. (
Town, T., Abdullah, L., Crawford, F., Schinka, J., Ordorica, P.I., Francis, E., Hughes, P., Duara, R. and Mullan, M. (
Schinka, J.A., Town, T., Abdullah, L., Crawford, F.C., Ordorica, P.I., Francis, E., Hughes, P., Graves, A.B., Mortimer, J.A. and Mullan, M. (
Tan, E.C., Tan, C.H., Karupathivan, U. and Yap, E.P. (
Gelernter, J., Kranzler, H. and Cubells, J. (
Hoehe, M.R., Kopke, K., Wendel, B., Rohde, K., Flachmeier, C., Kidd, K.K., Berrettini, W.H. and Church, G.M. (
Franke, P., Wang, T., Nothen, M.M., Knapp, M., Neidt, H., Albrecht, S., Jahnes, E., Propping, P. and Maier, W. (
Shi, J., Hui, L., Xu, Y., Wang, F., Huang, W. and Hu, G. (
Crowley, J.J., Oslin, D.W., Patkar, A.A., Gottheil, E., Demaria, P.A., Jr, O'brien, C.P., Berrettini, W.H. and Grice, D.E. (
Luo, X., Kranzler, H.R., Zhao, H. and Gelernter, J. (
Franke, P., Wendel, B., Knapp, M., Schwab, S.G., Neef, D., Maier, W., Wildenauer, D.B. and Hoehe, M.R. (
Compton, P., Geschwind, D.H. and Alarcon, M. (
Loh, e.W., Fann, C.S., Chang, Y.T., Chang, C.J. and Cheng, A.T. (
Ide, S., Kobayashi, H., Tanaka, K., Ujike, H., Sekine, Y., Ozaki, N., Inada, T., Harano, M., Komiyama, T., Yamada, M. et al. (
Rommelspacher, H., Smolka, M., Schmidt, L.G., Samochowiec, J. and Hoehe, M.R. (
Kranzler, H.R., Gelernter, J., O'Malley, S., Hernandez-Avila, C.A. and Kaufman, D. (
Hernandez-Avila, C.A., Wand, G., Luo, X., Gelernter, J. and Kranzler, H.R. (
Tokuhiro, S., Yamada, R., Chang, X., Suzuki, A., Kochi, Y., Sawada, T., Suzuki, M., Nagasaki, M., Ohtsuki, M., Ono, M. et al. (
Bare, L.A., Mansson, E. and Yang, D. (
Pan, Y.X. (
Pan, L., Xu, J., Yu, R., Xu, M.M., Pan, Y.X. and Pasternak, G.W. (
Yang, B.Z., Zhao, H., Kranzler, H.R. and Gelernter, J. (
Luo, X., Kranzler, H.R., Zuo, L., Yang, B.Z., Lappalainen, J., Gelernter, J. (
Cubells, J.F., Kobayashi, K., Nagatsu, T., Kidd, K.K., Kidd, J.R., Calafell, F., Kranzler, H.R., Ichinose, H. and Gelernter, J. (
Barrett, J.C., Fry, B., Maller, J. and Daly, M.J. (
Nyholt, D.R. (
Stephens, M. and Donnelly, P. (
Pritchard, J.K. and Rosenberg, N.A. (
Lappalainen, J., Krupitsky, E., Remizov, M., Pchelina, S., Taraskina, A., Zvartau, E., Somberg, L.K., Covault, J., Kranzler, H.R., Krystal, J.H. and Gelernter, J. (
Luo, X., Kranzler, H.R., Zuo, L., Lappalainen, J., Yang, B.Z. and Gelernter, J. (
Feder, J.N., Gnirke, A., Thomas, W., Tsuchihashi, Z., Ruddy, D.A., Basava, A., Dormishian, F., Domingo, R., Jr., Ellis, M.C., Fullan, A. et al. (
Jiang, R., Dong, J., Wang, D. and Sun, F.Z. (
Xu, J., Turner, A., Little, J., Bleecker, E.R. and Meyers, D.A. (
Chen, J.J., Duan, T., Single, R., Mather, K. and Thomson, G. (
Leal, S.M. (
Chapman, J.M., Cooper, J.D., Todd, J.A. and Clayton, D.G. (
Goldstein, D.B., Ahmadi, K.R., Weale, M.E. and Wood, N.W. (
Clayton, D., Chapman, J. and Cooper, J. (
Gelernter, J., Panhuysen, C., Weiss, R., Brady, K., Hesselbrock, V., Rounsaville, B., Poling, J., Wilcox, M., Farrer, L. and Kranzler, H.R. (
Tang, H., Quertermous, T., Rodriguez, B., Kardia, S.L., Zhu, X., Brown, A., Pankow, J.S., Province, M.A., Hunt, S.C., Boerwinkle, E. et al. (
Luo, X., Kranzler, H.R., Zuo, L., Wang, S., Blumberg, H.P. and Gelernter, J. (
Spitzer, R.L., Andreasen, N.C. and Endicott, J. (
Gabriel, S.B., Schaffner, S.F., Nguyen, H., Moore, J.M., Roy, J., Blumenstiel, B., Higgins, J., DeFelice, M., Lochner, A., Faggart, M. et al. (
Liu, K. and Muse, S.V. (
Niu, T., Qin, Z.S., Xu, X. and Liu, J.S. (
Falush, D., Stephens, M. and Pritchard, J.K. (
