


Abstract
Essential hypertension (EH) affects a large proportion of the adult population in Western countries and is a major risk factor for cardiovascular diseases. EH is a multifactorial disease with a complex genetic component. To tackle the complexity of this genetic component, we have initiated a study of Campora, an isolated village in South Italy. A random sample of 389 adults was genotyped for a very dense microsatellite genome scan and phenotyped for EH. Of this sample, 173 affected individuals were all related through a 2180-member pedigree and could be integrated within a linkage analysis. The complexity of the pedigree prevented its direct use for a non-parametric linkage (NPL) analysis. Therefore, the method proposed by Falchi et al . [2004, Am. J. Hum. Genet. , 75 , 1015–1031] was used for automatic pedigree-breaking. We identified a new locus for EH on chromosome 8q22–23 and detected linkage with two known loci for EH: 1q42–43 and 4p16. Simulations showed that the linkage with 8q22–23 is highly genome-wide significant, even when accounting for the breaking of the pedigree. An extension to qualitative traits of another pedigree-breaking approach [Pankratz et al. , 2001, Genet. Epidemiol. , 21 (Suppl. 1), S258–S263] also detected a significant linkage on 8q22–23 using a remarkably different set of sub-pedigrees and helped to refine the location of the linkage signal. This work both identifies a new locus strongly linked to hypertension and shows that the power of linkage analysis can be improved by the appropriate use of efficient pedigree-breaking strategies.
INTRODUCTION
Essential hypertension (EH) affects one billion people around the world and is a major risk factor in deaths from stroke and ischaemic heart disease ( 1 , 2 ). EH is a multifactorial disease displaying familial correlations. Twin studies suggest the existence of genetic factors ( 3 ). The complexity of the disease is in fact revealed by the several candidate genes and loci that have been described so far ( 4 ). One strategy to tackle the complexity of the genetic models underlying multifactorial diseases is to focus on small population isolates where a simplification of these models is expected. In fact, the features of these populations—small number of founders, isolation, low immigration rate and a high rate of consanguineous marriages—may reduce the number of susceptibility genes and increase genetic homogeneity ( 5 , 6 ). The chance of finding susceptibility genes is also improved because individuals are exposed to a common environment and a quite uniform lifestyle minimizing non-genetic variability.
We have recently initiated a study of small villages located in the Cilento area, a remote hilly region of South Italy, with the purpose of identifying genes involved in complex diseases. In the village of Campora, 63% of the 1200 living inhabitants derive from 37 founders who survived the plague of 1656 ( 7 ). Inbreeding is present though relatively modest (mean is 0.0073) and a 3964-member pedigree connects all living inhabitants.
The complexity of the large genealogies characterizing isolated populations often prohibits to use them directly for linkage analysis and obliges to break the pedigree. It has been argued that pedigree-breaking may have an important impact on power ( 8 ), but the actual loss of power is strongly correlated to both the pedigree characteristics and the genetic model ( 9 ). In particular, when cases are distantly related with a number of unavailable co-ancestors, the loss of power might be modest provided that the breaking is efficiently performed. Indeed, it has been recognized ( 10 ) that the linkage results are dependent on how the sub-pedigrees are chosen.
Selection of sub-pedigrees has long been done manually. In 2001, Pankratz and Iturria ( 11 ) proposed a semi-automatic approach to break a complex pedigree. Noting that related individuals are informative for non-parametric linkage (NPL) statistics in a pairwise manner, they propose to cluster individuals in sub-pedigrees using all the pairwise kinship coefficients as a sufficient summary of the pedigree information. In this method, clustering of individuals is done using a principal components factor analysis (PCFA). More recently, Falchi et al. ( 12 ) proposed an automatic approach to pedigree-breaking. Selection of sub-pedigrees is also based on pairwise relationships but clustering of individuals is done with a maximum clique-partitioning approach. Though automatic, this latter approach requires a number of parameters to be fixed by users. These two methods have been presented for quantitative trait linkage analysis when all the genotyped and phenotyped individuals are directly informative for linkage.
In this work, we evaluate the usefulness of Campora population for complex trait mapping, by focusing on essential hypertension. All affected individuals are related through a 2180-member pedigree, making the sample suitable for linkage analysis. We started by breaking the EH pedigree of Campora using the Falchi method. Subsequent NPL analysis of the sub-pedigrees identified a new locus for EH on chromosome 8q22–23 and detected linkage with two known loci for EH: 1q42–43 and 4p16. We showed using ad hoc simulations, taking into account the breaking of the pedigree, that the linkage with 8q22–23 is highly genome-wide significant. This linkage is also robust to slight changes in phenotype definition. A study of the influence of the pedigree-breaking conditions on our linkage result showed that important linkage information can be gained by sensible choice of parameters in the Falchi method. An extension of the Pankratz and Iturria PCFA approach confirmed, using a different set of sub-pedigrees, a significant linkage on 8q22–23 and allowed to refine the location of the linkage signal.
RESULTS
Linkage analysis of hypertension
In a first step, we broke the 2636-member pedigree with the method of Falchi et al. , blind of potential influence of the parameter choice on the linkage results. With a random choice of parameters, we obtained a sub-pedigree set of 32 families including 115 affected individuals (the characteristics are presented in Table 1 ) which displayed a maximum Zlr (maxZlr) over the whole genome of 3.66 on chromosome 8q22–23 at position 115.27 cM of marker D8S1784 (Fig. 1 A). After a careful optimization of this linkage signal (see what follows), we obtained a sub-pedigree set of 22 families including 98 cases (Table 1 ). The maxZlr on chromosome 8 was then 4.92, observed at position 121.48 cM, between marker D8S281 and D8S1823 (see Fig. 1 B). Contrary to the linkage peak initially identified with the ‘blind’ partitioning of the pedigree, this signal was highly significant at the genome-wide level. Simulations of chromosome 8 followed by a Bonferroni correction provided a P -value <0.0044, to be compared with a ‘blind’ partitioning P -value of 0.08. The Zlr curve displays two neighbouring peaks 4 cM apart: the highest (maxZlr=4.92) is observed at position 121.48 cM and the second (Zlr=4.85) at position 117.34 cM, 2 cM apart from the maxZlr of the blind partitioning. The maxZlr of chromosome 8 is also the maxZlr on the whole genome as can be seen from Fig. 2 A. Four additional regions display a Zlr>2.7 for at least two consecutive markers: 1q43 (Zlr=3.05, position 262.68 cM), 2q14 (Zlr=2.93, position 132.18), 4p16 (Zlr=2.72, position 10.37 cM) and 18p11 (Zlr=3.08, position 20.04 cM) though none of these is genome-wide significant (whole genome-corrected P -value=0.50, 0.76, 0.99, 0.46, respectively). Interestingly, 1q42–43 corresponds to the location of the Angiotensinogen (AGT) gene for which both linkage and association with EH has already been described ( 13 ). 4p16 corresponds to the location of the α-Adducin gene for which both linkage and association in an Italian population has been described ( 14 ). For comparison, using the ‘blind’ partitioning sub-pedigree set, the linkage peaks are much smaller at position 1q42–43 (Zlr=2.20 at position 263.28 cM) and 4p16 (Zlr=2.56 at position 15.27 cM) and the only additional region displaying a Zlr>2.7 for at least two consecutive markers is 4q31 (Zlr=2.98), but it does not correspond to any previously described region for EH.
Sensibility to phenotype definition
Because systolic BP (SBP) probably has a different pathophysiology than diastolic BP (DBP) and thus potentially different genetic component, we evaluated the sensitivity of the chromosome 8 linkage result to the phenotype definition. We considered two additional sub-phenotypes: SBP+, individuals under hypertensive medication or with a SBP >140 mmHg and DBP+, individuals under hypertensive medication or with DBP >90 mmHg. Given the high proportion of cases under medication in our sample, the SBP+ and DBP+ samples notably overlapped with our initial sample. After partitioning the pedigree with the Falchi method, we analysed a sample including 91 cases SBP+ and a sample including 95 cases DBP+. MaxZlr of 4.28 and 4.82 were observed at marker D8S1823 (position 123.30 cM) for, respectively, SBP+ and DBP+. Linkage to chromosome 8 seems thus robust to phenotype definition.
Assessment of Falchi partitioning approach parameters
The pedigree partitioning providing the optimized linkage signal on chromosome 8 was identified after evaluating the sensitivity of this linkage signal to the Falchi method parameter values. Zlr on all markers of chromosome 8 were computed for a wide range of parameters and maxZlr on the chromosome were compared for different sets of parameters. Ideally, we would compare P -values associated to maxZlr rather than maxZlr values. However, because simulations for significance are highly computer intensive, we compared maxZlr values and controlled for a good level of information content on the whole chromosome and a reasonable number of affected individuals included in the analysis. P -values were computed for various sets of parameters to control the correctness of our approximation. Table 2 presents the sub-pedigree set characteristics and the linkage results obtained when the breaking was done with the clustering step based on either affected only or affected and unaffected individuals and with either the number of meiotic steps or the kinship coefficient as the pairwise relationship measure. The results presented in this table are optimized for all other parameters of the method (clique size and number of generations for family reconstruction). Genome-wide significant linkage is detected in all four configurations. The highest maxZlr is observed when the clustering step is based on affected only, with the kinship coefficient as pairwise relationship measure. Noteworthy, the corresponding sub-pedigree set, that optimized the linkage on chromosome 8 and was used for the genome-wide screen presented in the previous sections, is not the one maximizing the number of affected individuals, with only 98 affected individuals included in the analysis. However, for a comparable number of cases per family, it is the one maximizing the kinship among cases in the families. The exact location of the maxZlr varies with the sub-pedigree sets. In particular, when clusters are defined on the affected and non-affected samples, with the number of meiotic step as pairwise relationship measure, maxZlr is at position 115.99 cM, closer to the second peak detected in Fig. 1 B. Table 3 presents the sub-pedigree set characteristics and the linkage results for two other parameters of the clustering step: minimum size of the cliques and minimum relationship level between all the individuals of a clique. Again, the results presented are optimized regarding all other parameters. The variation of maxZlr as a function of these parameters is substantial, in particular, for the relationship level. The sub-pedigree set based on a minimum clique size of three with a minimum kinship between individuals in a clique of 0.03125, displays a maxZlr smaller by an order of magnitude of one when compared to the set based on the same minimum clique size but with a minimum kinship of 0.0625. Again, the different sub-pedigree sets provide maxZlr located at either one of the two peaks identified on Fig. 1 B. Though automatic, the Falchi method is thus very sensitive to some key parameter values, left at the user-choice.
Genealogy partitioning by PCFA approach
To evaluate the sensitivity of the linkage results to the method of pedigree-breaking used, we extended the PCFA approach proposed by Pankratz and Iturria ( 11 ) for the analysis of a qualitative trait. The characteristics of the sub-pedigree set maximizing the linkage signal on chromosome 8 are presented in Table 1 . Results of the genome screen linkage analysis using this new sub-pedigree set are represented in Fig. 2 B. The linkage signal on chromosome 8 is detected (maxZlr=5.27) and simulations showed that it is genome-wide significant ( P -value=0.0044). As can be seen from Fig. 1 C, the shape of the Zlr curve on chromosome 8 is relatively different from the curve in Fig. 1 B. A single peak is observed at position 115.27 cM (marker D8S1784) that corresponds to the second peak obtained with the optimized Falchi set. Interestingly, the characteristics of the sub-pedigree set are quite different from the optimized Falchi set. One hundred and eighteen affected individuals from 25 families are considered instead of 98 from 22 families. Only 85 cases are shared by the two sets and only two families are strictly identical. Families are more extended (mean number of generations per family is 4.16 instead of 3.09), include slightly more cases (mean number of cases per family is 4.76 instead of 4.55) but cases within the families are more distantly related (mean kinship among cases per family is 0.114 instead of 0.132). Two additional linkage peaks with Zlr>3 are detected on the whole genome. They are located on chromosome 3q26 (Zlr=3.52) at position 178.27 cM and on chromosome 4q31 (Zlr=3.79) at position 144.41 cM. None reaches genome-wide significance ( P -value=0.22 and P -value=0.094, respectively). Further, no linkage with EH has been previously described at these locations. The interesting linkage replications of regions 1q42–43 and 4p16 are not confirmed (Zlr=1.85 at 1q42–43 and Zlr=2.28 at 4p16).
Table 4 presents the impact on linkage results of the only two parameters of this breaking method: initial sample of individuals used for the clustering step and number of factors retained before the family reconstruction. Sensitivity of the results to the number of factors considered is substantial. When clustering is based on affected only, maxZlr varies by an order of magnitude of two when 27 rather than 31 factors are retained. Contrary to the Falchi method, the maxZlr are all observed in the vicinity of the 115.27 cM peak. Highest maxZlr is again observed when affected only are used for clustering and the corresponding sub-pedigree set is not the one with the largest number of affected individuals included. If the PCFA approach involves only two parameters, the sensitivity of the method to these parameters and in particular, to the number of factors, is strong.
Linkage correlation between Falchi and PCFA data sets
Because the two sub-pedigree sets are notably different, with only 85 cases shared by the two sets and quite different family structures, it is tempting to consider the genome-wide significant detection of linkage on chromosome 8 within a 6 cM interval with the PCFA set as a kind of ‘replication’ of the detection with the Falchi set, though not a strict one.
To quantify the correlation in terms of linkage of the two sets, we used the 10 000 null simulations described in the Materials and Methods section in the context of P -value computation. Considering the 5% of null simulations displaying the highest maxZlr on chromosome 8 with the Falchi set, we quantified the proportion of these simulations where the maxZlr computed with the PCFA set was above the 5% threshold of PCFA maxZlr and located in a 6 cM interval of the Falchi set maxZlr. Over a total of 505 replicates for which linkage was significantly detected with the Falchi set, only 15.25% were also significantly detected with the PCFA set with a maxZlr in a 6 cM interval. This proportion is to be compared with the 0.4% expected if the two samples were strictly independent. As expected, the linkage signals obtained with the two sub-pedigree sets are correlated, but the correlation is limited.
Association study
Results of the CC-QLS test for association for the 13 markers located between position 106.89 cM and 135.12 cM are presented in Table 5 . Interestingly, an association is detected between EH and marker D8S521 located at position 110.62 cM, though with a moderate significance, whereas no association is detected around position 121.48 cM. We note that cases and controls were not matched for age, as we ascertained a random sample of individuals who were phenotyped in a second step. Controls are notably younger than cases as can be seen in Table 6 , and might thus turn into cases eventually. We believe that this sampling scheme only lowers the power of the association test and does not generate false positive signals.
DISCUSSION
We report the detection of a new susceptibility locus for EH on chromosome 8q22–23 using a sample of 173 affected inhabitants of the village of Campora, South Italy. Linkage is consistent with slight changes in phenotype definition, focusing either on SBP or DBP. Thanks to the village isolation, the 173 randomly chosen affected individuals are in fact related through a 2180-member pedigree, making the sample suitable for linkage analysis. The complexity of the pedigree prohibits a direct linkage analysis and requires clustering of individuals into sub-pedigrees. We studied two different approaches to pedigree-breaking and illustrated the sensitivity of linkage results to the quality of pedigree-breaking. It is only after a careful optimization of the two methods that we could define optimal sets of sub-pedigrees that display genome-wide significant detection of linkage. Our optimization included a preferential weighting for affected individuals in the clustering, as they are directly informative for linkage. Pedigree-breaking methods cluster individuals, using relationship measures extracted from the pedigree information. We showed that the choice of the relationship measure has an impact on the interest of the pedigree for subsequent linkage analysis. In particular, kinship coefficients seem to do better than the number of meiotic steps, which is not a surprising result. If none of the two measures is a direct indicator of pair informativeness for NPL, the kinship coefficient is a linear function of the IBD expectation ( 15 ) to which NPL statistics are linked. This is not the case for the number of meiotic steps.
The two different breaking methods that we optimized on the data, provided remarkably different sub-pedigree sets with more extended families and more remote cases in the families for the set obtained with the PCFA-based approach. Still, they both detected a genome-wide significant linkage signal on chromosome 8, within a 6 cM interval. We evaluated the correlation in terms of linkage of the two partly overlapping samples. We showed that the probability for the PCFA set to give a significant linkage within a 6 cM interval from the linkage detected with the Falchi set is only 15.25% in the absence of a true linkage. Further, this region is the only one consistently detected over the various sub-pedigree sets evaluated in the study. These two observations argue in favour of this signal being a true linkage detection. The shape of the Zlr curve was sharper with the PCFA-based approach, detecting a single peak at position 115.27 cM, 5 cM apart from a microsatellite showing some association with EH. It is possible that the more extended families of the corresponding sub-pedigree set explain the finer location of the linkage peak.
Further, apart from the new locus on chromosome 8, Falchi sub-pedigree set optimized on chromosome 8 detected linkage with two loci already described for both linkage and association with EH: 1q42–43 in the region of the AGT gene and 4q16 in the region of the α-Adducin gene, but none of them is genome-wide significant. Contrary to chromosome 8, these signals were not detected with PCFA or with a non-optimized sub-pedigree set. Consequently, we cannot exclude that these detections are false positive, located by chance on previously identified EH loci. It is also possible that the power to detect them is higher in particular sub-pedigree sets.
Our optimization strategy assumed the presence of a risk factor for EH on chromosome 8. The validity of this optimization procedure is controlled by the computation of simulation based P -values that protect us from spurious selection of sets that would provide higher statistic values because of an increased Type I error and not because of a better use of the information available. The idea behind using a set optimized on chromosome 8 to analyse the whole genome is the following. Suppose that the signal on chromosome 8 is driven by a true linkage. By finding the set that maximizes this signal, we select the set with the most informative pairs for linkage. Because the informativity of a pair partly depends on the genetic model, the optimal set to detect the linkage on chromosome 8 might not strictly be the optimal to detect other factors at other locations, but it should be a correct approximation. Of course, despite strong elements (strong linkage with different sub-pedigree sets and association in the linkage region), the actual presence of a risk factor on chromosome 8 remains to be unambiguously demonstrated.
If some of the optimization results that we found may be general (like basing the clustering step on affected only and using kinship as relationship measure), other results concerning parameters such as clique size, level of relationship or number of generations for family reconstruction in the Falchi method and number of factors in the PCFA, are very likely specific to both our pedigree and the trait under study. These results illustrate the sensitivity of automatic breaking approaches to the parameter choice and the importance to define optimization procedures.
It is the first report of linkage between EH and the 8q22–23 region. Forty known genes are located in the 8q22–23 region, including two good candidates for hypertension, Angiopoietin-1 (Angpt-1) and Fog2. Interestingly, these two genes are located in the vicinity of the peak detected with the PCFA approach: Angpt-1 between D8S1132 and D8S1470, Fog2 between D8S1784 and D8S1132. The Angpt-1 gene encodes a 498-amino acid polypeptide with a critical role in the induction of pulmonary hypertension in rodent ( 16 ). Recently, Nadar et al. ( 17 ) demonstrated that plasma and platelet-derived ANGPT-1 is increased in subjects suffering from EH and that ANGPT-1 levels change with successful antihypertensive treatment. The Fog2 gene encodes a zinc finger transcription factor, playing a central role in heart morphogenesis and development of coronary vessels from epicardium in mice ( 18 ). Association of these genes and systematic search in the region is on the way.
The present paper reports the first linkage analysis of a complex trait in one of the rural villages of the Cilento National Park. Results are very encouraging as we both replicate known linkages and detect a strongly significant new locus linked to essential hypertension. They also illustrate the importance of designing efficient methods of analysis including clever pedigree-breaking strategies to improve our power to detect linkage in large genealogies.
MATERIALS AND METHODS
Population and genealogy
The village of Campora is located in a remote hilly area of the Cilento National Park in South Italy. The current population is 1200 inhabitants living in the village and the surrounding areas. Using local church and town records, we reconstructed the exhaustive genealogy of the population and identified a 3964-individual pedigree connecting all 1200 living individuals. This pedigree dates back to 1656 with a few individuals entering the genealogy throughout the population history. Of the 491 founders (individuals with both parents outside the genealogy), 366 (74.5%) entered the genealogy prior to 1890. We showed using mitochondrial and Y-haplotypes that 63% of the living population descend from only 20 paternal and 17 maternal lines ( 7 ). Mean inbreeding in a sample of 584 living individuals is 0.0073 [range (0–0.0655)] and mean kinship coefficient is 0.008 [range (0–0.284)].
Clinical assessment
Blood pressure was measured on a sample of 389 adults. The measurements were performed twice for each arm with an interval of 15 min and in a seated position. A mercury sphygmomanometer was used by trained clinicians. We considered the average of the four measures in the analysis. A detailed questionnaire including personal and familial past diseases, past and present drug therapies, diet, smoking habit and alcohol use was filled out during the examination. Affection status was established following the current hypertension guidelines ( 19 , 20 ): individuals under hypertensive medication or with a SBP >140 mmHg or a DBP >90 mmHg, were considered as affected. The study was approved by the medical Ethics Committee of Azienda Sanitaria Locale Napoli 1 and all individuals participating in the study signed the informed consent form in accordance with the Declaration of Helsinki (World Medical Association, Web site).
Sample characteristics
The characteristics of the 389 phenotyped individuals are presented in Table 6 . One hundred and seventy three individuals are affected, a proportion (44.4%) in accordance with the prevalence of EH in Italy (47.5%) ( 21 ). Among the affected individuals, 144 individuals are under hypertensive medication (85.7%), 11 with a DBP >90 mmHg and 22 with a SBP >140 mmHg. Sex ratio is consistent in the affected and non-affected samples but as expected, cases are notably older than controls. Mean inbreeding in the affected group is 0.0077 [range (0–0.0655)], sensibly higher than in the non-affected group. A 2636-member pedigree connects all 389 individuals and a 2180-member pedigree connects the 173 affected individuals. Of the 350 founders of the 2180-member pedigree, 326 (94%) entered the genealogy prior to 1890, a proportion significantly higher than in the general living population as outlined in the Population and Genealogy section.
Genotyping and error checking
Genomic DNA was extracted from 10 ml of peripheral blood by the Flexigene kit (Qiagen) following manufacturer's instructions, for a random sample of 584 individuals that includes the 389 EH-phenotyped individuals. A genome-wide scan of 1122 microsatellites (average marker spacing of 3.6 cM and mean marker heterozygosity of 0.70) was performed by deCODE genotyping service. Mendelian inheritance inconsistencies were checked with the Pedcheck program ( 22 ). Allele frequencies were estimated using the BLUE estimator proposed by McPeek et al. ( 23 ) on the whole 584 individual sample.
Pedigree-breaking
The method proposed by Falchi et al. ( 12 ) has two steps. First, subgroups of related individuals, cliques, are identified. We will refer to this step as the clustering step in what follows. Second, genealogical links between all the individuals of each clique are reconstructed. We will refer to this second step as the family reconstruction step. The first step is performed using a maximum clique partitioning algorithm, where individuals are iteratively clustered in cliques of maximum size that satisfy user-defined constraints on the clique size (maximum and minimum size) and on the relationship level between the individuals in the cliques (minimum and maximum levels). Two different measures of pairwise relationship can be used for the clustering, the number of meiotic steps or the kinship coefficient. In the second step, an algorithm based on joining binary trees reconstructs a pedigree for each clique, with a constraint on the maximum number of generations between members of a pedigree, defined a priori by the user. The method is thus automatic, but requires user choices of key parameter values. Further, the choice of the sample of individuals on which the clustering step is performed, is an extra parameter. In the context in which this method has been proposed, NPL analysis of a quantitative trait, all genotyped and phenotyped individuals are informative. In the context of a NPL analysis of qualitative traits, only genotyped affected individuals are directly informative. Non-affected genotyped individuals only add at the information content level. Consequently, we chose to base the selection of sub-pedigrees on the 173 affected individuals, but it could also have been based on the 389 phenotyped and genotyped individuals.
The PCFA approach to pedigree-breaking as initially proposed by Pankratz and Iturria ( 11 ) is one-stepped. The kinship matrix connecting all the members of the large pedigree (genotyped or not, phenotyped or not) is viewed as a correlation matrix, where the variables represent the individuals. Detecting groups of closely related individuals is done by identifying sets of highly correlated variables from the kinship matrix with a PCFA. The number of sets, or factors in the PCFA, is chosen by the user. Because all the members of the genealogy are included in the PCFA, each set directly corresponds to a family readily usable (with the exception of sets where the two parents of children are not clustered together). To make this approach more flexible and favour particular individuals in the identification of the sub-pedigrees, we used a two-step strategy. Using a PCFA based on their kinship, individuals of particular interest—e.g. affected individuals for a qualitative linkage analysis or all phenotyped and genotyped individuals for a quantitative linkage analysis—are first clustered in groups of related individuals. Second, sub-pedigrees are reconstructed in each cluster using all the individuals available in the genealogy. Pedigree reconstruction is done with PEDHUNTER ( 24 ), which identifies, for a group of individuals, all the pedigrees connecting them to one common ancestor. Among the different reconstructed pedigrees proposed by PEDHUNTER, we chose the one minimizing 2 N - F (where F is the number of founder individuals in the pedigree and N the number of non-founders) to avoid very deep pedigrees with numerous non-genotyped individuals that are computationally heavy.
Linkage analysis
NPL analysis was performed with the Zlr statistics ( 25 ) based on Spairs with the exponential model and multipoint IBD computation using ALLEGRO ( 26 ). To generate genome-wide empirical P -values, null distribution of Zlr was assessed through simulations, taking into account both the particular characteristics of the marker map and the breaking of a large pedigree into sub-pedigrees.
Pedigree partitioning may indeed impact the null distributions of the statistics. After the breaking, individuals are less related than they really are. The null IBD sharing distribution may be underestimated and an excess sharing can be observed just because relatedness is not correctly specified.
Further, duplication of individuals that may be required for the breaking can turn related pairs of individuals into independent pairs and impact the variance of the statistics.
We only simulated the markers of the chromosome displaying the maximum Zlr on the whole genome. Genome-wide significance was extrapolated with a Bonferroni correction. Five thousand replicates were simulated with the following scheme. Alleles at each marker of the chromosome for the founders of the 2947-pedigree connecting the 584 genotyped individuals, were randomly drawn using the allele frequency distribution p̂ estimated with the BLUE estimator ( 23 ) on the data, assuming independence among markers and Hardy–Weinberg equilibrium. Genotypes of all non-founder individuals were then randomly drawn conditional on their parent genotypes and independently from their phenotype. Only genotypes of individuals available in the real data were considered, all others were set to missing. This gene-dropping step was performed with the program Genedrop from the MORGAN package (University of Washington, Website). Linkage analysis was then performed on the set of sub-pedigrees. Because linkage analysis is sensitive to marker allele frequency estimation, we assessed the null distribution of the linkage statistic under the same conditions of frequency estimation than the ones used for the real data. Therefore, marker allele frequencies used in the linkage analysis were re-estimated for each simulated data set, using the sample of 584 genotyped individuals available. Maximum value of the Zlr statistic on the chromosome was considered in each replicate.
Finally, P -value was assessed as the number of replicates with a maximum Zlr greater or equal to the maximum Zlr observed in the data.
Association testing
Thirteen microsatellites located in the region where we found a linkage peak, were tested for association using the 173 affected and the 216 unaffected individuals as controls. The CC-QLStest proposed by Bourgain et al. ( 27 ) was used to perform association tests corrected for the relationship between the cases and the controls of the sample. The correction was computed based on the 2636-member pedigree connecting all cases and controls.
ACKNOWLEDGEMENTS
We thank the population of the village of Campora for their kind cooperation. We thank Arch. D. Nicoletti, Dr A. Salati and Don G. Trotta for helping in the interaction with the population and the Institutions, Dr G. Lembo and Professor L. Luzzatto for valuable comments and suggestions and M. Terracciano and C. Lago for technical assistance. This work was supported by grants from Ente Parco Nazionale del Cilento e Vallo di Diano, the Associazione Italiana per la Ricerca sul Cancro (AIRC), the Assessorato Ricerca Regione Campania, the Fondazione Banco di Napoli to MGP and the CNR-INSERM agreement to MGP and CB. Funding to pay the Open Access publication charges for this article was provided by Assessorato Ricerca Regione Campania.
WEB RESOURCES
The URLs for data presented herein are as follows.
Declaration of Helsinki, World Medical Association, http://www.wma.net/e/policy/b3.htm ; MORGAN package, http://www.stat.washington.edu/thompson/Genepi/MORGAN/Morgan.shtml
Conflict of Interest statement . None declared.
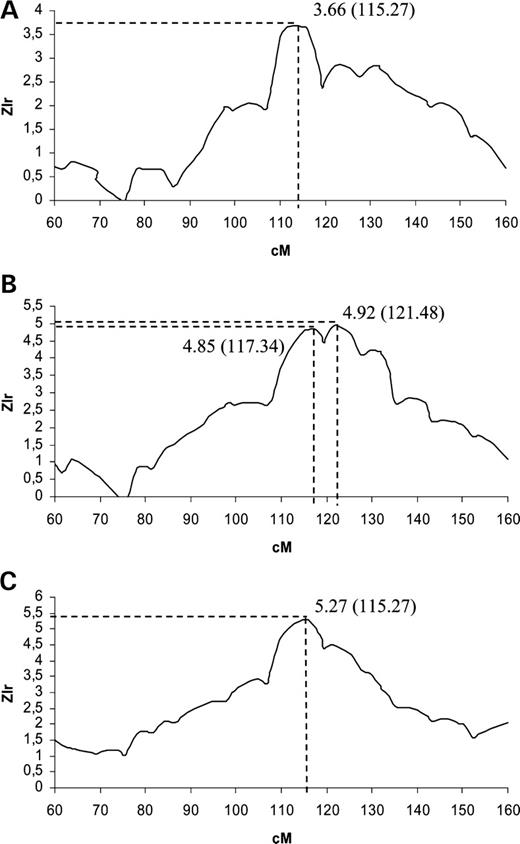
Figure 1. ( A ) Zlr values around the linkage peak on chromosome 8 with the sub-pedigree sets obtained from the Falchi method with random choice of parameters. ( B ) The Falchi method optimized for linkage detection. ( C ) The PCFA method optimized for linkage detection described in Table 1 .
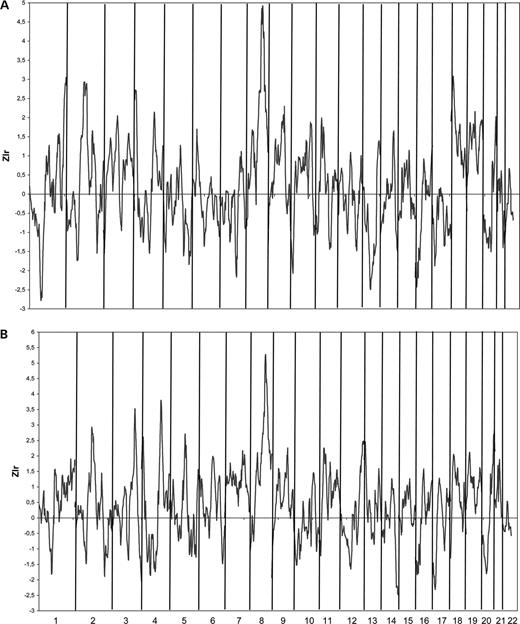
Figure 2. Genome wide screen linkage results with the optimized sub-pedigree sets from the Falchi method ( A ) and the PCFA method ( B ) described in Table 1 .
Characteristics of sub-pedigree sets obtained with the Falchi and PCFA methods
| Parameter choice | Optimizing subsequent linkage analysis | Random | |
|---|---|---|---|
| Falchi a | PCFA b | Falchi c | |
| Number of families | 22 | 25 | 32 |
| Number of genotyped | |||
| Cases | 98 | 118 | 115 |
| Controls | 3 | 6 | 112 |
| Number of generations/family | 3.09 (3–5) | 4.16 (2–9) | 3.56 (3–5) |
| 2 n − fd /family | 8.43 | 11.12 | 11.34 |
| Number of cases/family | 4.55 (3–8) | 4.76 (2–7) | 4.03 (2–11) |
| Kinship between cases/family | 0.132 | 0.114 | 0.107 |
a Clustering step based on affected only, minimum clique size=3, kinship >0.0625. Family reconstruction with maximum number of generations=6.
b Clustering step based on affected only, number of factors=31.
c Clustering step based on affected and unaffected individuals, clique size range=4–12, number of meiotic steps=1–4. Family reconstruction with maximum number of generations=6.
df =number of founders, n =number of non-founders.
Impact on sub-pedigree set characteristics and on linkage analysis of two key parameters for the clustering step in the Falchi method: initial sample of individuals to be clustered and measure of pairwise relationship used in the clustering
| Clique selection based on | Affected only | Affected and unaffected | ||
|---|---|---|---|---|
| Pairwise relationship measure | Number of meiotic steps (1–4) a | Kinship (0.0625) a | Number of meiotic steps (1–5) a | Kinship (0.0315) a |
| Number of families | 21 | 22 | 31 | 33 |
| Number of genotyped | 104 | 104 | 332 | 350 |
| Cases | 98 | 98 | 129 | 136 |
| Controls | 3 | 3 | 181 | 190 |
| Number of generations/family | 3.05 (3–4) | 3.09 (3–5) | 3.97 (3–5) | 4.06 (3–5) |
| Number of cases/family | 4.76 (3–8) | 4.55 (3–8) | 4.58 (2–9) | 4.52 (2–9) |
| Mean kinship between cases/family | 0.127 | 0.132 | 0.087 | 0.086 |
| Information content b | 0.76 | 0.76 | 0.83 | 0.83 |
| Maximum Zlr | 4.90 | 4.92 | 4.38 | 4.79 |
| Position | 123.30 | 121.48 | 115.99 | 123.30 |
| P -value | <0.0044 | <0.0044 | 0.0044 | <0.0044 |
a Values of measure maximizing the linkage result. Results presented are optimized regarding all other parameters (clique size, number of generation for family reconstruction).
b Mean information content on chromosome 8.
Impact on linkage analysis of two key parameters for the clustering step in the Falchi method: minimum clique size and minimum kinship between individuals of the clique
| Minimum clique size a | 2 | 3 | 3 | 4 |
|---|---|---|---|---|
| Kinship coefficient between affected in cliques | ≥0.03125 | ≥0.0625 | ≥0.03125 | ≥0.03125 |
| Number of cases | 141 | 98 | 129 | 112 |
| Information content b | 0.74 | 0.76 | 0.76 | 0.78 |
| Maximum Zlr | 3.81 | 4.92 | 3.51 | 3.53 |
| Position | 115.27 | 121.48 | 115.27 | 115.99 |
a Clustering step based on affected only. Family reconstruction with max number of generations=6.
b Mean information content on chromosome 8.
Impact on linkage analysis of two key parameters for the clustering step in the PCFA method: initial sample of individuals to be clustered and number of factors considered
| Clique selection based on | Affected only | Affected and Unaffected | ||||
|---|---|---|---|---|---|---|
| Number of factors | 27 | 31 | 35 | 71 | 77 | 82 |
| Number of cases | 95 | 118 | 125 | 116 | 110 | 118 |
| Information content a | 0.80 | 0.77 | 0.80 | 0.84 | 0.84 | 0.85 |
| Number of generations/family | 3.94 (2–8) | 4.16 (2–9) | 3.68 (2–8) | 5.03 (3–9) | 4.89 (3–9) | 4.66 (3–9) |
| Mean kinship between cases/family | 0.126 | 0.114 | 0.118 | 0.118 | 0.105 | 0.121 |
| Maximum Zlr | 3.46 | 5.27 | 4.19 | 4.28 | 4.81 | 4.79 |
| Position | 115.99 | 115.27 | 115.27 | 112.94 | 112.94 | 115.99 |
a Mean information content on chromosome 8.
CC-QLS test association results for the 14 markers of the linked region on chromosome 8
| Position | Marker | df | CC-QLS | P -value |
|---|---|---|---|---|
| 106.89 | D8S1778 | 11 | 7.01 | 0.79 |
| 108.05 | D8S1762 | 7 | 5.01 | 0.65 |
| 110.62 | D8S521 | 6 | 17.4 | 0.007 |
| 115.27 | D8S1784 | 7 | 12.4 | 0.08 |
| 115.98 | D8S1132 | 8 | 8.52 | 0.38 |
| 118.70 | D8S1470 | 5 | 3.42 | 0.63 |
| 119.26 | D8S1779 | 8 | 18.33 | 0.018 |
| 119.65 | D8S281 | 6 | 3.25 | 0.77 |
| 123.30 | D8S1823 | 7 | 3.29 | 0.85 |
| 127.60 | D8S514 | 7 | 8.57 | 0.28 |
| 131.79 | D8S1799 | 9 | 6.84 | 0.65 |
| 132.39 | D8S1461 | 6 | 8.2 | 0.22 |
| 135.12 | D8S1793 | 10 | 16.58 | 0.08 |
Characteristics of individuals used in the linkage analysis
| Affected | Unaffected | |
|---|---|---|
| N | 173 | 216 |
| Male ( N ) | 77 | 98 |
| Female ( N ) | 96 | 118 |
| Age (mean ± SD) | 64.88±12.22 | 45.17±16.24 |
| Per cent with treatment | 85.7 | — |
| SBP (mmHg) (mean ± SD) | 142.79±16.45 | 121.33±13.11 |
| DBP (mmHg) (mean ± SD) | 83.15±10.00 | 75.97±7.04 |
| BMI (mean ± SD) | 28.26±4.93 | 25.88±4.04 |
| Kinship (mean ± SD) | 0.0084±0.022 | 0.0076±0.021 |
| Inbreeding (mean ± SD) | 0.0077±0.012 | 0.0053±0.008 |
References
Glynn, R.J. and Rosner, B. (
Wiederkehr, M., Toto, R., Fenves, A.Z. and Ram, C.V. (
Snieder, H., Harshfield, G.A. and Treiber, F.A. (
Mein, C.A., Caulfield, M.J., Dobson, R.J. and Munroe, P.B. (
Peltonen, L., Palotie, A. and Lange, K. (
Arcos-Burgos, M. and Muenke, M. (
Dyer, T.D., Blangero, J., Williams, J.T., Goring, H.H. and Mahaney, M.C. (
Bourgain, C. and Genin, E. (
Chapman, N.H. and Wijsman, E.M. (
Pankratz, V.S. and Iturria, S.J. (
Falchi, M., Forabosco, P., Mocci, E., Borlino, C.C., Picciau, A., Virdis, E., Persico, I., Parracciani, D., Angius, A. and Pirastu, M. (
Jeunemaitre, X., Soubrier, F., Kotelevtsev, Y.V., Lifton, R.P., Williams, C.S., Charru, A., Hunt, S.C., Hopkins, P.N., Williams, R.R., Lalouel, J.M. et al . (
Cusi, D., Barlassina, C., Azzani, T., Casari, G., Citterio, L., Devoto, M., Glorioso, N., Lanzani, C., Manunta, P., Righetti, M. et al . (
Sun, L., Abney, M. and McPeek, M.S. (
Sullivan, C.C., Du, L., Chu, D., Cho, A.J., Kido, M., Wolf, P.L., Jamieson, S.W. and Thistlethwaite, P.A. (
Nadar, S.K., Blann, A.D. and Lip, G.Y. (
Tevosian, S.G., Deconinck, A.E., Tanaka, M., Schinke, M., Litovsky, S.H., Izumo, S., Fujiwara, Y. and Orkin, S.H. (
Williams, B., Poulter, N.R., Brown, M.J., Davis, M., McInnes, G.T., Potter, J.F., Sever, P.S. and Thom, S.M. (
Committee E.S.o.H.-E.S.o.C.G. (
Giampoli, S. and Vannuzzo, D. (
O'Connell, J.R. and Weeks, D.E. (
McPeek, M.S., Wu, X. and Ober, C. (
Agarwala, R., Biesecker, L.G., Hopkins, K.A., Francomano, C.A. and Schaffer, A.A. (
Kong, A. and Cox, N.J. (
Gudbjartsson, D.F., Jonasson, K., Frigge, M.L. and Kong, A. (
