


Abstract
Drug dependence (DD) is commonly co-morbid with alcohol dependence (AD). Many studies have also shown common genetic risk factors for these disorders. We previously reported associations of AD with seven alcohol dehydrogenase (ADH) genes. The present study examines the relationship between these genes and DD. We genotyped 16 markers within the ADH gene cluster and 38 unlinked ancestry-informative markers in a case–control sample of 718 individuals. All markers were consistent with Hardy–Weinberg equilibrium in controls, but some markers showed Hardy–Weinberg disequilibrium in cases (minimal P = 0.002). Genotypes of many markers were associated with DD, both before and after controlling for admixture effects (minimal P < 1.0 × 10⁻⁶). Diplotype trend regression analysis showed that ADH5 and ADH6 genotypes, and diplotypes at ADH1A, ADH1B, ADH1C and ADH7 (minimal P = 0.002), were associated with DD in European-Americans and/or African-Americans. This first report of an allelic association of these loci with DD provides new insight into the mechanism of genetic risk for DD. These findings, obtained using a series of powerful and reliable analytic methods, may also help to explain the high rate of co-morbidity between AD and DD.
INTRODUCTION
Drug dependence (DD), which refers to cocaine dependence (CD) and/or opioid dependence (OD) in the context of the present study, results in serious medical, legal, social and psychiatric problems and influences many facets of American society, cutting across geographical region, race, ethnicity and socioeconomic status. Cocaine is second only to cannabis as the most commonly used illicit drug in the USA; OD has a lifetime prevalence of 0.4%, and the combined lifetime prevalence of OD and opioid abuse is 0.7%. Risk for DD is influenced by genetic factors, as demonstrated by adoption studies (in the general case of substance dependence) and by twin studies [summarized by Gelernter et al. (1,2)]. Elucidating the genetic basis of DD would represent major progress toward understanding the etiology of this disorder.
A genome-wide scan located possible risk regions for CD or CD-related traits at chromosomes 10 [in mixed European-American (EA) and African-American (AA) samples], 3 and 12 (in EAs) and 9 and 18 (in AAs) (1) and located risk regions for OD at chromosomes 17 (in EAs and AAs) and 2 (in AAs) (2). Many population-based case–control association studies have also examined the molecular genetics of DD (3–6). The present study focused on the roles of the alcohol dehydrogenase (ADH) genes in risk for DD.
Seven ADH genes are located in a cluster within an ∼364 kilobase (kb) region at 4q21–25. We recently studied 16 ADH markers in relation to alcohol dependence (AD) [MIM 103780] (7). These ADH markers span 346 327 bp, covering 95% of the full length of the ADH gene cluster, with an average intermarker distance of 21.6 kb, including one ADH5 [MIM 103710] marker (located in a haplotype block that covers 80% of the full length of ADH5), one ADH6 [MIM 103735] marker (located in a haplotype block that covers the full length of ADH6), three ADH1A [MIM 103700] markers, four ADH1B [MIM 103720] markers, three ADH1C [MIM 103730] markers and four ADH7 [MIM 600086] markers (Table 1). The ADH markers were located in several haplotype blocks. Genotype frequency distributions of all markers were in Hardy–Weinberg equilibrium (HWE) in both EA and AA controls, but some of the markers were in Hardy–Weinberg disequilibrium (HWD) in either EA or AA subjects with AD. Genotypes of some ADH markers were associated with AD, even after controlling for admixture effects. Diplotype trend regression (DTR) analysis demonstrated that most of the genes studied were risk loci for AD (7). Most of these findings were consistent in an independent sample of pedigrees by investigators in the Collaborative Study on the Genetics of Alcoholism (COGA) (8).
The information of ADH markers examined in the study
| Marker | rs no. or hcv no. | Alias | Substitution | Amino acid |
|---|---|---|---|---|
| ADH5∧SNP1 | rs1154400 | C/T | ||
| ADH4∧SNP2 | hcv2033010 | T/C | ||
| ADH4∧SNP3 | rs1042364 | G/A | Gly/Arg | |
| ADH4∧SNP4 | rs1126671 | G/A | Val/Ile | |
| ADH4∧SNP5 | rs1126670 | T/G | Pro/Pro | |
| ADH4∧SNP6 | rs7694646 | A/T | ||
| ADH4∧SNP7 | rs1800759 | A-75C | A/C | |
| ADH4∧SNP8 | rs1984362 | C/T | ||
| ADH6∧SNP9 | hcv320091 | A/T | ||
| ADH1A∧SNP10 | rs6837311 | A/T | ||
| ADH1A∧SNP11 | rs975833 | C/G | ||
| ADH1A∧SNP12 | rs1229966 | A/G | ||
| ADH1B∧SNP13 | rs1042026 | C/T | ||
| ADH1B∧SNP14 | rs2066702 | ADH2*1/3 | C/T | Arg/Cys |
| ADH1B∧SNP15 | rs2066701 | C96T | C/T | |
| ADH1B∧SNP16 | rs1229984 | ADH2*1/2 | G/A | Arg/His |
| ADH1C∧SNP17 | rs698 | ADH3*1/2 | A/G | Ile/Val |
| ADH1C∧SNP18 | rs1693482 | A/G | Gln/Arg | |
| ADH1C∧SNP19 | rs1693427 | C/T | ||
| ADH7∧SNP20 | rs284786 | A/T | ||
| ADH7∧SNP21 | rs971074 | C/T | Arg/Arg | |
| ADH7∧SNP22 | rs1573496 | C/G | Ala/Gly | |
| ADH7∧SNP23 | rs1154470 | A/G |
Our initial hypothesis was that, because the ADH genes are specifically involved in the metabolism of ethanol, their risk effects would be limited to AD. However, several studies have shown that the susceptibility to AD attributable to gene variation is shared with susceptibility to disorders that are commonly co-morbid with AD. A typical example is DD, one of the most common phenotypes co-morbid with AD (9). DD has many features in common with AD, including symptomatology, neuropsychological impairment, hypothesized pathogenetic mechanisms and response to specific treatments, especially (in the case of CD) disulfiram, an ALDH2 inhibitor that has been used for more than 50 years for the treatment of AD. Further, DD has been reported to share some susceptibility genes with AD (10–12). For example, we previously observed that variation at the ADH4 locus [MIM 103740] and CHRM2 locus [MIM 118493] affected risk for both AD and DD (4–6). In addition, OPRM1 variation has been reported to affect susceptibility to AD and/or DD (3,13–16). That AD and DD share common genetic risk factors may partially underlie their high rate of co-morbidity.
Thus, in the present study, we investigated the relationships between ADH genes and DD on the basis of our initial findings for AD and tested the phenotypic specificity of these genes for risk of AD and DD. To accomplish this, we genotyped the same marker set, including 16 ADH markers and 38 ancestry informative markers (AIMs), using the same genotyping methods employed in the initial study (7). We performed all analyses separately within ‘genetic’ EAs (European ancestry proportion>0.5) and ‘genetic’ AAs (African ancestry proportion>0.5).
RESULTS
Genotype frequency distributions of all markers (Table 2) were in HWE in controls in both EAs and AAs, but many ADH markers were nominally in significant (P<0.03), modest (0.03≤P≤0.05) or suggestive (0.05<P<0.09) HWD in either EA or AA subjects with DD (Table 3), including ADH5∧SNP1, ADH1B∧Arg/His (SNP16: previously called ADH2*1/2), ADH7∧SNP21 and ADH7∧Ala/Gly (SNP22) in EA DD; ADH1C∧Ile/Val (SNP17: previously called ADH3*1/2) and ADH1C∧SNP19 in EA DD-only (i.e. in the absence of AD); ADH1B∧Arg/His, ADH1C∧Ile/Val, ADH1C∧Gln/Arg (SNP18) and ADH1C∧SNP19 in AA DD and ADH6∧SNP9, ADH1A∧SNP11, ADH1B∧Arg/Cys (SNP14: previously called ADH2*1/3), ADH7∧SNP21 and ADH7∧SNP23 in AA DD-only. Seven ADH4 markers were also in significant HWD in EA cases, as reported previously (6). These results indicate the existence of associations between these genes and DD.
Genotype and allele frequencies in EAs and AAs
| Marker | Genotype and allele | EAs | AAs | ||||||||||
|---|---|---|---|---|---|---|---|---|---|---|---|---|---|
| DD | DD-only | Controls | DD | DD-only | Controls | ||||||||
| n | f | n | f | n | f | n | f | n | f | n | f | ||
| ADH5∧SNP1 | T/T | 97 | 0.483 | 24 | 0.364 | 136 | 0.459 | 71 | 0.504 | 29 | 0.558 | 20 | 0.417 |
| ADH5∧SNP1 | T/C | 71 | 0.353 | 27 | 0.409 | 135 | 0.456 | 63 | 0.447 | 21 | 0.404 | 24 | 0.500 |
| ADH5∧SNP1 | C/C | 33 | 0.164 | 15 | 0.227 | 25 | 0.084 | 7 | 0.050 | 2 | 0.038 | 4 | 0.083 |
| ADH5∧SNP1 | T | 265 | 0.659 | 75 | 0.568 | 407 | 0.688 | 205 | 0.727 | 79 | 0.760 | 64 | 0.667 |
| ADH5∧SNP1 | C | 137 | 0.341 | 57 | 0.432 | 185 | 0.313 | 77 | 0.273 | 25 | 0.240 | 32 | 0.333 |
| ADH6∧SNP9 | T/T | 65 | 0.319 | 15 | 0.214 | 83 | 0.278 | 108 | 0.755 | 44 | 0.800 | 35 | 0.729 |
| ADH6∧SNP9 | A/T | 95 | 0.466 | 34 | 0.486 | 140 | 0.468 | 30 | 0.210 | 9 | 0.164 | 13 | 0.271 |
| ADH6∧SNP9 | A/A | 44 | 0.216 | 21 | 0.300 | 76 | 0.254 | 5 | 0.035 | 2 | 0.036 | 0 | 0.000 |
| ADH6∧SNP9 | T | 225 | 0.551 | 64 | 0.457 | 306 | 0.512 | 246 | 0.860 | 97 | 0.882 | 83 | 0.865 |
| ADH6∧SNP9 | A | 183 | 0.449 | 76 | 0.543 | 292 | 0.488 | 40 | 0.140 | 13 | 0.118 | 13 | 0.135 |
| ADH1A∧SNP10 | T/T | 84 | 0.408 | 20 | 0.290 | 106 | 0.353 | 121 | 0.840 | 51 | 0.895 | 37 | 0.787 |
| ADH1A∧SNP10 | A/T | 94 | 0.456 | 35 | 0.507 | 142 | 0.473 | 23 | 0.160 | 6 | 0.105 | 10 | 0.213 |
| ADH1A∧SNP10 | A/A | 28 | 0.136 | 14 | 0.203 | 52 | 0.173 | 0 | 0.000 | 0 | 0.000 | 0 | 0.000 |
| ADH1A∧SNP10 | T | 262 | 0.636 | 75 | 0.543 | 354 | 0.590 | 265 | 0.920 | 108 | 0.947 | 84 | 0.894 |
| ADH1A∧SNP10 | A | 150 | 0.364 | 63 | 0.457 | 246 | 0.410 | 23 | 0.080 | 6 | 0.053 | 10 | 0.106 |
| ADH1A∧SNP11 | G/G | 120 | 0.591 | 41 | 0.586 | 169 | 0.569 | 76 | 0.528 | 23 | 0.404 | 21 | 0.438 |
| ADH1A∧SNP11 | C/G | 75 | 0.369 | 28 | 0.400 | 108 | 0.364 | 52 | 0.361 | 21 | 0.368 | 26 | 0.542 |
| ADH1A∧SNP11 | C/C | 8 | 0.039 | 1 | 0.014 | 20 | 0.067 | 16 | 0.111 | 13 | 0.228 | 1 | 0.021 |
| ADH1A∧SNP11 | G | 315 | 0.776 | 110 | 0.786 | 446 | 0.751 | 204 | 0.708 | 67 | 0.588 | 68 | 0.708 |
| ADH1A∧SNP11 | C | 91 | 0.224 | 30 | 0.214 | 148 | 0.249 | 84 | 0.292 | 47 | 0.412 | 28 | 0.292 |
| ADH1A∧SNP12 | A/A | 80 | 0.394 | 34 | 0.493 | 123 | 0.423 | 19 | 0.133 | 7 | 0.121 | 3 | 0.063 |
| ADH1A∧SNP12 | A/G | 97 | 0.478 | 29 | 0.420 | 127 | 0.436 | 57 | 0.399 | 19 | 0.328 | 24 | 0.500 |
| ADH1A∧SNP12 | G/G | 26 | 0.128 | 6 | 0.087 | 41 | 0.141 | 67 | 0.469 | 32 | 0.552 | 21 | 0.438 |
| ADH1A∧SNP12 | A | 257 | 0.633 | 97 | 0.703 | 373 | 0.641 | 95 | 0.332 | 33 | 0.284 | 30 | 0.313 |
| ADH1A∧SNP12 | G | 149 | 0.367 | 41 | 0.297 | 209 | 0.359 | 191 | 0.668 | 83 | 0.716 | 66 | 0.688 |
| ADH1B∧SNP13 | T/T | 103 | 0.512 | 36 | 0.545 | 154 | 0.520 | 121 | 0.840 | 48 | 0.828 | 43 | 0.915 |
| ADH1B∧SNP13 | T/C | 84 | 0.418 | 28 | 0.424 | 115 | 0.389 | 22 | 0.153 | 10 | 0.172 | 4 | 0.085 |
| ADH1B∧SNP13 | C/C | 14 | 0.070 | 2 | 0.030 | 27 | 0.091 | 1 | 0.007 | 0 | 0.000 | 0 | 0.000 |
| ADH1B∧SNP13 | T | 290 | 0.721 | 100 | 0.758 | 423 | 0.715 | 264 | 0.917 | 106 | 0.914 | 90 | 0.957 |
| ADH1B∧SNP13 | C | 112 | 0.279 | 32 | 0.242 | 169 | 0.285 | 24 | 0.083 | 10 | 0.086 | 4 | 0.043 |
| ADH1B∧SNP14 | C/C | 198 | 1.000 | 65 | 1.000 | 280 | 1.000 | 96 | 0.696 | 33 | 0.600 | 24 | 0.511 |
| ADH1B∧SNP14 | T/C | 0 | 0.000 | 0 | 0.000 | 0 | 0.000 | 35 | 0.254 | 16 | 0.291 | 22 | 0.468 |
| ADH1B∧SNP14 | T/T | 0 | 0.000 | 0 | 0.000 | 0 | 0.000 | 7 | 0.051 | 6 | 0.109 | 1 | 0.021 |
| ADH1B∧SNP14 | C | 398 | 1.000 | 130 | 1.000 | 560 | 1.000 | 227 | 0.822 | 82 | 0.745 | 70 | 0.745 |
| ADH1B∧SNP14 | T | 0 | 0.000 | 0 | 0.000 | 0 | 0.000 | 49 | 0.178 | 28 | 0.255 | 24 | 0.255 |
| ADH1B∧SNP15 | C/C | 97 | 0.513 | 36 | 0.571 | 116 | 0.487 | 112 | 0.818 | 43 | 0.782 | 43 | 0.915 |
| ADH1B∧SNP15 | T/C | 82 | 0.434 | 25 | 0.397 | 101 | 0.424 | 24 | 0.175 | 12 | 0.218 | 4 | 0.085 |
| ADH1B∧SNP15 | T/T | 10 | 0.053 | 2 | 0.032 | 21 | 0.088 | 1 | 0.007 | 0 | 0.000 | 0 | 0.000 |
| ADH1B∧SNP15 | C | 276 | 0.730 | 97 | 0.770 | 333 | 0.700 | 248 | 0.905 | 98 | 0.891 | 90 | 0.957 |
| ADH1B∧SNP15 | T | 102 | 0.270 | 29 | 0.230 | 143 | 0.300 | 26 | 0.095 | 12 | 0.109 | 4 | 0.043 |
| ADH1B∧SNP16 | G/G | 160 | 0.904 | 51 | 0.836 | 215 | 0.888 | 117 | 0.967 | 43 | 0.935 | 41 | 0.953 |
| ADH1B∧SNP16 | A/G | 16 | 0.090 | 10 | 0.164 | 27 | 0.112 | 4 | 0.033 | 3 | 0.065 | 2 | 0.047 |
| ADH1B∧SNP16 | A/A | 1 | 0.006 | 0 | 0.000 | 0 | 0.000 | 0 | 0.000 | 0 | 0.000 | 0 | 0.000 |
| ADH1B∧SNP16 | G | 336 | 0.949 | 112 | 0.918 | 457 | 0.944 | 238 | 0.983 | 89 | 0.967 | 84 | 0.977 |
| ADH1B∧SNP16 | A | 18 | 0.051 | 10 | 0.082 | 27 | 0.056 | 4 | 0.017 | 3 | 0.033 | 2 | 0.023 |
| ADH1C∧SNP17 | A/A | 64 | 0.348 | 15 | 0.254 | 105 | 0.376 | 85 | 0.669 | 38 | 0.792 | 35 | 0.761 |
| ADH1C∧SNP17 | A/G | 93 | 0.505 | 37 | 0.627 | 126 | 0.452 | 42 | 0.331 | 10 | 0.208 | 10 | 0.217 |
| ADH1C∧SNP17 | G/G | 27 | 0.147 | 7 | 0.119 | 48 | 0.172 | 0 | 0.000 | 0 | 0.000 | 1 | 0.022 |
| ADH1C∧SNP17 | A | 221 | 0.601 | 67 | 0.568 | 336 | 0.602 | 212 | 0.835 | 86 | 0.896 | 80 | 0.870 |
| ADH1C∧SNP17 | G | 147 | 0.399 | 51 | 0.432 | 222 | 0.398 | 42 | 0.165 | 10 | 0.104 | 12 | 0.130 |
| ADH1C∧SNP18 | G/G | 75 | 0.371 | 21 | 0.309 | 113 | 0.382 | 99 | 0.683 | 45 | 0.789 | 38 | 0.792 |
| ADH1C∧SNP18 | A/G | 97 | 0.480 | 39 | 0.574 | 130 | 0.439 | 46 | 0.317 | 12 | 0.211 | 9 | 0.188 |
| ADH1C∧SNP18 | A/A | 30 | 0.149 | 8 | 0.118 | 53 | 0.179 | 0 | 0.000 | 0 | 0.000 | 1 | 0.021 |
| ADH1C∧SNP18 | G | 247 | 0.611 | 81 | 0.596 | 356 | 0.601 | 244 | 0.841 | 102 | 0.895 | 85 | 0.885 |
| ADH1C∧SNP18 | A | 157 | 0.389 | 55 | 0.404 | 236 | 0.399 | 46 | 0.159 | 12 | 0.105 | 11 | 0.115 |
| ADH1C∧SNP19 | T/T | 68 | 0.360 | 17 | 0.288 | 111 | 0.370 | 95 | 0.699 | 43 | 0.768 | 38 | 0.792 |
| ADH1C∧SNP19 | T/C | 91 | 0.481 | 35 | 0.593 | 132 | 0.440 | 41 | 0.301 | 13 | 0.232 | 9 | 0.188 |
| ADH1C∧SNP19 | C/C | 30 | 0.159 | 7 | 0.119 | 57 | 0.190 | 0 | 0.000 | 0 | 0.000 | 1 | 0.021 |
| ADH1C∧SNP19 | T | 227 | 0.601 | 69 | 0.585 | 354 | 0.590 | 231 | 0.849 | 99 | 0.884 | 85 | 0.885 |
| ADH1C∧SNP19 | C | 151 | 0.399 | 49 | 0.415 | 246 | 0.410 | 41 | 0.151 | 13 | 0.116 | 11 | 0.115 |
| ADH7∧SNP20 | T/T | 105 | 0.522 | 39 | 0.582 | 147 | 0.497 | 41 | 0.281 | 16 | 0.276 | 9 | 0.188 |
| ADH7∧SNP20 | A/T | 77 | 0.383 | 23 | 0.343 | 116 | 0.392 | 71 | 0.486 | 23 | 0.397 | 22 | 0.458 |
| ADH7∧SNP20 | A/A | 19 | 0.095 | 5 | 0.075 | 33 | 0.111 | 34 | 0.233 | 19 | 0.328 | 17 | 0.354 |
| ADH7∧SNP20 | T | 287 | 0.714 | 101 | 0.754 | 410 | 0.693 | 153 | 0.524 | 55 | 0.474 | 40 | 0.417 |
| ADH7∧SNP20 | A | 115 | 0.286 | 33 | 0.246 | 182 | 0.307 | 139 | 0.476 | 61 | 0.526 | 56 | 0.583 |
| ADH7∧SNP21 | C/C | 158 | 0.775 | 53 | 0.779 | 225 | 0.771 | 104 | 0.712 | 48 | 0.828 | 24 | 0.511 |
| ADH7∧SNP21 | T/C | 40 | 0.196 | 15 | 0.221 | 62 | 0.212 | 35 | 0.240 | 7 | 0.121 | 20 | 0.426 |
| ADH7∧SNP21 | T/T | 6 | 0.029 | 0 | 0.000 | 5 | 0.017 | 7 | 0.048 | 3 | 0.052 | 3 | 0.064 |
| ADH7∧SNP21 | C | 356 | 0.873 | 121 | 0.890 | 512 | 0.877 | 243 | 0.832 | 103 | 0.888 | 68 | 0.723 |
| ADH7∧SNP21 | T | 52 | 0.127 | 15 | 0.110 | 72 | 0.123 | 49 | 0.168 | 13 | 0.112 | 26 | 0.277 |
| ADH7∧SNP22 | G/G | 163 | 0.795 | 54 | 0.783 | 242 | 0.796 | 142 | 0.979 | 57 | 0.983 | 44 | 0.936 |
| ADH7∧SNP22 | C/G | 36 | 0.176 | 15 | 0.217 | 56 | 0.184 | 3 | 0.021 | 1 | 0.017 | 3 | 0.064 |
| ADH7∧SNP22 | C/C | 6 | 0.029 | 0 | 0.000 | 6 | 0.020 | 0 | 0.000 | 0 | 0.000 | 0 | 0.000 |
| ADH7∧SNP22 | G | 362 | 0.883 | 123 | 0.891 | 540 | 0.888 | 287 | 0.990 | 115 | 0.991 | 91 | 0.968 |
| ADH7∧SNP22 | C | 48 | 0.117 | 15 | 0.109 | 68 | 0.112 | 3 | 0.010 | 1 | 0.009 | 3 | 0.032 |
| ADH7∧SNP23 | G/G | 83 | 0.439 | 28 | 0.452 | 133 | 0.455 | 103 | 0.763 | 47 | 0.855 | 36 | 0.750 |
| ADH7∧SNP23 | A/G | 81 | 0.429 | 25 | 0.403 | 118 | 0.404 | 31 | 0.230 | 7 | 0.127 | 11 | 0.229 |
| ADH7∧SNP23 | A/A | 25 | 0.132 | 9 | 0.145 | 41 | 0.140 | 1 | 0.007 | 1 | 0.018 | 1 | 0.021 |
| ADH7∧SNP23 | G | 247 | 0.653 | 81 | 0.653 | 384 | 0.658 | 237 | 0.878 | 101 | 0.918 | 83 | 0.865 |
| ADH7∧SNP23 | A | 131 | 0.347 | 43 | 0.347 | 200 | 0.342 | 33 | 0.122 | 9 | 0.082 | 13 | 0.135 |
DD, drug dependence; DD-only, DD in observe of alcohol dependence; n, individual number (for genotype) or chromosome number (for allele); f, frequency. The expected genotype frequencies (p2, 2pg and q2) can be derived from the observed allele frequencies (p and q).
P-values for HWE tests in EAs and AAs
| Marker | EAs | AAs | ||
|---|---|---|---|---|
| DD | DD-only | DD | DD-only | |
| ADH5∧SNP1 | 0.0016 | — | — | — |
| ADH6∧SNP9 | — | — | 0.068 | 0.018 |
| ADH1A∧SNP11 | — | — | — | 0.061 |
| ADH1B∧SNP14 | N/A | N/A | 0.080 | 0.080 |
| ADH1B∧SNP16 | 0.060 | — | 0.025 | — |
| ADH1C∧SNP17 | — | 0.038 | 0.006 | — |
| ADH1C∧SNP18 | — | — | 0.011 | — |
| ADH1C∧SNP19 | — | 0.056 | 0.015 | — |
| ADH7∧SNP21 | 0.047 | — | — | 0.015 |
| ADH7∧SNP22 | 0.037 | — | — | — |
| ADH7∧SNP23 | — | — | — | 0.031 |
N/A, not applicable due to non-polymorphic or rare frequency; absence of a P-value denotes P>0.10; markers with P>0.10 in all phenotype groups (including controls) are not listed.
Using case–control comparison (P values shown in Table 6), we found that, in EAs, ADH5∧SNP1 was nominally associated with DD, and ADH5∧SNP1 and ADH1C∧Ile/Val (SNP17) were nominally associated with DD-only, both before and after controlling for admixture effects. Genotypes of seven ADH4 markers were also significantly associated with DD in EAs, as reported elsewhere (6). In AAs, ADH1A∧SNP11, ADH1B∧Arg/Cys (SNP14) and ADH7∧SNP21 were associated with DD, and ADH1A∧SNP11, ADH1B∧SNP15 and ADH7∧SNP21 were associated with DD-only, both before and after controlling for admixture effects. ADH1C∧Ile/Val (SNP17), ADH1C∧Gln/Arg (SNP18), ADH1C∧SNP19, and ADH7∧Ala/Gly (SNP22) were associated with DD, and ADH1B∧Arg/Cys (SNP14) was associated with DD-only, before controlling for admixture effects. As shown in Table 2, across different case subgroups, the over-represented heterozygotes (within ADH1C) or homozygotes (within other genes) for all markers in significant HWD (i.e. whose observed frequencies were higher than the expected frequencies) were always the same as the risk genotypes in the case–control comparison analysis (i.e. whose frequencies in cases were higher than those in controls).
After correction for multiple comparisons using SNPSpD (an effective Bonferroni-type correction) (17), only ADH5∧SNP1 remained in significant HWD in EA DD (P = 0.0016; α = 0.0033), and only ADH7∧SNP21 remained significantly associated with AA DD-only (P = 0.0006 and P<10−6 before and after controlling for admixture effects, respectively; α = 0.0017) (Table 6).
DTR analysis demonstrated that several genes contributed to the risk for DD (Table 4). In EAs and/or AAs, genotypes of ADH5∧SNP1 and ADH6∧SNP9 and some diplotypes at the ADH1A, ADH1B, ADH1C and ADH7 genes were associated with DD. Some of these risk diplotypes exerted consistent effects on phenotypes across EAs and AAs: diplotype ACGG/TCGG at ADH7 increased risk for disease in both populations (β>0). Some of the risk genotypes or diplotypes exerted opposite effects on phenotypes in EAs and in AAs: all of the diplotypes at ADH1A increased risk for DD in EAs (β>0), but protected against DD in AAs (β<0) [many other rare ADH1A diplotypes (f<5%) were not entered into the regression model (Table 4), and the effects of ADH1A diplotypes were referenced to all the covariates and the other five ADH genes]; diplotype AGT/GAC at ADH1C protected against DD in EAs (β<0), but increased risk for DD in AAs (β>0). Some of these risk diplotypes exerted effects on phenotypes only in EAs: diplotype CCTG/CCTG at ADH1B and diplotype TCGA/TCGA at ADH7 increased risk for DD (β>0); diplotypes AGT/AGT and GAC/GAC at ADH1C protected against DD (β<0). Some of these risk diplotypes exerted effects on phenotype only in AAs: genotype T/T of ADH6∧SNP9 and diplotypes TCCG/TCCG and TTCG/TCCG at ADH1B protected against DD (β<0); diplotype TCGG/TCGG at ADH7 increased risk for DD (β>0). All of the above risk genotypes and diplotypes exerted consistent effects both for DD and DD-only (i.e. in the absence of AD). Table 4 lists only those variables that remained in the last step of the DTR equations.
DTR analysis in EAs and AAs
| EAs | AAs | ||||||
|---|---|---|---|---|---|---|---|
| Variables | f | P(β) | Variables | f | P(β) | ||
| DD | DD-only | DD | DD-only | ||||
| European ancestry | 0.0317(−) | ||||||
| Male | 2.8E−05(+) | 0.0001(+) | Male | 0.0110(+) | |||
| Age | 2.8E−17(+) | 3.9E−08(+) | Age | 0.0113(+) | |||
| ADH5: C/C | 0.0035(+) | ADH6: T/T | 0.0880(−) | ||||
| ADH1A: AGA/TGA | 0.203 | 0.0167(+) | 0.0019(+) | ADH1A: AGA/TCG | 0.057 | 0.0354(−) | |
| AGA/TCG | 0.181 | 0.0167(+) | 0.0019(+) | ADH1B: TCCG/TCCG | 0.425 | 0.0112(−) | 0.0209(−) |
| AGA/AGA | 0.164 | 0.0168(+) | 0.0019(+) | TTCG/TCCG | 0.270 | 0.0018(−) | 0.0036(−) |
| TCG/TGA | 0.109 | 0.0167(+) | 0.0019(+) | TCCG/CCTG | 0.113 | 0.0698(−) | |
| AGA/TGG | 0.088 | 0.0168(+) | 0.0019(+) | ADH1C: AGT/GAC | 0.275 | 0.0252(+) | |
| TGA/TGA | 0.060 | 0.0166(+) | 0.0019(+) | ADH7: ACGG/TCGG | 0.216 | 0.0122(+) | 0.0114(+) |
| TCG/TGG | 0.060 | 0.0168(+) | 0.0019(+) | ACGG/ACGG | 0.124 | 0.0035(+) | |
| TGA/TGG | 0.057 | 0.0166(+) | 0.0019(+) | TCGG/TCGG | 0.108 | 0.0445(+) | 0.0035(+) |
| ADH1B: CCTG/CCTG | 0.075 | 0.0189(+) | |||||
| ADH1C: AGT/AGT | 0.445 | 0.0033(−) | |||||
| AGT/GAC | 0.353 | 0.0357(−) | 0.0028(−) | ||||
| GAC/GAC | 0.175 | 0.0031(−) | |||||
| ADH7: ACGG/TCGG | 0.094 | 0.0841(+) | |||||
| TCGA/TCGA | 0.039 | 0.0642(+) | |||||
P, P-values; β, regression coefficient; only the signs, but not the values, of β are shown in this table (+ values of β reflect increased risk of the disorder when the diplotype is present; − values reflect a protective effect of the diplotype). The diplotype frequencies (f) in cases+controls within EAs and AAs are listed.
There are several peak J-values among the ADH markers in both EAs and AAs, which may indicate the proximity of risk alleles for both DD and DD-only (Table 5; Fig. 1). For DD, the highest J peak in the ADH gene cluster is at a functional variant, ADH1B∧Arg/His (SNP16) (|J| = 1.185 in EAs, 1.000 in AAs); for DD-only, the highest J peak is at ADH7∧SNP21 (7.8 kb from SNP22) (|J| = 1.000 in EAs, 3.118 in AAs). Other J peaks and the exact J-values can be seen in Figure 1 and Table 5, respectively. Figure 1 does not include J peaks for AD, for which the exact J-values were shown in Table 5; that figure was reported previously (7).
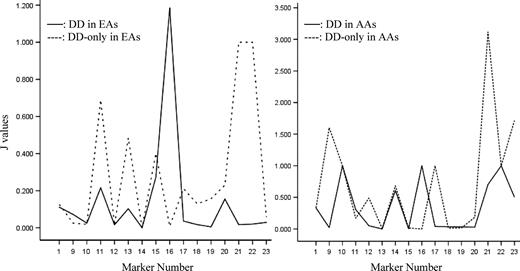
Fine-mapping the risk alleles at the ADH gene cluster in EAs and AAs according to the J-values. X-axis represents the marker names which correspond to the order as presented in Table 1; Y-axis represents the J-values. Note that SNPs 2 to 8 are not included in this figure; data regarding these markers (in ADH4) were reported previously (6).
J values for each marker in two populations
| SNPs | EAs | AAs | ||||
|---|---|---|---|---|---|---|
| AD | DD | DD-only | AD | DD | DD-only | |
| 1 | 0.051 | 0.111 | 0.126 | 0.439 | 0.334 | 0.334 |
| 9 | 0.014 | 0.072 | 0.025 | 0.010 | 0.021 | 1.604 |
| 10 | 0.018 | 0.025 | 0.019 | 1.000 | 1.000 | 1.000 |
| 11 | 0.047 | 0.216 | 0.689 | 0.182 | 0.306 | 0.168 |
| 12 | 0.030 | 0.016 | 0.015 | 0.009 | 0.051 | 0.491 |
| 13 | 0.226 | 0.103 | 0.484 | 0.004 | 0.000 | 0.009 |
| 14 | 0.000 | 0.000 | 0.000 | 0.112 | 0.609 | 0.684 |
| 15 | 0.041 | 0.273 | 0.401 | 0.004 | 0.002 | 0.015 |
| 16 | 11.667 | 1.185 | 0.008 | 1.000 | 1.000 | 0.001 |
| 17 | 0.061 | 0.036 | 0.211 | 0.053 | 0.039 | 1.000 |
| 18 | 0.072 | 0.017 | 0.129 | 0.048 | 0.036 | 0.014 |
| 19 | 0.070 | 0.005 | 0.157 | 0.038 | 0.032 | 0.017 |
| 20 | 0.055 | 0.155 | 0.230 | 0.149 | 0.028 | 0.185 |
| 21 | 0.004 | 0.017 | 1.000 | 0.135 | 0.703 | 3.118 |
| 22 | 0.006 | 0.020 | 1.000 | 1.000 | 1.000 | 1.000 |
| 23 | 0.007 | 0.029 | 0.058 | 0.030 | 0.504 | 1.716 |
SNP numbers correspond to Table 1.
DISCUSSION
ADH genes have been shown to be important risk factors for AD in EAs and AAs in our initial study (7). In this study, we present the first comprehensive evidence that these genes (specifically ADH5, ADH6, ADH1A, ADH1B, ADH1C and ADH7) also moderate risk for DD.
In our sample, genotypes of all markers were in HWE in controls, but some were in HWD in cases, indicating the existence of associations between genes and disease (6,7). The genotypewise case–control association analysis also showed association of these genes with DD, both before and after controlling for admixture effects. However, we noted that many associations from these conventional analyses became non-significant after correction for multiple testing, indicating that these analyses often led to information loss. To preserve this information, we applied DTR. The HWD test, case–control comparison and structured association (SA) analyses cannot correct for interaction effects between markers and between genes. These issues can also be well addressed by DTR (7).
DTR is a powerful method, and in using it, we detected associations that were not seen using the aforementioned conventional association methods. Several features, more details of which were discussed in Luo et al. (7), make DTR more powerful than other conventional association methods in many circumstances. First, it was possible to combine cases and controls, and EAs and AAs, in a single DTR model, thereby increasing the sample size and statistical power (while simultaneously controlling for potential stratification effects from phenotype and population variance). Second, different variables, including different genotypes and diplotypes from different genes, were entered into a single DTR model to avoid the multiple tests that inflate Type 1 error. Third, because DTR does not assume the presence of HWE, analysis was possible using this approach in the presence of deviation from HWE [e.g. for diplotype probabilities predicted by the program PHASE (18,19)]. Under HWD, alleles at a locus or multilocus haplotypes at a gene are not independent of each other, which may invalidate allelewise and haplotypewise analyses (6,7,20), and thus both analyses were not presented in the present study; however, because genotypewise and diplotypewise analyses may be valid and informative methods, we used them in the present study. Fourth, in the present study, the maximum proportion of individuals with unambiguous diplotypes (i.e. P = 1) in a single gene was only 37%. These diplotype data with uncertain phase can be analyzed by DTR. Fifth, age and sex were included in the DTR model to control for potential confounding effects. In the present study, the average age of the controls was 9 years less than for the cases, so a certain proportion of control subjects might still develop substance dependence in their lifetimes. Using such subjects as a control group for a study of substance dependence could reduce power but not produce false-positive results. The positive findings in the present study should be reliable—any bias from this age difference would tend to decrease the significance of the results but not lead to spurious findings. Potential confounding effects by age were controlled in the DTR analysis. Ancestry proportions were also included in the DTR model to control for population stratification and admixture effects. AD was not included in the DTR model as a covariate because of the multicollinearity issue resulting from the strong associations between AD and the ADH diplotypes (7). Sixth, DTR takes into account gene–gene interactions, which is a more powerful approach than single-gene analysis (21). Diplotypes incorporate the LD information from different markers, and the interactions between diplotypes (diplotype–diplotype interactions from different genes are more representative of gene–gene interactions than marker–marker interactions) were considered in the DTR model. Finally, DTR is able to account for LD effects and, additionally, cis-acting functional effects. On the basis of these considerations, findings obtained through application of DTR have a high likelihood of being valid.
DTR showed that in EAs and/or AAs, genotypes of ADH5∧SNP1 and ADH6∧SNP9 and diplotypes at the ADH1A, ADH1B, ADH1C, and ADH7 genes were associated with phenotype (the risk genotypes and diplotypes exerted effects in the same direction for both DD and DD-only). Further, most associations evidenced by DTR analysis showed a higher degree of statistical significance than those based on conventional association methods. In summary, our findings by DTR analysis include the following: (i) Some associations were observed in both populations. This is expected for functional variants and could also occur when the same functional variants are important in both populations, and the markers studied are in similar LD with such variants in both populations. (ii) Some associations were population-specific or even showed opposite effects in the two populations. This is understandable because the diplotype frequency distributions are population-specific in the genetically distinct EAs and AAs, and even the same diplotypes could have different frequencies in these two populations, e.g. ADH1A∧AGA/TCG is quite rare in AAs (f = 0.057), but more common in EAs (f = 0.181). The common diplotypes in one population and the rare diplotypes in another population might be in LD with the opposite allele phases of either the same or possibly different unknown risk-influencing variants and could thus exert opposite effects. This is analogous to the situation in which the major allele and the minor allele of the same marker have opposite effects. Additionally, as explored by Luo et al. (7), gene–gene interaction effects can be population-specific; of course, the admixture effects could be population-specific also (e.g. AAs show more admixture effects than EAs). These gene–gene interaction effects and admixture effects could affect the direction of association of a certain diplotype in two distinct populations, which could explain why the ADH1C∧AGT/GAC is common in both EAs (f = 0.353) and AAs (f = 0.275) but has opposite effects in these two populations. (iii) Of particular note here, ADH6∧SNP9 genotype was suggestively associated with DD-only and only in AAs (P = 0.088). We cannot exclude the possibility that the failure to reach statistical significance is due to insufficient statistical power.
Results from DTR analysis suggest that the ADH gene cluster may harbor risk loci for DD. Risk alleles can be fine-mapped using the J-value. If a marker is close to a risk allele for AD, but not close to a DD risk allele (i.e. if the allele affects risk for AD, but not DD), the J-value of this marker should be highest for AD, intermediate for DD (which includes co-morbid AD) and lowest in DD-only (Table 5; Fig. 1). For example, the J-value at ADH1B∧Arg/His (SNP16: previously called ADH2*1/2) is extremely high for AD (11.667 in EAs; 1.000 in AAs), intermediate in DD (1.185 in EAs; 1.000 in AAs) and very low in DD-only (0.008 in EAs; 0.001 in AAs), suggesting that the marker is close to a risk allele for AD, but not for DD. We expected to identify markers that, if they affected risk for DD, did so through co-morbid AD, rather than through a direct effect on DD. Conversely, if a marker is close to a risk allele for DD, but not close to one for AD, the J-value of this marker would be high in DD-only, intermediate in DD (which is co-morbid with AD) and low in AD. Although not anticipated, we observed several associations of this kind as well, including those involving SNPs 1, 11, 20 and 22 in EAs and SNPs 9, 14, 17 and 21 in AAs. If a marker is close to risk alleles both for AD and DD (i.e. the allele affects risk for both phenotypes), the J-value of this marker should be high in all groups: AD, DD and DD-only. We observed this situation for SNP13 in EAs and SNPs 10 and 22 in AAs. This finding suggests that some risk alleles for AD and DD may be located in similar positions in the ADH gene cluster; others may be located in different positions. Some risk alleles for DD are close to some well-known functional variants, such as ADH1B∧Arg/Cys (SNP14: previously called ADH2*1/3), ADH1C∧Ile/Val (SNP17: previously called ADH3*1/2) and ADH7∧Ala/Gly (SNP22).
All of the earlier-mentioned conventional association analyses, the DTR association analysis and the fine-mapping analysis suggest that risk for DD is affected by multiple ADH genes, consistent with their multigenic etiology, i.e. minor effects of different genes with additive effects on risk for DD. There are several possible explanations for the associations between ADH genes and DD: (i) the associations are completely driven by the actual associations between these genes and AD, because many patients with DD have co-morbid AD. Alcohol helps to enhance the effects of many drugs. As a specific example, cocaine and alcohol are metabolized to cocaethylene (22), which has biological properties similar to cocaine but is longer acting. Many cocaine abusers therefore prefer to use cocaine together with alcohol, which contributes to the high rate of co-morbidity of AD and CD. Thus, variants affecting risk for AD may indirectly affect risk for DD by modifying alcohol's enhancing effect on other drugs. However, we also observed many associations between these genes and DD-only (i.e. without co-morbid AD), which argues against indirect effects as a general explanation for these observations. (ii) The susceptibility to DD attributable to these genes is shared with AD susceptibility (i.e. the genes contribute independently to risk for the two phenotypes); for example, these alcohol-metabolizing genes may directly modulate risk for DD via specific pathways independent of alcohol metabolism. These pathways may overlap with the mechanism by which disulfiram exerts its treatment effect on CD. (iii) The findings could also be false positives; however, the statistical significance levels we observed argue in favor of other explanations.
A careful look at the range of physiological function of the alcohol-metabolizing enzymes also provides support for the existence of direct genetic effects on DD risk, without invoking mediation by effects on alcohol use. In addition to catalyzing the oxidation of ethanol, ADH and aldehyde dehydrogenase (ALDH) enzymes may be involved in the metabolic pathways of several neurotransmitters, including serotonin, norepinephrine and dopamine (23). For example, (i) 5-hydroxytryptamine (5-HT) is metabolized by monoamine oxidase to 5-hydroxyindole-3-acetaldehyde (5HIAL), which is either oxidized to the major metabolite 5-hydroxyindole-3-acetic acid (5HIAA) by ALDH or reduced to the minor metabolite 5-hydroxytryptophol (5HTOL) by alcohol dehydrogenase (ADH) (24). Hypo-potentiated γADH (mainly) and βADH (partially) inhibit the turnover of 5-HIAL to 5-HTOL (25). Elevated ALDH2 activity potentiates the oxidization of 5-HIAL to 5-HIAA and decreases the production of 5-HTOL reduced from 5-HIAL (26). Low levels of 5-HTOL may predispose to self-administration of cocaine, a potential exogenous competitor for 5-HTOL, thereby compensating for the reduced effects of 5-HTOL, which could lead to CD. Inhibiting ALDH2 activity with disulfiram (Antabuse) or cyanamide (calcium carbimide, Dipsan) inhibits the oxidization of 5-HIAL to 5-HIAA and increases the production of 5-HTOL from 5-HIAL (26), which could reduce cocaine self-administration and might be the mechanism by which disulfiram exerts therapeutic effects in CD. (ii) πADH can catalyze the reduction of norepinephrine aldehydes. Increased πADH activity could lead to a very high turnover of norepinephrine aldehydes (27). Cocaine, which functions as a norepinephrine re-uptake inhibitor, can activate the noradrenergic system (28). Plasma epinephrine and norepinephrine concentrations were significantly increased in response to cocaine injection (28). Intravenous opioids also stimulate norepinephrine and acetylcholine release in cerebrospinal fluid (29). Therefore, self-administration of cocaine or opioids could elevate norepinephrine aldehydes, which could reinforce these behaviors, thereby contributing to the development of DD.
These neurotransmission signaling systems may also modulate the reinforcing or rewarding effects of abusable drugs through other neurotransmitter systems, providing a key psychomotor mechanism of the development of DD. For example, (i) the psychomotor stimulant effects of cocaine are most often thought to be mediated through enhanced dopamine or serotonin neurotransmission in mesolimbic areas of the brain (30–32). Blockade of the D3 receptor in the mesolimbic system with SB-277011A, a novel D3-selective antagonist, attenuates cocaine-enhanced brain stimulation reward, cocaine-induced conditioned place preference and cocaine-induced reinstatement of cocaine-seeking behavior in rats (33). Dopamine signaling in the nucleus accumbens (NAc) is also thought to play an important role in regulating drug-taking and drug-seeking behaviors (34). Dopamine D1 receptor agonists and D2 receptor antagonists attenuate reinstatement of cocaine-seeking in rats through D1-like and D2 dopamine receptors in the NAc (35–37). (ii) Cocaine binding to the dopamine transporter (DAT), serotonin transporter (SERT) and norepinephrine transporter (NET) strongly inhibits the reuptake of these biogenic amines (38). These neurotransmitters play important roles in the pharmacological effects of cocaine, including the pleasurable properties, rewarding and reinforcing effects, and may also produce neurotoxic effects (39,40). Altered activities of ADH enzymes determined by ADH gene variation may thus modulate risk for DD via a number of different neurotransmitter signaling pathways.
In summary, we have presented the first comprehensive evidence for association of ADH variants with DD, irrespective of co-morbidity with AD. Associations of some of the alcohol-metabolizing enzymes with AD are well known and in fact are some of the oldest and most consistent finds in psychiatric genetics. Associations with DD [except for ADH4, which we reported previously (5,6)] have not been reported. Such associations might be expected on the basis of the high rate of co-morbidity of AD and DD or through the modulating effects of polymorphic variation in the genes encoding these enzymes on the effects of alcohol, even in the absence of AD. However, our results, which in some cases show stronger association with DD than AD, are not fully explained by recourse to the effects on alcohol metabolism. These associations may be better explained by physiological effects of alcohol-metabolizing enzymes on neurotransmission or indirect effects through personality (41). These results provide a novel window into the genetic risk mechanisms for DD and new support for the role of the polymorphic variation in genes encoding alcohol-metabolizing enzymes for substance dependence risk. As for any such novel results, these findings require independent replication to support their validity.
MATERIALS AND METHODS
Subjects
A total of 718 unrelated subjects, recruited at the University of Connecticut Health Center or the VA Connecticut Healthcare System—West Haven Campus, were included in this study. All subjects gave informed consent before participating in the study, which was approved by the Institutional Review Board at the respective institutions. The sample consisted of 365 healthy controls (317 EAs and 48 AAs; 219 females and 146 males) and 353 cases [including those with CD (n = 314) and/or OD (n = 150)] (208 EAs and 145 AAs; 111 females and 242 males). Among the cases, 122 subjects (79 males and 43 females) had a diagnosis of DD in the absence of AD (i.e. DD-only). All cases met lifetime DSM-III-R criteria (42) for CD or OD, or both of these disorders; some patients (n = 231) also met criteria for AD. Alcohol abuse was excluded in all cases, but not all types of alcohol problems (e.g. social drinking) were excluded from this sample (an effect on alcohol problems that do not reach the DSM-III-R thresholds for abuse or dependence would be unlikely to be important as a mechanism in determining DD risk). The healthy controls were recruited from the general population through advertisement, with many recruited from local college campuses. They were screened using the Structured Clinical Interview for DSM-III-R (SCID) (43), the Computerized Diagnostic Interview Schedule for DSM-III-R (C-DIS-R) (44), the Schedule for Affective Disorders and Schizophrenia (SADS) (45) or an unstructured interview to exclude major Axis I mental disorders, including substance use disorders, psychotic disorders (including schizophrenia or schizophrenia-like disorders), mood disorders and major anxiety disorders. Males constituted 68.0% of the cases and 40.0% of the controls. The average ages were 28.1 ± 9.1 years for controls and 37.1 ± 8.1 years for cases. The cases with co-morbid AD and the control subjects were also included in our initial studies of AD (6,7).
Genotyping
Most ADH SNPs were genotyped with a fluorogenic 5′ nuclease assay method, i.e. the TaqMan technique; some ADH SNPs and the Duffy antigen gene (FY) marker (rs2814778) were genotyped with the reaction–restriction fragment length polymorphism (PCR–RFLP) technique; 37 STR markers were genotyped by a fluorescence capillary electrophoresis technique (5,7).
Statistical analysis
HWE test and genotype frequency analysis
HWE for the genotype frequency distribution of each marker was tested within populations and separately in cases and controls, using an exact test (df = 1) implemented in the program PowerMarker, with P-values shown in Table 3. The HWE test has been used as a valid method to detect disease–gene association in recent years (4,6,7,46–52). Genotype–phenotype associations were analyzed by comparing the genotype frequency distributions between cases and controls, with exact tests (df = 2) using the program PowerMarker, and the P-values are listed in Table 6.
P-values for case–control comparisons on genotype frequency distributions
| Marker | Before control for admixture | After control for admixture | ||||||
|---|---|---|---|---|---|---|---|---|
| EAs | AAs | EAs | AAs | |||||
| DD | DD-only | DD | DD-only | DD | DD-only | DD | DD-only | |
| ADH5∧SNP1 | 0.008 | 0.006 | — | — | 0.012 | 0.004 | — | — |
| ADH1A∧SNP11 | — | — | 0.031 | 0.004 | — | — | 0.021 | 0.001 |
| ADH1B∧SNP14 | N/A | N/A | 0.020 | 0.072 | N/A | N/A | 0.026 | — |
| ADH1B∧SNP15 | — | — | — | 0.059 | — | — | 0.098 | 0.061 |
| ADH1C∧SNP17 | — | 0.053 | 0.064 | — | — | 0.047 | — | — |
| ADH1C∧SNP18 | — | — | 0.046 | — | — | — | — | — |
| ADH1C∧SNP19 | — | 0.091 | 0.063 | — | — | 0.094 | — | — |
| ADH7∧SNP21 | — | — | 0.029 | 0.0006 | — | — | 0.016 | <1.E−6 |
| ADH7∧SNP22 | — | — | 0.034 | — | — | — | — | — |
N/A and no P-value same as Table 3; markers with P>0.10 in all phenotype groups are not listed. Before control for admixture, conventional case–control comparison before controlling for admixture effects; After control for admixture, case–control comparison after controlling for admixture effects (SA analysis). P-values in AD group were presented previously (7).
Population structure analysis and structured association analysis
Both EAs and AAs were assumed to be potentially admixed populations. To measure the extent of admixture (i.e. African ancestry proportions in EAs and European ancestry proportions in AAs), 38 AIMs unlinked to one another and to the ADH genes were analyzed to infer ancestry proportions in each subject through the application of the program STRUCTURE (53). Parameter settings used to run STRUCTURE are presented elsewhere (5). Admixture within these two populations could confuse HWD tests or cause spurious associations. By conditioning the association analysis on the ancestry proportions of each subject, admixture effects can be controlled for statistically through an SA analysis using the program STRAT (54) [STRAT parameters were described previously (5)]. It should be noted that, in the present study, owing to the presence of HWD among the ADH markers, the association analysis was limited to the genotypewise level, not the allelewise level.
Correction for multiple tests
If the same data are tested multiple times from different perspectives, the tests (including the HWE tests, genotype frequency analyses and SA analyses) need correction. Each phenotype subgroup in the present study was tested for 20 SNPs. These 20 SNPs were found to be equivalent to 15 independent SNPs (calculated by SNPSpD). Thus, the α for HWE test was set at 0.0033 (=0.05/15) and the α for genotype frequency analyses (before and after SA analysis) was set at 0.0017 [=0.05/(15 × 2), where 2 is the test number for ‘with and without SA analysis’]. However, EA and AA are two separate populations (and not the same set of data) and could (in fact, it has been shown that they often do) have different risk alleles; cases and controls are also two separate populations (not the same set of data); analysis within EA and AA or within cases and controls therefore does not need correction for two tests. The analysis in cases was tested for DD and DD-only separately, but DD-only is not an independent and different phenotype, but a subset of DD, that is, DD and DD-only definitions do not describe the cases from two completely different perspectives; analyses within DD and DD-only therefore were not corrected conservatively for two tests. However, this needs to be kept in mind when interpreting the results.
DTR analysis
DTR (7), a stepwise logistic regression analysis, was used to test associations between genes and diseases. In the DTR model, diagnosis served as the dependent variable, and the covariates included ancestry proportions, age, sex, genotype probabilities at ADH5 and ADH6 (diplotype data were not available in these two genes because only one marker was genotyped in each of them), diplotype probabilities at other genes and interactions among genotypes or diplotypes. More detailed justification for using DTR was introduced previously (7).
Fine-mapping the risk alleles
HWD of a marker in cases sometimes indicates a valid genetic association (4,6,7). Thus, HWD measures can be used for fine-mapping a risk locus. J, an HWD statistic, is the preferred disequilibrium measure for fine-mapping (52), because it is a direct decreasing function of the recombination fraction between the disease and the marker loci. J-value is used for fine-mapping the risk variant among a set of markers within the same locus on the basis of the relative J-values between those markers. J can be derived from the genotype frequency data (6,52). If there are several peak J values in the ADH gene cluster, this might suggest that there are several risk alleles for disease within that cluster (Fig. 1). On the basis of these considerations, the J statistic is the one that is best suited for fine-mapping in the present setting, as discussed previously (7).
However, there is no way to test the statistical significance of a J-value directly, to our knowledge. This is a disadvantage of using J as a fine-mapping method. To address this issue, in the present study, we combined DTR and the J statistic for fine-mapping by using DTR to screen potential susceptibility genes (i.e. test the statistical significance for candidate variants) and then using the J-value to fine-map the risk alleles within those genes.
Acknowledgements
This work was supported in part by NIH grants R01-DA12849, R01-DA12690, K24-DA15105, R01-AA016015, R01-AA11330, P50-AA12870, K08-AA13732, K24-AA13736, K02-MH01387 and M01-RR06192 (University of Connecticut General Clinical Research Center), by funds from the US Department of Veterans Affairs [the VA Medical Research Program, the VA Connecticut—Massachusetts Mental Illness Research, Education and Clinical Center (MIRECC) and the VA Research Enhancement Award Program (REAP) Research Center] and by the Alcoholic Beverage Medical Research Foundation (ABMRF) grant award R06932 (X.L.). Ann Marie Lacobelle provided excellent technical assistance. The constructive comments of the two anonymous reviewers are highly appreciated.
Web Resources The URLs for data presented herein are as follows: dbSNP, http://www.ncbi.nlm.nih.gov/SNP/; Online Mendelian Inheritance in Man (OMIM), http://www.ncbi.nlm.nih.gov/Omim/ (for DD, AD, ADH1A, ADH1B, ADH1C, ADH4, ADH5, ADH6, ADH7 and ALDH2); PowerMarker, http://www.powermarker.net/ (for genetic data analysis software).
Conflict of Interest statement. None declared.
