


Abstract
BACKGROUND: The goal was to study the effects of social support during pregnancy on maternal depressive symptoms, quality of life and pregnancy outcomes. METHODS: Eight hundred ninety-six women were prospectively studied in the first trimester of pregnancy and following completion of the pregnancy. The sample was divided into quartiles yielding groups of low, medium and high social support based on perceived social support. RESULTS: Pregnant women with low support reported increased depressive symptoms and reduced quality of life. The effects of social support on pregnancy outcomes were particularly pronounced in women who had smoked during pregnancy, with significant main effects of social support in a two-way analysis of variance (smoking status and social support) for child body length (F = 4.26, P = 0.04; 50.43 ± 2.81 cm with low support versus 51.76 ± 2.31 cm with high support) and birthweight (F = 11.35, P = 0.001; 3175 ± 453 g with low support versus 3571 ± 409 g with high support). In smokers, pregnancy complications occurred more frequently when given low support {34 versus 10.3% with high support, χ2 = 5.49, P = 0.019; relative risk (RR) = 3.3 [95% confidence interval (95% CI) = 1.1–10.2]}, and the proportion of preterm deliveries was greater given low support (10.0 versus 0% with high support, χ2 = 3.84, P = 0.05, odds ratio = 8.1). CONCLUSIONS: Lack of social support constitutes an important risk factor for maternal well-being during pregnancy and has adverse effects on pregnancy outcomes.
Introduction
Pregnancy constitutes a time of significant life change requiring major psychological adjustments, often associated with anxiety and stress (Da Costa et al., 1999). A lack of psychosocial and emotional adjustment during pregnancy constitutes a risk factor for the mother. For example, depressed mood during pregnancy has been identified as a predictor of post-partum depressed mood (Neter et al., 1995; Da Costa et al., 2000b). However, maintaining good psychological health during pregnancy also has important health implications for the unborn child. Emotional distress, particularly symptoms of depression and anxiety, reportedly increase the risk of pregnancy and birth complications, poor neonatal status, low birthweight, prematurity and intrauterine growth retardation (Pagel et al., 1990; Hedegaard et al., 1993; Da Costa et al., 1998; Hansen et al., 2000; Da Costa et al., 2000a; Dole et al., 2003; Rondo et al., 2003; Badr et al., 2005; Berle et al., 2005), although negative or unclear findings have also been reported (Hedegaard et al., 1996; Brooke et al., 1989; Berle et al., 2005). Furthermore, maternal antenatal anxiety has been linked with behavioural and emotional problems of the child (O’Connor et al., 2002). One important risk factor affecting maternal well-being during and after pregnancy is lack of social support.
The association between social support, psychological stress and pregnancy outcome is undoubtedly complex (Hoffman and Hatch, 1996; Sheehan, 1998). It has been proposed that effective psychosocial resources, particularly social stability and social participation providing emotional and instrumental support, are protective by buffering the impact of life stress on emotional well-being of the mother (Glazier et al., 2004). In addition, social support may be one determinant of lifestyle habits and relevant health behaviours, including substance use such as alcohol and tobacco, as well as dietary habits (Heaman et al., 2005; Harley and Eskenazi, 2006), which can by themselves adversely affect pregnancy outcomes (Brooke et al., 1989; Dejin-Karlsson and Ostergren, 2003; Hofhuis et al., 2003; Rasmussen and Irgens, 2006). Interestingly, several previous studies have suggested an interaction between psychosocial factors and smoking (Cliver et al., 1992; Rondo et al., 2003). Overall, the importance and implications of social support during pregnancy remain incompletely understood. Therefore, in this cross-sectional, prospective study, we addressed the effects of social support on psychological variables, smoking behaviour and pregnancy outcomes in a sample of pregnant women (n = 896) from the city of Berlin, Germany. Women were studied initially during the first trimester of pregnancy with regard to psychosocial variables, and pregnancy outcomes were assessed after completion of the pregnancy. For analyses, participants were allocated into groups of low, medium and high social support based on scores on the perceived social support questionnaire (Fydrich et al., 1999), completed during the first trimester of pregnancy. Regressional analyses were carried out to address the contribution of social support to the prediction of birthweight. To address the possible interaction of smoking and social support in affecting pregnancy outcomes, secondary analyses were carried out comparing pregnancy outcomes in groups of pregnant women with low versus high social support separately for smokers and non-smokers.
Methods
Recruitment of study participants
Recruitment of pregnant women was coordinated by the Department of Internal Medicine and Psychosomatics and the Department of Obstetrics at the Charité – University Medicine Berlin, Germany. Because confirmation of a pregnancy is usually sought at obstetricians in private practice rather than a university hospital, the recruitment of pregnant women was accomplished with the help of 100 obstetricians in private practice in Berlin, Germany. Women with a pregnancy confirmed by a positive blood or urine test and a gestational age between 4 and 12 weeks were eligible to participate. Fertility treatments were exclusionary. Written informed consent was obtained from all women, and the study was approved by the ethics committee of Charité – University Medicine Berlin, Germany.
Study design and procedures
A prospective, cross-sectional study was conducted in Berlin, Germany, from 2002 to 2004. Pregnant women were studied during the first trimester of pregnancy with regard to sociodemographic and medical characteristics as well as psychosocial and emotional functioning. Following completion of the pregnancy, data on pregnancy complications, type of delivery and pregnancy outcome were provided by the obstetricians; babies’ birth dates, height and weight were reported by the mothers. This follow-up was accomplished with a pre-stamped card that was placed in the maternal pass (routinely handed out to every pregnant woman in Germany at the time of confirmation of the pregnancy) upon recruitment. Women were asked to send the completed card back to the study coordinators. If a card was not returned as scheduled, women were contacted via telephone. In addition, the obstetricians also kept a pregnancy outcome card in the patient file and sent it back to us upon knowledge of the pregnancy outcome.
Measures
At the time of recruitment, the medical, obstetrical and gynaecological history was thoroughly documented, and sociodemographic data were collected. In addition, standardized questionnaires on psychosocial and emotional functioning were completed (Psychometric evaluations). For the follow-up, the pregnancy outcome cards completed independently by the women and gynaecologists contained the following items: description of the gestational week of delivery, the method of delivery, sex, weight and length of the baby. In addition, there were items regarding the pregnancy, including the question whether or not the pregnancy was maintained without complications, or if the following complication had occurred: miscarriage, pregnancy-induced hypertension, pre-eclampsia/hemolysis, elevated liver, low platelet (HELLP) syndrome, fetal growth retardation or gestational diabetes and an option to answer openly and add other complications or comments.
Psychometric evaluations
Pregnant women completed three validated questionnaires.
The 22-item version of the social support questionnaire (‘Fragebogen zur sozialen Unterstützung’, F-SozU-22), which has previously been validated in healthy populations and clinical samples in Germany and Austria (Fydrich et al., 1999; Dunkel et al., 2005). The questionnaire’s 22 items address several dimensions of perceived social support, including emotional support, instrumental support and social integration. In addition, the questionnaire includes items that assess an individual’s overall satisfaction with his or her social support network. It also takes into account how many trusted individuals exist in a person’s life. The questionnaire is designed to focus on the functional aspect of social support by quantifying the quality of subjectively perceived and anticipated support resources rather than objective number of social networks. For analysis, a global score is used which is calculated based on all 22 items. The global scale and the four major scales (emotional support, instrumental support, social integration and social strain) show high values of internal consistency (Cronbach alpha between 0.81 and 0.93).
To measure depressive symptoms, the short version of the ‘Allgemeine Depressionsskala’ (ADS-K) (Hautzinger and Bailer, 1993) was used, which is the German version of the ‘Center for Epidemiological Studies Depression Scale’ (CES-D) (Radloff, 1977). The ADS-K consists of 15 items in the form of statements which address various aspects of depressive symptomatology during the past 7 days, including presence of excessive worries, difficulties concentrating, feelings of sadness, depression and loneliness, anxiety, sleep disturbances, inability to enjoy life and lack of energy. The items are rated on a Likert-like scale from 1 (occurred infrequently, on >1 day) to 3 (occurred most or all of the time, on 5–7 days). When used as a screening instrument, a total score ≥18 points is considered clinically relevant (Hautzinger and Bailer, 1993). High values of internal consistency have been shown for the original CES-D (Cronbach alpha between 0.85 and 0.91), and for the German ADS-K (between 0.81 and 0.91); the correlation with other measures of depressive symptoms such as the Beck Depression inventory was reportedly high (r = .78).
The SF-12, which is the short-version of the widely used SF-36, was used to assess physical and psychological aspects of quality of life (Bullinger and Kirchberger, 1998; Gandek et al., 1998). It contains 12 questions that explain >90% of the variance of the original SF-36. The items address the impact of physical health problems, including overall fitness and bodily pain as well as psychological or emotional issues, on a variety of activities of daily life, including housework, social interactions and work life. Included are also questions assessing level of energy, vitality and feeling of sadness. Scoring results in two global health measures, that is, the physical and psychological sum scores.
All questionnaires were scored and analysed according to the published guidelines.
Analyses
Pregnant women were allocated into groups of low (first quartile), medium (second and third quartiles) and high social support (fourth quartile) based on the total score on the social support questionnaire (Fydrich et al., 1999), completed during the first trimester of pregnancy. several types of analyses were subsequently carried out (Figure 1); data are reported as mean ± SD, and the level of significance was taken as P < .05.
To address differences between groups of social support in sociodemographic characteristics and psychological variables, the three groups were statistically compared using analysis of variance (ANOVA), followed by post-hoc Scheffé tests for comparisons of individual means. For dichotomous sociodemographic and health-related variables, Chi-Square tests for analyses of frequency distributions were computed. For the validated questionnaires (i.e. ADS-K, SF-36 and the social support questionnaire), the three social support groups were not only compared with each other but also with the published normative data for the questionnaires using one-sample t-tests (Hautzinger and Bailer, 1993; Bullinger and Kirchberger, 1998).
The three groups of social support were compared with regard to pregnancy outcomes using ANOVA, followed by post-hoc Scheffé tests for comparisons of individual means.
Given the existence of marked group differences in smoking behaviour between groups of social support, we addressed the effects of high versus low social support group on pregnancy outcomes separately for smokers and non-smokers. We compared the frequencies of pregnancy complications and preterm deliveries using chi-square tests. For child body length and weight, we computed two-way ANOVAs with two group factors (i.e. smoking status and support group) to address main effects and possible interactions between these variables. In addition, we calculated univariate ANOVAs to compare the birthweight of babies in the high versus low social support groups separately for the smokers and non-smokers. We also ran all ANOVAs with mothers’ age, height and weight as covariates and report these results separately. Finally, we computed relative risks (RR), 95% confidence intervals, (95% CI) for the occurrence of pregnancy complications and preterm deliveries separately for smokers and non-smokers.
To address the contribution of social support to birthweight as the primary pregnancy outcome variable, two sets of stepwise multiple regression analyses were computed. (i) Given high inter-correlations of social support with other psychological variables (depressive symptomatology and quality of life), we initially aimed to clarify whether social support was indeed superior in predicting birthweight. Therefore, we carried out a stepwise multiple linear regression analysis with the following variables as predictor: social support score, quality of life (SF-12 physical sum score and SF-12 psychological sum score) and depression (ADS-K score). (ii) In a second multiple, stepwise regression, we used social support score together with age, smoking status, education, employment status, weight and height of the mother, and chronic disease as additional predictor variables.
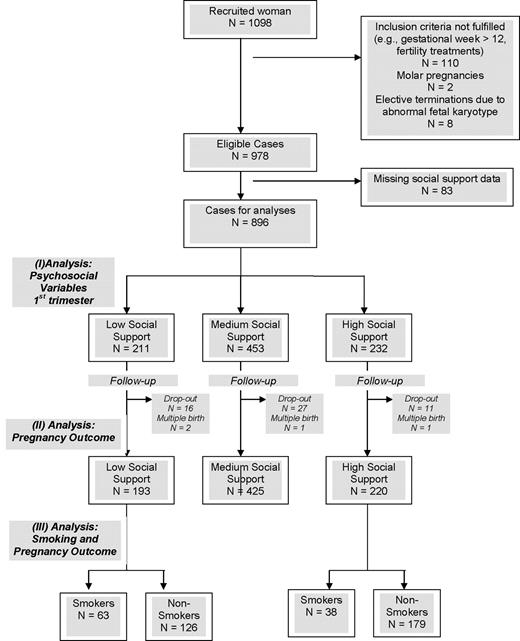
Consort diagram of participants, including information on exclusion and drop-out of participants. In addition, there was missing data due to incomplete datasets for analyses (described in ‘Pregnancy complications and outcomes in groups of low, medium and high social support’ and ‘Effects of smoking on pregnancy outcome in groups of low and high social support’ sections): (i) missing data on child weight, n = 173 (19.3%); in addition, n = 49 (5.5%) miscarriages were excluded from analyses on child weight; (ii) missing data on pregnancy complications, n = 134 (15.0 %); (iii) missing data on preterm delivery, n = 55 (6.1%) and (iv) missing data on smoking during pregnancy, n = 17 (1.9%).
Results
Questionnaires were completed by a total of 896 women in the first trimester of pregnancy (see Figure 1 for a consort diagram, which also includes information on exclusion of subjects, drop-out and missing data). Based on scores on the social support questionnaire, the total sample was divided into quartiles yielding three groups: low (first quartile, n = 211), medium (second and third quartiles, n = 453) and high social support (fourth quartile, n = 232). Compared with the published German reference values (mean ± SD: 4.0 ± 0.66) (Fydrich et al., 1999), scores of women in the low social support group were significantly reduced (3.78 ± 0.56, P < 0.001), indicating lower social support, whereas scores in the medium (4.6 ± 0.15) and high (4.94 ± 0.05) social support groups were significantly increased (both P < 0.001 versus German norm).
Sociodemographic and psychological characteristics of pregnant women in groups of low, medium and high social support
The social support groups were comparable with regard to current pregnancy week and body mass index (BMI), but the percentage of women who had planned the pregnancy was significantly lower amongst women with low social support (Table I). Significant differences between groups of social support were also found in sociodemographic parameters. A significantly greater proportion of women with low support had not planned the pregnancy, did not have a partner who lived in the same household, already had children and was without current employment. In addition, women with low social support were younger, less educated and tended to report more chronic health conditions. Finally, a significantly greater percentage of women with low social support self-reportedly smoked before and during pregnancy (Table I).
Sociodemographic and health characteristics in groups of pregnant women with low, medium and high social support
| All (n = 896) | Low support (n = 211) | Medium support (n = 453) | High support (n = 232) | P* | |
|---|---|---|---|---|---|
| Current week of pregnancy, mean ± SD (minimum–maximum) | 8.22 ± 1.94 (4–12) | 8.45 ± 1.85 (4–12) | 8.17 ± 2.0 (4–12) | 8.10 ± 2.0 (4–12) | NS |
| Pregnancy was planned [% (n)] | 63.6 (564) | 56.5 (117) | 62 (279) | 73.0 (168) | <0.001 |
| Age [mean ± SD (minimum–maximum)] | 29.20 ± 5.02 (16–43) | 28.84 ± 5.42aa (16–41) | 28.78 ± 5.15bb (17–42) | 30.29 ± 4.26ab (18–43) | 0.004 |
| Partnership status [% (n)] | |||||
| No partner | 1.9 (17) | 3.4 (7) | 2.0 (9) | 0.4 (1) | 0.024 |
| With partner in same household | 85.0 (750) | 80.0 (164) | 84.5 (377) | 90.5 (209) | |
| With partner in separate households | 13.0 (115) | 16.6 (34) | 13.5 (60) | 9.1 (21) | |
| Duration of current partnership (in years) [mean ± SD (minimum–maximum)] | 5.4 ± 4.2 (0–25) | 5.2 ± 4.4 (0–25) | 5.4 4.1 (0–25) | 5.6 ± 4.3 (0.1–25) | NS |
| With one or more children [% (n)] | 38.5 (343) | 45.2 (94) | 37.8 (171) | 33.9 (78) | 0.048 |
| Education [% (n)] | |||||
| >10 years | 49.8 (439) | 38.2 (79) | 50.7 (225) | 58.4 (135) | <0.001 |
| ≤10 years | 48.2 (425) | 57.5 (119) | 48.0 (213) | 40.3 (93) | |
| No high school degree | 2.0 (18) | 4.3 (9) | 1.4 (6) | 1.3 (3) | |
| Current employment (full or part-time) [% (n)] | 83.0 (733) | 73.1 (152) | 85.1 (378) | 87.9 (203) | <0.001 |
| Body mass index [mean ± SD] | 22.9 ± 4.0 | 23.1 ± 4.1 | 22.9 ± 4.1 | 22.7 ± 3.7 | NS |
| Current smoking behaviour | |||||
| Smoker [% (n)] | 23.7 (208) | 33.8 (70)ab | 22.5 (99)aa | 17.0 (39)bb | <0.001 |
| Cigarettes/day for smokers [mean ± SD (minimum–maximum)] | 8.9 ± 5.1 (1–25) | 8.9 ± 4.6 (1–20) | 9.4 ± 5.4 (1–20) | 8.0 ± 5.5 (1–25) | NS |
| Smoking behaviour prior to pregnancy | |||||
| Smoker [% (n)] | 33.8 (257) | 42.6 (75)ab | 32.9 (125)aa | 27.9 (57)bb | 0.009 |
| Cigarettes/day for smokers [mean ± SD (minimum–maximum)] | 14.9 ± 8.8 (1–40) | 15.9 ± 8.5 (1–40) | 14.7 ± 9.6 (1–40) | 13.9 ± 7.4 (2–30) | NS |
| Self-reported chronic health condition [% (n)] | 13.7 (121) | 18.2 (38) | 13.2 (59) | 10.5 (24) | 0.058 |
NS, non-significant (P > 0.1).
Continuous variables (i.e. current week of pregnancy, age and body mass index), P values given are the result of analyses of variance (ANOVAs) on the three social support groups; for dichotomous variables, P values given are the result of chi-square tests on the three social support groups.
abEqual letters (aa,bb) indicate significant differences of group means, computed with Scheffé post-hoc tests following ANOVA.
Social support also had a significant impact on depressive symptomatology, measured with the ADS-K (ANOVA group effect: F = 83.60, P < 0.001) (Hautzinger and Bailer, 1993). Women with low social support demonstrated significantly increased ADS-K scores (16.1 ± 8.1), indicating greater depressive symptoms, compared with women with medium (11.3 ± 6.8) and high social support (7.6 ± 5.8) (both P < 0.001, post-hoc Schéffe tests). Accordingly, the percentage of women above the questionnaire’s threshold for clinically significant depressive symptomatology (i.e. total score ≥18) (Hautzinger and Bailer, 1993) was significantly greater amongst women with low social support (43.0%) compared with women with medium (15.9%) and high (7.3%) social support (χ2 = 93.87, P < 0.001). Compared with the published normative values (n = 564 females, mean ± SD: 11.69 ± 8.81), women with low support had a significant greater ADS-K total score (P < 0.001), whereas women with high social support group had a significantly lower total score (P < 0.001).
Significant group effects were observed for quality of life, measured by the SF-12 (ANOVA group effects for physical sum score: F = 11.53, P < 0.001; for psychological sum score F = 90.60, P < 0.001). Women in the low social support group had significantly reduced quality of life, reflected by reduced SF-12 sum scores, compared with both the medium and high social support groups (all P < 0.001, post-hoc Scheffé tests, Figure 2). On the contrary, in the high support group, psychological quality of life was significantly enhanced compared with the medium social support group (P < 0.001, post-hoc Scheffé test). Compared with the age-appropriate, female German normative population (n = 473 healthy females aged 21–30 years, mean ± SD: 52.86 ± 6.76 for the physical sum score, 51.92 ± 8.35 for the psychological sum score) (Bullinger and Kirchberger, 1998), women in all three social support groups had significantly reduced physical quality of life (versus German norm: all P < 0.001). Women in the low and medium social support groups had significantly lower psychological quality of life (versus German norm, both P < 0.001), whereas women in the high social support group did not differ from the German reference population.
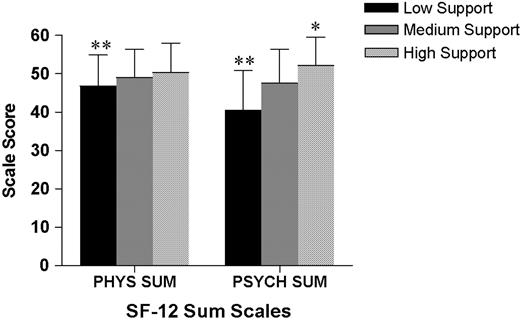
Health-related quality of life, measured with the German version of the SF-12, in pregnant women in the low, medium and high social support groups, assessed in the first trimester of pregnancy. Women in the low social support group had significantly lower scores, indicating reduced quality of life, on both the physical sum scale (PHYS SUM) and the psychological sum scale (PSYCH SUM), compared to women in the medium and high social support groups (**all P < 0.001, post-hoc Scheffé tests). Data are shown as mean ± SD. The high social support group demonstrated an improved psychological sum score (*P < 0.001) versus medium support.
Pregnancy complications and outcomes in groups of low, medium and high social support
Significant effects of social support were found for the overall occurrence of any type of pregnancy complication (χ2 = 8.67, P = 0.012). Interestingly, pregnancy complications occurred in a similar percentage of women with low and medium social support (23.9 and 25.1%, respectively), but the percentage was markedly lower in women with high support (14.2%), consistent with a protective effect of high social support (Table II). Analyses comparing the groups with regard to the specific complications did not reveal any statistically significant differences (Table II).
Pregnancy outcomes in groups of women with low, medium and high social support
| All (n = 896) | Low support (n = 193) | Medium support (n = 425) | High support (n = 220) | P† | |
|---|---|---|---|---|---|
| Delivery at GA1 (in weeks*, for births ≥ 37 weeks) | 39.5 ± 1.8 (37–44] | 39.6 ± 1.9 [37–44] | 39.4 ± 1.9 [37–42] | 39.7 ± 1.5 [37–42] | NS |
| Child body weight1 (in g*, for births ≥ 37 weeks) | 3468 ± 464 [2000–4990] | 3373 ± 441aa [2100–4555] | 3463 ± 450 [2000–4620] | 3554 ± 494aa [2510–4990] | 0.004 |
| Child body length1 (in cm*, for births ≥ 37 weeks | 51.65 ± 2.39 [40–60] | 51.15 ± 2.30ab [43–57] | 51.78 ± 2.47aa [40–60] | 51.83 ± 2.29bb [47–58] | 0.022 |
| Pregnancy complications2 [% (n)] | |||||
| Any | 22.0 (155) | 23.9 (39) | 25.1 (90) | 14.2 (26) | 0.012 |
| Miscarriage | 5.9 (49) | 4.7 (9) | 7.1 (30) | 4.5 (10) | NS |
| Preterm delivery3 | 5.4 (42) | 7.7 (14) | 5.4 (21) | 3.3 (7) | NS |
| Gestational hypertension | 1.8 (13) | 0.6 (1) | 2.8 (10) | 1.1 (2) | NS |
| Pre-eclampsia | 2.3 (16) | 1.8 (3) | 3.1 (11) | 1.1 (2) | NS |
| HELLP syndrome | 0.1 (1) | 0 | 0.3 (1) | 0 | NS |
GA, gestational age; HELLP, hemolysis, elevated liver, low platelet; NS, non-significant (P > 0.1).
Presented as mean ± SD [minimum–maximum].
For continuous variables (i.e. child length and weight, week of delivery), P values given are the result of ANOVAs on the three social support groups; for dichotomous variables, P values given are the result of chi-square tests on the three social support groups.
abEqual letters (aa,bb) indicate significant differences of group means, computed with Scheffé post-hoc tests following ANOVA.
Reported by the mother.
Reported by the gynaecologist/obstetrician.
Delivery prior to a GA of 37 weeks.
Including only babies delivered with a gestational age ≥37 weeks, social support had a significant effect on child length and weight (for child body length: F = 3.86, P = 0.022, for weight: F = 5.74, P = 0.004). Babies born to mothers with low perceived social support during pregnancy were significantly smaller (versus medium support: P = 0.042; versus high support: P = 0.042, post-hoc Scheffé tests) and had a significantly reduced birthweight (versus high support: P = 0.004, post-hoc Scheffé test, Table II). These group differences were clearly not attributable to differences in gestational age (Table II).
Effects of smoking on pregnancy outcome in groups of low and high social support
Given the existence of marked differences in smoking behaviour between groups of social support (Table II) and evidence supporting effects of smoking on pregnancy outcomes, we addressed the effects of high versus low social support on pregnancy outcomes separately for smokers and non-smokers (as self-reported in the first trimester of pregnancy). In women who had smoked during pregnancy, pregnancy complications occurred significantly more frequently given low support (34%) compared with high support (10.3%) (χ2 = 5.49, P = 0.019; RR = 3.3, 95% CI = 1.1–10.2) (Table III). On the contrary, in women who had not smoked during pregnancy, social support had no significant effect on the risk of pregnancy complications (RR = 1.3, 95% CI = 0.8–2.3). Similar results were observed for smokers with regard to the proportion of preterm deliveries, with a greater percentage given low support (10%) compared with 0% preterm deliveries given high support (χ2 = 3.84, P = 0.05) (RR not computable; odd’s ratio = 8.1). On the contrary, in the group of non-smokers, the overall percentage of preterm deliveries was smaller, and the difference attributable to low versus high support did not reach significance (RR = 1.7, 95% CI = 0.6–4.4).
For child bodyweight and length, cases of preterm deliveries were again excluded from analyses, and two-way ANOVAs with two group factors (i.e. smoking status and support group) were computed to address possible interactions between these variables. Two-way ANOVAs revealed significant main effects of social support for both child body length and birthweight (for body length: F = 4.26, P = 0.04; for birthweight: F = 11.35, P = 0.001), but no main effects of smoking. For birthweight, the interaction between support group and smoking status approached significance (F = 3.12, P = 0.078), whereas no evidence for an interaction was found for body length. In subsequent analyses, statistical control of confounding factors by analysis of covariance (ANCOVA) with mothers’ age, height and weight as covariates reduced the main effect of social support for body length to a statistical trend (F = 2.76, P = 0.098) but did not alter the significant main effect of social support for birthweight (F = 7.7, P = 0.006). Univariate ANCOVAs revealed a significant difference in birthweights between low and high social support for smokers (F = 7.12, P = 0.011) but not for non-smokers (Table III).
Effect of smoking on pregnancy outcomes in women with low versus high social support
| Group | Low support | High support | P† | Relative risk (95% CI) | |
|---|---|---|---|---|---|
| Any pregnancy complication1[% (n)] | Non-smoker | 18.9 (20) | 14.5 (22) | NS | 1.3 [0.75–2.27] |
| Smoker | 34.0 (18) | 10.3 (3) | 0.019 | 3.3 [1.06–10.2] | |
| Preterm delivery1 [% (n)] | Non-smoker | 6.1 (8) | 4.1 (7) | NS | 1.7 [0.62–4.44] |
| Smoker | 10.0 (6) | 0 | 0.050 | (Cannot be calculated) | |
| Child bodylength2 (in cm*) | Non-smoker | 51.54 ± 2.06 [47–55] | 51.82 ± 2.32 [47–58] | ANOVA, Support: P = 0.04 | − |
| Smoker | 50.43 ± 2.81 [43–57] | 51.76 ± 2.31 [47–55] | − | ||
| Child bodyweight2 (in g*) | Non-smoker | 3418 ± 384 [2250–4555] | 3542 ± 503 [2510–4990] | ANOVA, Support: P = 0.001 | − |
| Smoker | 3175 ± 453aa [2100–4080] | 3571 ± 409a [2730–4170] | Smoking × Support: P = 0.078 | − |
NS, non-significant (P > 0.1); CI, confidence interval.
Reported by the gynaecologist/obstetrician.
Reported by the mother.
Presented as mean ± SD [miminum–maximum].
Dichotomous variables (i.e. pregnancy complications and preterm delivery), P values given are the results of chi-square tests comparing the low and high social support groups separately for non-smokers and smokers; for continuous variables (i.e. child length and weight), two-way ANOVAs with two main group factors (smoking status and support group) were calculated. For child weight, the P values depict a significant main effect of support, and a statistical tendency for an interaction between smoking status and support group; no significant main effect for smoking was found. For P values and analysis of covariance (ANCOVA) results for these variables, see text.
There was a significant difference in mean birthweight between smoking mothers in the low versus high support group (P = 0.005), calculated by one-way ANCOVA with mother’s age, height and weight as covariates (F = 7.12, P = 0.011).
Multivariate regressions to predict birthweight
To address the contribution of social support to birthweight, we computed stepwise multiple regression analyses. Given the high inter-correlations of psychological variables (data not shown), we initially aimed to identify (the) psychological variable(s) which could be used to predict birthweight and carried out a stepwise multiple regression with the following variables as predictors: social support score, depression (ADS-K) score and quality of life (SF-36) score. Social support (β = 0.158, P < 0.001) was found to be the only variable that entered the model (F = 12.6, P = 0.001, R2 = 0.023). Hence, the contribution of social support to the criterion birthweight was greater than the contribution of the other psychological parameters, although the amount of variance explained by merely psychosocial variables was very low.
Based on these results, in a second set of multiple, stepwise regressions, we used social support score in addition to age, smoking status, education, employment status, weight, height and chronic disease of the mother and pregnancy complications as predictor variables. For birthweight, predictor variables that entered the model included social support (β = 0.124, P < 0.01), smoking (β = –0.134, P < 0.01), weight of the mother (β = 0.193, P < 0.001) and pregnancy complications (β = –0.132, P < 0.01). This model was statistically significant (F = 10.52, P < 0.001) and explained 8.1% of the variance in birthweight (R2 = 0.082).
Discussion
Babies born to mothers with low social support during early pregnancy were smaller and had a markedly reduced birthweight by nearly 200 g on average, after exclusion of preterm deliveries. Low birthweight, a marker of adverse intrauterine circumstances, is associated with an increased risk for a range of disease outcomes in adult life, including cardiovascular diseases, type 2 diabetes, and osteoporosis (Antoniades et al., 2003; Barker and Lackland, 2003; Bhargava et al., 2004; Barker et al., 2005; Kajantie et al., 2005; Syddall et al., 2005). Indeed, size at birth has emerged as a predictor of mortality in adulthood (Kajantie et al., 2005), with a reduction in all-cause mortality risk by age 75 years by 0.86% per 1 SD increase in birthweight (Syddall et al., 2005). In developed countries with exploding healthcare costs, the health consequences of impaired prenatal development have considerable economic implications. To date, the role of social support in fetal intrauterine development remains incompletely understood. Our findings further support and extend previous evidence on the adverse effects of low social support on the occurrence of pregnancy complications and pregnancy outcomes, including birthweight (Cliver et al., 1992; Collins et al., 1993; Dejin-Karlsson et al., 2000; Da Costa et al., 2000a; Dejin-Karlsson and Ostergren, 2003), labour progress and babies’ Apgar scores (Pagel et al., 1990; Collins et al., 1993), preterm birth (Badr et al., 2005) and neural tube defects (Suarez et al., 2003).
There exist multiple pathways that could mediate effects of insufficient social support on pregnancy outcome. Women with low social support lack effective psychosocial resources, particularly social stability and social participation and therefore receive insufficient emotional and instrumental support from the partner, family and/or friends. During early pregnancy, a time of significant life change requiring major psychological adjustments (Da Costa et al., 1999), the perception and expectation of insufficient support clearly have a detrimental impact on maternal psychological well-being (Neter et al., 1995; Morse et al., 2000; Nielsen Forman et al., 2000; Horowitz and Goodman, 2004). Hence, one obvious mechanism mediating effects of social support on pregnancy outcomes is by increasing maternal stress, anxiety and depression, previously found to predict low birthweight, prematurity and intrauterine growth retardation (Rondo et al., 2003; Badr et al., 2005), probably via pathways of the biological stress systems, including hormones and immune mediators (Arck, 2001; Arck et al., 2001; Kramer et al., 2001; Ruiz et al., 2003; Knackstedt et al., 2005). Although our finding of markedly increased depressive symptoms and reduced quality of life in pregnant women with low social support would be consistent with this model, cause-effect relationships cannot be established based on our data, and social support has been found to affect pregnancy outcome even in women with little life stress (Hoffman and Hatch, 1996). Nevertheless, our regressional analyses did identify social support rather than depressive symptoms or quality of life as a significant predictor of birthweight, supporting the notion that the observed effects on pregnancy outcome did not merely reflect poor psychological adjustment of pregnant mothers.
In addition to effects on maternal emotional well-being and quality of life, social support networks affect pregnancy-related health behaviours and lifestyle habits, including dietary habits and smoking (Sheehan, 1998; Heaman et al., 2005; Harley and Eskenazi, 2006). Indeed, in our sample, a markedly greater percentage (i.e. 34%) of women with low social support self-reportedly smoked during the first trimester of pregnancy, compared to only 17% in the high social support. Given the importance of passive or active smoking for pregnancy outcomes (Brooke et al., 1989; Dejin-Karlsson and Ostergren, 2003; Hofhuis et al., 2003; Rasmussen and Irgens, 2006), we addressed the effects of social support separately for smokers and non-smokers. In smokers, effects of social support on pregnancy complications, including preterm delivery, and babies’ birthweight and size were remarkable. Birthweights of babies born to mothers who had smoked during early pregnancy were markedly and significantly reduced in women with low support (3175 ± 453 g) compared to babies of smoking mothers with high support (3571 ± 409 g). Low birthweight renders the offspring prone to cardiovascular diseases and diabetes (Hales and Barker, 2001), and smoking during pregnancy is a known risk factor for the development of asthma in the offspring in later life (Lannerö et al., 2006). In addition, amongst smokers, the proportion of pregnancy complications was significantly higher in women with low support (34%) compared those with high support (10%), reflected by a markedly increased RR (i.e. 3.3). On the contrary, in the group of non-smokers, effects of social support on pregnancy outcomes were smaller or absent (RR: 1.3). Notably, smoking behaviour during pregnancy is largely determined by sociodemographic factors and psychosocial stress (Dejin-Karlsson et al., 1996; Bullock et al., 2001; Elizabeth Jesse et al., 2006) rather than lack of awareness regarding the health risks (Haslam et al., 1997). Interestingly, a recent review of smoking cessation interventions in fact observed that a strategy comprised of rewards plus social support resulted in greater smoking reduction than other strategies (Lumley et al., 2004). Hence, smoking during pregnancy could be viewed as one of the consequences of poor psychosocial adjustment.
Together, these data support the notion that lack of social support represents an important risk factor during pregnancy, and its consequences may be markedly exacerbated by additional risk factors such as smoking. Strong support networks, on the contrary, appear be protective, particularly in the presence of additional risk factors such as smoking and chronic distress, which is illustrated by our findings of fewer pregnancy complications and comparable birthweights between smokers (3571 ± 409 g) and non-smokers (3542 ± 503 g) in women with high social support. The question whether strong support networks improve pregnancy outcomes by providing effective psychosocial resources and thereby protecting pregnant women against life stress and psychopathology (Glazier et al., 2004), or whether they (also) reflect more favourable socioeconomic circumstances (Spencer et al., 1999; Spencer and Logan, 2002), deserves further study. These results may have implications for the prevention of pregnancy complications and low birthweight in mothers at risk and may be also relevant in the context of smoking cessation interventions. If indeed social support interacts with additional risk factors or specific clinical conditions to promote adverse pregnancy outcomes, identifying and treating women with dysfunctional support networks would be a primary treatment goal. Although efforts have been made to develop instruments to reliably identify women at risk based on their psychosocial and emotional situation (Bernazzani et al., 2005), an assessment of psychosocial and emotional status is not consistently applied in practice. Previous attempts to improve psychosocial support, prenatal or post-natal, in women at risk has taken different forms, such as nurse-led weekly telephone calls, home visits from nurses or social workers, informational meetings and invitations to local support groups (Oakley et al., 1990; Villar et al., 1992; Bullock et al., 2002; Reid et al., 2002; Kern et al., 2004; Matthey et al., 2004; Lumley et al., 2006), but the results have been inconsistent. Indeed, two Cochrane reviews have concluded that there was no benefit of additional support during pregnancy either for reducing premature birth or low birthweight (Hodnett and Fredericks, 2003) or for preventing post-partum depression (Dennis and Creedy, 2004). These negative findings may at least in part be related to the fact that selection into trials did not take into account the prior perception of social support. Another unsolvable problem may lie in the fact that it is the functional, qualitative aspect of social support that matters. Whereas it is relatively feasible to offer instrumental support to women at risk, providing emotional support, improving social integration and increasing the number of trusted individuals cannot be easily achieved. Nevertheless, to be able to find individual solutions for pregnant women at risk, healthcare professionals need to be aware of the importance of psychosocial factors in maternal well-being and pregnancy outcomes.
Acknowledgements
We are indebted for the support of the 99 clinicians in private practice in Berlin and their staff. The authors would further like to thank all members of their teams, especially E. Hagen, P. Moschansky and P. Busse for their exceptional technical assistance and continuous support during the course of this study. P.A and M.R. are part of the EMBIC Network of Excellence, co-financed by the European Commission throughout the FP6 framework program ‘Life Science, Genomics and Biotechnology for Health’. All researchers involved in the project described herein are independent from funders.
