


Abstract
Background Summer predominance of tuberculosis (TB) was reported previously in temperate regions. No consistent data were available for lower latitudes.
Method The monthly TB notification data in Hong Kong from 1991 to 2002 were examined for seasonal fluctuation. A seasonal model was then developed after standardization by period, sex, age, history of TB, form of disease, and bacteriological status.
Results The raw monthly counts showed remarkably consistent seasonal fluctuation across different periods, sexes, and age groups. A sine model was fitted for 82 104 notifications (adjusted R2 = 0.373, P < 0.001). A summer peak was observed with seasonal fluctuation of 18.4% (P < 0.001), which was substantially higher than that reported previously for temperate regions. The amplitudes of fluctuation were 35.0, 15.0, 19.0, and 20.2% for those aged ≤14, 15–34, 35–64, and ≥65 years, respectively (all P < 0.001). No gender difference was noted (18.2% vs 19.0%, P = 0.790). Seasonal pattern was detected among new cases (18.6%, P < 0.001), but not retreatment cases (5.2%, P = 0.333). Culture-positive cases showed greater fluctuation than culture-negative cases (29.4% vs 6.4%, P < 0.001). No significant difference was found between pulmonary and extrapulmonary cases (16.8% vs 21.6%, P = 0.356). TB cases notified in summer were more likely to be smear-positive [odds ratio (OR) 1.100, 95% confidence interval (CI) 1.045–1.158, P < 0.001] and culture-positive (OR 1.175, 95% CI 1.121–1.232, P < 0.001) than those notified in winter, even after stratification by other key variables.
Conclusion A consistent seasonal pattern was found, with variable amplitudes of fluctuation in different subgroups and differing disease characteristics in different seasons. These observations are suggestive of the presence of a seasonal disease-modifying factor.
While seasonal variation has been widely reported for many respiratory infections in different parts of the world, it is much less well documented for tuberculosis (TB). Two previous studies have reported summer predominance of TB, in contrast with most other respiratory infections in temperate regions.1,2 Both studies were based on analysis of the aggregated notification data. Variations among different sexes and age groups, or differential effects of different forms of TB have not been examined in depth, although they might throw light on the underlying mechanism. Systematically collected data were scanty for tropical and subtropical countries, but a study in Malawi in sub-Saharan Africa reported predominance of TB in the wet season,3 while another study in the Western Cape Province of South Africa reported increased prevalence of positive TB culture among children in late winter and early spring.4 A number of reports have also associated TB with vitamin D deficiency.5,6 As solar radiation is an important source of vitamin D, it is tempting to associate such a pattern with vitamin D, particularly in temperate regions with greater seasonal variation of such radiation. To examine the seasonal variation for TB in Hong Kong, we stratified the notification statistics for the entire population of Hong Kong from 1991 to 2002 by month, year, sex, age group, and form of disease and constructed a sine model to examine the degree of fit for the monthly notification data.
Materials and methods
The monthly notification statistics for all forms of active TB among different sex and age groups from 1991 to 2002 were retrieved from the TB notification registry kept by the Department of Health of Hong Kong. The raw monthly counts were examined with stratification by sex and age groups. After that, a stepwise approach was undertaken in the modelling process. The inclination of the Earth's rotational axis to its orbit around the sun, with the consequential variation in solar radiation, is the underlying reason for the seasonal change. This provides the rationale for the fitting of a sinusoidal curve in this study and in other seasonal models using the cosinor analysis.1
In the first stage, a general linear model was applied to the raw monthly counts. Sex, age groups and years of notification were taken as fixed factors together with a sine transformation of the monthly sequence, SINEMONTH, in the form of sine{π(monthordinal + k)/6}, and the sex-age-year-specific mean monthly count as the weighing factor. The value of k was set initially to make the trough of the sine curve falling mid-way between the two adjacent months with the lowest monthly counts. The final value of k was determined by progressively dissecting between the two adjacent points with the highest partial correlation (between the sine function and the monthly count), until the resulting value was static or decreasing. Type III sums of squares, the default method, for the univariate general linear model in SPSS version 10.0 was employed in the analysis.
In the second stage, the monthly data for a particular sex and age group over four consecutive years were aggregated to minimize the effect of random fluctuation, in view of the small numbers involved for certain groups. The aggregated raw counts were transformed into a standardized score to allow for the varying magnitudes of the raw counts for different sex and age groups during different 4 year periods, as well as the varying numbers of days for different months. For each category of the monthly sequence (monthordinal), the expected count from any group of interest was obtained by multiplying the mean daily count for each period with the exact number of days involved. The difference between the observed and expected count was divided then by the expected count to give a standardized score. The expected count was also used as the weighing factor to allow for the varying cluster sizes. The modelling process was repeated as above, with the best-fitting value of k recalculated. All non-significant factors (and intercept) were removed leaving a simplified final model.
The variables of period, sex, and age were then applied in turn for selection of different subsets of input data. The derived sine model was applied to each of these subsets. As more detailed breakdown was available for the 1999–2002 notification statistics, they were further stratified, in addition to month, period, sex, and age, by history of TB (new/retreatment), form of TB (pulmonary/extrapulmonary) and culture (positive and negative ). The same model was applied to the different subgroups by different treatment history, form of TB, and smear/culture status in turn.
The amplitudes of the seasonal fluctuation for the overall model and different subgroups were estimated by twice the coefficient for the sine curve (2β). The amplitudes of fluctuation were also compared between different subgroups. For each stratifying factor, the subgroup with the lower (or lowest) amplitude of fluctuation was taken as the reference group.
The 12 month sequence was then divided into two equal halves of 6 months centred around the estimated peak and trough notification point. The disease characteristics were compared between peak and trough period using univariate and stratified analysis. A two-tailed P-value of <0.05 was taken as statistically significant.
Results
From 1991 to 2002, there were altogether 82 161 TB notifications to the TB notification registry of Hong Kong. The age information was missing in 57 notifications, leaving 82 104 notifications in this study. The raw counts showed remarkably consistent seasonal fluctuation across different periods, sexes, and age groups. Figure 1 shows the seasonal variation for the aggregated notification over three consecutive 4 year periods. The mean monthly counts were 535.6 ± 63.3 (SD), 571.7 ± 100.51 (SD), and 603.2 ± 72.3 (SD) for the periods 1991–1994, 1995–1998, and 1999–2002, respectively. The trough occurred in either January or February, while the peak occurred between May and August for the three periods. The magnitudes of spread between the peak and the trough were 210.5, 274.0, and 175.0 for the three 4 year periods, and these corresponded to 39.3, 47.9, and 29.0% of the corresponding mean monthly levels.
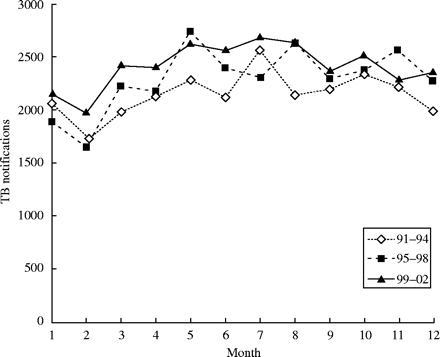
Distribution of TB notifications by months of the year in Hong Kong, 1991–2002
Table 1 summarizes the amplitude of seasonal fluctuation in monthly counts and monthly day-counts (the former divided by mean number of days in that month). The seasonal fluctuation became less marked after allowing for the different number of days in each month.
Amplitude of seasonal fluctuation in monthly raw counts expressed on per month and per day basis by sex and age group
| Monthly count | Day counta | |||||||
|---|---|---|---|---|---|---|---|---|
| Group | Mean ± SD | Spreadb (%)c | Mean ± SD | Spreadb (%)c | ||||
| Female | ||||||||
| 0–14 | 4.01 ± 2.26 | 2.42 (60.21) | 0.132 ± 0.074 | 0.071 (53.69) | ||||
| 15–34 | 73.63 ± 13.60 | 24.42 (33.16) | 2.416 ± 0.436 | 0.625 (25.86) | ||||
| 35–64 | 63.31 ± 14.34 | 22.67 (35.80) | 2.077 ± 0.458 | 0.593 (28.53) | ||||
| 65+ | 48.38 ± 16.79 | 18.08 (37.38) | 1.587 ± 0.546 | 0.487 (30.70) | ||||
| Male | ||||||||
| 0–14 | 3.78 ± 2.24 | 2.42 (63.97) | 0.124 ± 0.074 | 0.078 (62.86) | ||||
| 15–34 | 79.39 ± 18.19 | 24.67 (31.07) | 2.604 ± 0.583 | 0.612 (23.51) | ||||
| 35–64 | 167.67 ± 25.84 | 57.75 (34.44) | 5.500 ± 0.807 | 1.492 (27.12) | ||||
| 65+ | 130.01 ± 35.06 | 47.00 (36.15) | 4.265 ± 1.131 | 1.231 (28.87) | ||||
The mean of monthly raw counts after division by the number of days in the corresponding month.
The difference between mean values for the highest and lowest months.
Percentage of the mean.
An initial model was constructed using weighted least squares regression, with the raw monthly counts as dependent variable, sex, age group, year of notification as fixed factors, SINEMONTH as covariate, and sex-age-year-specific mean monthly count as a weighing factor as shown in Table 2. The trough of notification was clearly identified between January and February. By progressively dissecting between two adjacent points with highest partial correlation (between the sine function of month and the monthly count), the value of k was set at 7.563.
Initial and final sinusoidal seasonal model for monthly TB notifications from 1991–2002
| General linear model | df | Mean square | F | Significance | η2 | |||||
|---|---|---|---|---|---|---|---|---|---|---|
| Initial modela | ||||||||||
| Model | 96 | 2069446.288 | 100.046 | <0.001 | 0.901 | |||||
| Intercept | 1 | 74923983.640 | 3622.141 | <0.001 | 0.774 | |||||
| SINEMONTH | 1 | 5383972.795 | 260.284 | <0.001 | 0.198 | |||||
| Sex | 1 | 8453134.186 | 408.660 | <0.001 | 0.279 | |||||
| Age Group | 3 | 9226488.643 | 446.047 | <0.001 | 0.559 | |||||
| Year | 11 | 39353.093 | 1.902 | 0.035 | 0.019 | |||||
| Final modelb | ||||||||||
| Model | 1 | 349.794 | 171.971 | <0.001 | 0.375 | |||||
| SINEMONTH | 1 | 349.794 | 171.971 | <0.001 | 0.375 | |||||
Initial model: dependent variable = monthly TB notifications, predictors: SINEMONTH, sex, age group, year of notification, SINEMONTH = sine {π(monthordinal + 7.563)/6}, weighted by sex-age-year-specific mean monthly count, R2 = 0.901 (Adjusted R2 = 0.892).
Final model: dependent variable = standardized monthly score, predictor: SINEMONTH, SINEMONTH = sine {π(monthordinal + 7.531)/6}, weighted by expected count (mean daily count 3 number of days), R2 = 0.375 (Adjusted R2 = 0.373).
The raw monthly counts were aggregated over three consecutive 4 year periods (i.e. 1991–1994, 1995–1998, 1999–2002) and transformed into standardized scores as specified above. The same model was repeated with the raw count replaced by the standardized score, and year replaced by period, and the weighing factor of mean monthly count replaced by expected count. With such standardization, the effects of the period of study, sex, and age (and their interaction) were successfully nullified, leaving a final model containing only a single predictor variable, SINEMONTH, with a reasonable adjusted R2 of 0.373 (Table 2). The value of k was re-estimated as above to be 7.531. Taking all sex and age groups together, the degree of fluctuation (2β) was as large as 18.4% (95% CI 15.8–21.2). The null hypothesis that the amplitude of seasonal fluctuation is zero was rejected at a significance level of <0.001.
The variables of period, sex, and age were then applied in turn for selection of different subsets for input into the model. The results are as listed after the overall model in Table 3. For 1999–2002 notification data, the stratifying variables of history of TB (new/retreatment), form of TB (pulmonary/extrapulmonary), and culture (positive/negative) were applied for the selection of input data, and the results are as depicted in the upper part of Table 4. The lower part of Table 4 summarizes the results of similar analysis, focusing on new pulmonary TB cases alone.
The amplitudes of seasonal fluctuation for the overall model and different subcategories by period, sex, and age, 1991–2002
| Selection criterion | Amplitudeb(%) | SEc(%) | 95% CI | η2 | Pa | |||||
|---|---|---|---|---|---|---|---|---|---|---|
| Overall | 18.4 | 1.4 | 15.8–21.2 | 0.375 | – | |||||
| Period | ||||||||||
| 91–94 | 16.8 | 2.4 | 11.8–21.6 | 0.330 | Reference | |||||
| 95–98 | 21.2 | 3.0 | 15.4–27.2 | 0.346 | 0.252 | |||||
| 99–02 | 17.4 | 1.8 | 13.8–20.8 | 0.514 | 0.842 | |||||
| Sex | ||||||||||
| M | 18.2 | 1.8 | 14.6–21.8 | 0.420 | 0.790 | |||||
| F | 19.0 | 2.4 | 14.4–23.6 | 0.313 | Reference | |||||
| Age | ||||||||||
| 0–14 | 35.0 | 7.6 | 19.8–50.2 | 0.229 | 0.014 | |||||
| 15–34 | 15.0 | 2.8 | 9.6–20.6 | 0.296 | Reference | |||||
| 35–64 | 19.0 | 2.6 | 13.6–24.2 | 0.412 | 0.295 | |||||
| 65+ | 20.2 | 2.6 | 14.8–25.4 | 0.451 | 0.174 | |||||
Two-tailed P-value for difference in amplitude of seasonal fluctuation (2β); the subcategory with the lowest amplitude was employed as reference for comparison within meach selection factor.
Amplitude of seasonal fluctuation.
Standard error.
The amplitudes of seasonal fluctuation for the overall model and different subcategories, 1999–2002
| Selection criterion | Amplitudeb(%) | SEc(%) | 95% CI | η2 | Pa | |||||
|---|---|---|---|---|---|---|---|---|---|---|
| Overall | 17.2 | 1.8 | 13.8–20.8 | 0.123 | – | |||||
| History of TB | ||||||||||
| New cases | 18.6 | 2.0 | 14.8–22.4 | 0.193 | Reference | |||||
| Retreatment | 5.2 | 5.2 | 25.2–15.6 | 0.003 | 0.016 | |||||
| Form of disease | ||||||||||
| Pulmonary | 16.8 | 2.0 | 12.8–20.6 | 0.163 | Reference | |||||
| Extrapulmonary | 21.6 | 4.8 | 12.2–31.0 | 0.058 | 0.356 | |||||
| Culture status | ||||||||||
| Culture+ | 29.4 | 2.4 | 24.6–34.2 | 0.292 | 0.000 | |||||
| Culture2 | 6.4 | 2.4 | 1.6–11.0 | 0.021 | Reference | |||||
| New pulmonary | ||||||||||
| All | 18.2 | 2.2 | 13.6–22.6 | 0.253 | – | |||||
| Smear+ | 29.2 | 3.4 | 22.6–36.0 | 0.445 | 0.001 | |||||
| Culture+ | 30.4 | 3.2 | 24.2–36.6 | 0.495 | 0.000 | |||||
| Culture2 | 5.9 | 2.7 | 0.5–11.3 | 0.048 | Reference | |||||
Two-tailed P-value for difference in amplitude of seasonal fluctuation (2ß); the subcategory with the lowest amplitude was employed as reference for comparison within each selection factor.
Amplitude of seasonal fluctuation.
Standard error.
Table 5 depicts the results of further univariate and Mantel–Haenzel stratified analysis of the disease characteristics of TB cases notified from November to April vs those notified from May to October in the period from 1999 to 2002. TB cases notified in the summer months were more likely to be new cases, even after stratification by sex, age groups, and form of disease in Mantel–Haenzel analysis (Table 5). However, there was no difference in the proportion of extrapulmonary TB. Higher proportions of TB cases in the summer months were smear-positive and culture-positive in both univariate and Mantel–Haenzel analysis (all P < 0.001).
Univariate and Mantel–Haenzel stratified analysis of the disease characteristics of TB cases notified from November to April vs those notified from May to October in the period from 1999 to 2002
| Characteristic | Nov–Apr n (%) | May–Oct n (%) | Pa | ORb | 95% CI |
|---|---|---|---|---|---|
| New case | 12 246 (90.21) | 14 008 (91.09) | 0.008 | 1.115 | 1.029–1.208 |
| Extrapulmonary | 1483 (10.92) | 1719 (11.18) | 0.493 | 1.016 | 0.942–1.096 |
| Smear-positive | 3975 (29.28) | 4788 (31.13) | <0.001 | 1.100 | 1.045–1.158 |
| Culture-positive | 6182 (45.54) | 7586 (49.33) | <0.001 | 1.175 | 1.121–1.232 |
P for χ2 in univariate analysis.
Mantel–Haenzel Common Odds Ratio after stratification for sex, age group, history of TB (except for new cases vs retreatment cases), and form of disease (except for extrapulmonary TB vs pulmonary TB).
Discussion
In this study, the TB notification figures were lowest between January and February in winter and highest between July and August in summer, similar to what has been reported in temperate region.1,2 For acute respiratory infections with short latent period, variation in transmission dynamics is likely to exert a direct effect on the seasonal pattern. The situation is more complex with a chronic and endemic infection like TB, for which both new infection and reactivation account for the observed incidence at any particular moment in time. With the establishment of a definite seasonal variation in disease incidence (Tables 1–4) and characteristics (Table 5), it would be tempting to associate such fluctuation with an environmental factor displaying similar seasonal variation.
Vitamin D has been postulated as a possible cause underlying the seasonal pattern of TB in temperate regions.1,6 Vitamin D is a known modulator of macrophage function.7,8 Its immune-modulating function may potentially account for the seasonal variation of TB incidence and disease characteristics in this study. The cutaneous synthesis of vitamin D is dependent on sunlight. Cyclical variation in vitamin D level has been documented in both temperate and lower latitudes.9–13 The serum level of 25-hydroxy vitamin D has been found to lag behind the change in a ultraviolet radiation by one month in a previous study in Australia.14 TB is often a slowly progressing disease. Weeks or months may be required for the disease to develop and manifest.15 Even after its manifestation, there may be further delay in seeking care, or in diagnosis and reporting. Indeed, the median case finding delay was around 3 months in a previous study.16 It is therefore not surprising to find a lag period close to 6 months as implied by the summer predominance of TB shown in this and another study.1 As sputum bacteriology has been associated with disease severity,17 the presence of more smear-positive and culture-positive disease in the peak notification season in this study is highly suggestive of the existence of a disease-modulating factor, rather than simple increase in disease risk alone.
Hong Kong is situated in the subtropical region at a latitude level of around 22.58, and plenty of sunlight is expected all-year round. Summer is typically a wet season, the overcast weather may be expected to shield off some sunlight. Notwithstanding this, data from the Hong Kong Observatory indicated a clear excess of solar radiation in summer. From 1961 to 1990, the mean daily solar radiation was lowest in February (10.69 MJ/m2) and highest in July (19.15 MJ/m2), a pattern closely resembling the seasonal TB trend.18 The effect of solar radiation on vitamin level is expected to be maximal when the oral intake of the vitamin is low or marginal. Indeed, vitamin D deficiency is often seen together with other nutritional deficiencies in poor countries or among certain at-risk groups in developed countries. In the relatively affluent society of Hong Kong, malnutrition is not a common phenomenon. However, as lactose intolerance is common among the adult population, and the consumption of milk products is generally low, the oral intake of vitamin D could be marginal among some of the underprivileged groups.19 The darker skin pigmentation of Orientals, in comparison with Caucasians, may also have reduced the photosynthesis of vitamin D in the skin, but the effect was shown to be marginal in a previous study.20
While the nature of data available from this study is certainly insufficient for any definite conclusion on the underlying mechanism(s), a number of points are worthy of attention. The amplitude of seasonal fluctuation was as high as 18.4%, which was considerably higher than the figure of 10% reported in England and Wales.1 Effect of ethnicity has been suggested in another previous study in England, Wales, and Scotland, where the seasonal trend was influenced by those of Indian Subcontinent ethnic origin, and a conclusive seasonal pattern was not present in the ‘white’ population.6 Mean 25-hydroxy vitamin D levels were highest in non-Hispanic whites, intermediate in Mexican Americans, and lowest in non-Hispanic blacks in the United States.21 Social factors and skin pigmentation associated with ethnicity probably accounted for such observations. The overwhelming majority of TB patients in Hong Kong are of Chinese origin,22 but it is uncertain how much this has contributed to the different degrees of seasonal fluctuation observed between Hong Kong and the United Kingdom. Despite the relatively large difference in TB rates, there was no significant difference in the amplitude of fluctuation between the two sexes. However, there is some evidence for increased seasonal fluctuation among those <15 years, and to a much lesser extent, among those >65 years. The seasonal fluctuation has also been reported to be more prominent among those >60 years of age in Birmingham.6 These observations could have reflected the increased susceptibility of the growing child to vitamin D deficiency10–12 and the increased prevalence of such deficiency among the elderly.9,12
Other possibilities do exist, for example, the seasonal variation in transmission risk and illness behaviour. In this study, significant heterogeneity was seen among the different categories of disease (Table 4). The seasonal trend is only evident among the new TB cases, but not the retreatment cases. These findings are in keeping with the observation of higher amplitude of fluctuation among the younger age group as more of the TB cases are expected to be new cases. Indeed, such observation might lend support to an increased risk of transmission hypothesis as suggested by a previous study.2 There is little information on the transmission risk during different seasons in Hong Kong. With the lower temperature in the winter months, windows are often closed and people may congregate in poorly ventilated areas. However, one could equally argue that the extensive use of air-conditioning with largely re-circulation of air in the absence of special bacterial filtration system might equally increase the transmission risk in hot summers. As mentioned above, the increased proportions of smear-positive and culture-positive cases in summer (Table 5) strongly suggest the presence of a disease-modulating factor, rather than a simple increase in transmission alone. As pulmonary and extrapulmonary TB tend to develop at different time points after infection,15 asynchrony in their seasonal fluctuations would be expected if such fluctuations were the result of increase in recent transmission. However, the relative proportions of pulmonary and extrapulmonary cases did not change with seasons in this study (Table 5). It should also be noted that an increase in recent transmission will also lead to increase of retreatment cases by re-infection, which is certainly not rare in a high-prevalence area like Hong Kong. The absence of seasonal effect on retreatment cases is puzzling, but the immune state may, conceivably, differ significantly between those who have developed and recovered from TB and those who have never developed TB. It is therefore still possible for a disease-modifying factor to interact selectively with persons not previously afflicted.
Seasonal variation in illness-seeking behaviour is another possible factor. Winter is typically a festive season. Attendance statistics from the government chest clinics from 1999 to 2002 showed a lower consultation rate in February, which largely coincided with the Chinese New Year, a major festival for the Chinese. However, festival seasons may not prevent patients from seeking medical attention altogether. Sentinel surveillance of influenza in the Government General Outpatient Clinics from 1999 to 2002 showed the highest attendance rates for influenza-like illnesses from January to March.23 Although the seasonal trend was evident in both culture-confirmed and culture-negative cases, the amplitude of fluctuation was significantly greater among the former than the latter. The higher prevalence of positive bacteriology in the peak notification period, which was suggestive of more severe disease, would be most difficult to explain on a failure to seek medical attention alone. The absence of a similar pattern among retreatment cases would be equally difficult to explain.
In conclusion, a consistent seasonal TB pattern with summer predominance was found in Hong Kong. The differing amplitudes of seasonal fluctuation among different categories of cases, and the higher proportions of smear-positive and culture-positive cases in summer suggest a possible organic basis for the observation, such as variation in solar radiation/vitamin D level. As the nature of currently available information precludes any definite conclusion, further studies in these areas are clearly warranted.
Disclaimer
The authors have not received any financial support for this study or been involved with any organizations with financial interest in the subject matter.
A summer peak was observed with seasonal fluctuation of 18.4%.
A seasonal pattern was detected among new cases, but not retreatment cases.
No significant difference was found between pulmonary and extrapulmonary cases.
Culture-positive cases showed greater fluctuation than culture-negative cases.
Tuberculosis cases notified in summer were more likely to be smear-positive and culture-positive than those notified in winter.
References
Douglas AS, Strachan DP, Maxwell JD. Seasonality of tuberculosis: the reverse of other respiratory diseases in the UK.
Rio M, Garcia-JM, Sanchez JA et al. A statistical analysis of the seasonality in pulmonary tuberculosis.
Bell M, Archibald LK, Nwanyanwu O et al. Seasonal variation in the etiology of bloodstream infections in a febrile inpatient population in a developing country.
Schaaf HS, Nel ED, Beyers N et al. A decade of experience with Mycobacterium tuberculosis culture from children : a seasonal influence on incidence of childhood tuberculosis.
Wilkinson RJ, Llewelyn M, Toossi Z et al. Influence of vitamin D deficiency and vitamin D receptor polymorphisms on tuberculosis among Gujarati Asians in west London: a case–control study.
Douglas AS, Ali S, Bakhshi SS. Does vitamin D deficiency account for ethnic differences in tuberculosis seasonality in the UK?
Gavison R, Bar-Shavit Z. Impaired macrophage activation in vitamin D3 deficiency: differential in vitro effects of 1,25-dihydroxyvitamin D3 on mouse peritoneal macrophage functions.
Abe E, Shiina Y, Miyaura C et al. Activation and fusion induced by 1 alpha,25-dihydroxyvitamin D3 and their relation in alveolar macrophages.
Melin A, Wilske J, Ringertz H et al. Seasonal variations in serum levels of 25-hydroxyvitamin D and parathyroid hormone but no detectable change in femoral neck bone density in an older population with regular outdoor exposure.
Guillemant J, Le HT, Maria A et al. Wintertime vitamin D deficiency in male adolescents: effect on parathyroid function and response to vitamin D3 supplements.
El-Hajj Fuleihan G, Nabulsi M, Choucair M et al. Hypovitaminosis D in healthy schoolchildren.
Fassi J, Russo Picasso MF, Furci A et al. Seasonal variations in 25-hydroxyvitamin D in young and elderly and populations in Buenos Aires City.
MacDonald D, Swaminathan R. Seasonal variation in 25-OH vitamin D in plasma of Hong Kong Chinese. Clin Chem
Pasco JA, Henry MJ, Kotowicz MA et al. Seasonal periodicity of serum vitamin D and parathyroid hormone, bone resorption, and fractures: the Geelong Osteoporosis Study.
Paynter S, Hayward A, Wilkinson P, Lozewicz S, Coker R. Patient and health service delays in initiating treatment for patients with pulmonary tuberculosis: retrospective cohort study. Int J Tuberc Lung Dis
Styblo K, Dankova D, Drapela J et al. Epidemiological and clinical study of tuberculosis in the district of Kolin, Czechoslovakia. Report for the first 4 years of the study (1961–64).
Hong Kong Observatory. Monthly Meteorological Normals and Extremes for Hong Kong. Available at: http://www.hko.gov.hk/wxinfo/climat/normals.htm
Woo J, Ho SC, Mak YT et al. A comparison of the nutritional status of elderly Chinese living in different types of non-acute care institutions in Hong Kong.
Matsuoka LY, Wortsman J, Haddad JG et al. Racial pigmentation and the cutaneous synthesis of vitamin D.
Nesby-O'Dell S, Scanlon KS, Cogswell ME et al. Hypovitaminosis D: prevalence and determinants among African American and white women of reproductive age: third National Health and Nutrition Examination Survey, 1988–1994.
Leung CC, Yew WW, Chan CK et al. Tuberculosis in older people: a retrospective and comparative study from Hong Kong.
Department of Health of Hong Kong. Influenza surveillance: weekly and monthly consultation rates of influenza-like illness reported by General Out-patient Clinics and General Practitioners

