


Abstract
Background: Histologic grade in breast cancer provides clinically important prognostic information. However, 30%–60% of tumors are classified as histologic grade 2. This grade is associated with an intermediate risk of recurrence and is thus not informative for clinical decision making. We examined whether histologic grade was associated with gene expression profiles of breast cancers and whether such profiles could be used to improve histologic grading. Methods: We analyzed microarray data from 189 invasive breast carcinomas and from three published gene expression datasets from breast carcinomas. We identified differentially expressed genes in a training set of 64 estrogen receptor (ER)–positive tumor samples by comparing expression profiles between histologic grade 3 tumors and histologic grade 1 tumors and used the expression of these genes to define the gene expression grade index. Data from 597 independent tumors were used to evaluate the association between relapse-free survival and the gene expression grade index in a Kaplan–Meier analysis. All statistical tests were two-sided. Results: We identified 97 genes in our training set that were associated with histologic grade; most of these genes were involved in cell cycle regulation and proliferation. In validation datasets, the gene expression grade index was strongly associated with histologic grade 1 and 3 status; however, among histologic grade 2 tumors, the index spanned the values for histologic grade 1–3 tumors. Among patients with histologic grade 2 tumors, a high gene expression grade index was associated with a higher risk of recurrence than a low gene expression grade index (hazard ratio = 3.61, 95% confidence interval = 2.25 to 5.78; P <.001, log-rank test). Conclusions: Gene expression grade index appeared to reclassify patients with histologic grade 2 tumors into two groups with high versus low risks of recurrence. This approach may improve the accuracy of tumor grading and thus its prognostic value.
The online version of this article has been published under an Open Access model. Users are entitled to use, reproduce, disseminate, or display the Open Access version of this article for non-commercial purposes provided that: the original authorship is properly and fully attributed; the Journal and Oxford University Press are attributed as the original place of publication with the correct citation details given; if an article is subsequently reproduced or disseminated not in its entirety but only in part or as a derivative work this must be clearly indicated. For commercial re-use, please contact: journals.permissions@oxfordjournals.org .
The histologic grade of breast carcinomas has long provided clinically important prognostic information ( 1 – 3 ) . However, despite recommendations by the College of American Pathologists ( 4 ) that tumor grade be used as a prognostic factor in breast cancer, the latest Breast Task Force of the American Joint Committee on Cancer did not include histologic tumor grade in its staging criteria, because of insurmountable inconsistencies in histologic grading between institutions ( 5 ) . Concordance between two pathologists has been investigated and found to range from 50% to 85% ( 6 – 9 ) . With the advent of new unified methods, such as the Elston and Ellis modification ( 1 ) of the Bloom and Richardson method, the reproducibility of histologic grading has been improved. Although about half of all breast cancers are assigned histologic grade 1 or 3 status (with a low or high risk of recurrence, respectively), a substantial percentage of tumors (30%–60%) are classified as histologic grade 2, which is not informative for clinical decision making because of intermediate risk of recurrence. This high percentage of histologic grade 2 tumors is still observed when grading is performed by a single pathologist ( 1 , 2 , 6 ) . Thus, to increase the prognostic value of tumor grading, refinement of histologic grade 2 status, perhaps into low- and high-risk categories, and improvement of the reproducibility of the technique are necessary.
Recently, gene expression profiling has resulted in a paradigm shift in the way that researchers view breast cancer biology. Gene expression profiling has demonstrated, for example, that estrogen receptor (ER) status is the main discriminator of molecular signatures, supporting a long-held hypothesis that ER-positive and ER-negative breast cancers are different diseases ( 10 ) . Biologically different subtypes among ER-positive tumors and among ER-negative tumors have also been proposed, along with the implications for treatment ( 11 – 14 ) . These observations suggest that gene expression profiling has the potential to change current breast cancer management.
We explored whether gene expression profiling could be used to grade tumors more accurately. We examined whether histologic grades 1–3 were associated with distinct gene expression profiles. To determine the clinical relevance of the gene expression profiles, we also investigated the association between these profiles in primary tumor specimens and relapse-free survival of patients with breast cancer.
P ATIENTS AND M ETHODS
Patient Demographics
We used five gene expression datasets obtained by microarray analysis of tumor specimens from a total of 661 patients with primary breast cancer: the training set KJX64, the validation set KJ125, the National Cancer Institute (NCI) dataset from Sotiriou et al. ( 14 ) , the Stanford/Norway (STNO) dataset from Sorlie et al. ( 12 ) , and the Nederlands Kanker Instituut (NKI) 2 dataset from van de Vijver et al. ( 15 ) ( Table 1 ). The last three datasets are publicly available. Our unpublished datasets KJX64 and KJ125 consist of information obtained from a total of 189 patients with primary operable invasive breast cancer, whose frozen tumor specimens were archived at the John Radcliffe Hospital (Oxford, UK) and the Uppsala University Hospital (Uppsala, Sweden). As shown in Table 1 , the training set KJX64 contained data from 64 ER-positive primary breast tumor samples, and the validation set KJ125 contained data from 125 breast tumor samples. No patient in the KJ125 dataset had received any adjuvant systemic therapy. Treatments received by patients in the published datasets are shown in Table 1 , and other characteristics of patients and their tumors are shown in Table 2 .
Microarray datasets used in this study
| Identifier | Institution | No. of samples | Grade ratio * (1/2/3) | % Grade 2 | ER ratio * (−/+) | Systemic treatment | Microarray platform | Reference |
|---|---|---|---|---|---|---|---|---|
| KJX64 | Uppsala | 24 | 11/0/13 | 0 | 0/24 | Yes † | Affymetrix U133A | Training set (this study) |
| John Radcliffe | 40 | 22/0/18 | 0 | 0/40 | ||||
| KJ125 | Uppsala | 64 | 26/28/10 | 44 | 13/54 | No | Affymetrix U133A | Validation set (this study) |
| John Radcliffe | 61 | 8/18/18 | 41 | 24/32 | ||||
| NCI | John Radcliffe | 99 | 16/38/45 | 38 | 34/65 | Yes ‡ | cDNA (NCI) | Sotiriou et al. ( 14 ) |
| STNO | Stanford | 85 § | 9/33/33 | 44 | 18/56 | Yes ‡ | cDNA (Stanford) | Sorlie et al. ( 12 ) |
| NKI2 ∥ | Nederlands Kanker Instituut | 165 (untreated) | 40/49/76 ¶ | 30 | 43/122 | No | Agilent | Van de Vijver et al. ( 15 ) |
| 130 (treated) | 35/52/43 ¶ | 40 | 26/104 | Yes # | ||||
| Total | 668 | |||||||
| No. of patients in validation set ** | 597 | 134/218/225 | 38 | 158/433 |
Patients with missing histologic grade and estrogen receptor (ER) status information were not included in this ratio.
Tamoxifen only; treatment is not relevant because the follow-up data from these datasets are not used.
Patients received mixed hormone and chemotherapy and a small number of patients were untreated.
Fifteen patients were not used in the survival analysis because of missing or no follow-up time (including seven nonmalignant samples).
Number “2” is used to distinguish this dataset from the NKI dataset of Van't Veer et al. ( 16 ) .
Grading was performed by a central pathologist.
Among these 130 patients, 90 received chemotherapy, 20 received hormone therapy, and 20 received both.
Total excludes patients in the training set KJX64 and nonmalignant specimens in dataset STNO.
Summary of patient and tumor characteristics
| Dataset | |||||||||||
|---|---|---|---|---|---|---|---|---|---|---|---|
| Variable * | KJ125 | NCI | NKI2 (treated) | NKI2 (untreated) | STNO | Total | |||||
| Sample size, No. | 125 | 99 | 130 | 165 | 85 | 604 | |||||
| Median follow-up time, y | 7.49 | 5.65 | 6.87 | 6.63 | 2.08 | 6.05 | |||||
| No. of relapses | 49 | 45 | 44 | 70 | 35 | 243 | |||||
| ER status, No. (%) | |||||||||||
| Negative | 34 (27) | 34 (34) | 26 (20) | 43 (26) | 18 (21) | 155 (26) | |||||
| Positive | 85 (68) | 65 (66) | 104 (80) | 122 (74) | 56 (66) | 432 (72) | |||||
| N/A | 6 (5) | 11 (13) | 17 (3) | ||||||||
| Histologic grade, No. (%) | |||||||||||
| 1 | 34 (27) | 16 (16) | 35 (27) | 40 (24) | 9 (11) | 134 (22) | |||||
| 2 | 46 (37) | 38 (38) | 52 (40) | 49 (30) | 33 (39) | 218 (36) | |||||
| 3 | 28 (22) | 45 (45) | 43 (33) | 76 (46) | 33 (39) | 225 (37) | |||||
| N/A | 17 (14) | 10 (12) | 27 (4) | ||||||||
| Lymph node status, No. (%) | |||||||||||
| Negative | 125 (100) | 46 (46) | 10 (8) | 141 (85) | 23 (27) | 345 (57) | |||||
| Positive | 0 (0) | 53 (54) | 120 (92) | 24 (15) | 53 (62) | 250 (41) | |||||
| N/A | 9 (11) | 9 (1) | |||||||||
| Tumor size, No. (%) | |||||||||||
| ≤2 cm | 76 (61) | 36 (36) | 62 (48) | 93 (56) | 6 (7) | 273 (45) | |||||
| >2 cm | 49 (39) | 63 (64) | 68 (52) | 72 (44) | 69 (81) | 321 (53) | |||||
| N/A | 10 (12) | 10 (2) | |||||||||
| Age, No. (%) | |||||||||||
| ≤50 y | 56 (45) | 29 (29) | 116 (89) | 148 (90) | 26 (31) | 375 (62) | |||||
| >50y | 69 (55) | 70 (71) | 14 (11) | 17 (10) | 50 (59) | 220 (36) | |||||
| N/A | 9 (11) | 9 (1) | |||||||||
| GGI, No. (%) | |||||||||||
| <0 | 76 (61) | 46 (46) | 56 (43) | 88 (53) | 33 (39) | 299 (50) | |||||
| ≥0 | 49 (39) | 53 (54) | 74 (57) | 77 (47) | 52 (61) | 305 (50) | |||||
ER = estrogen receptor; N/A = not available; GGI = gene expression grade index.
Histologic tumor grade was based on the Elston–Ellis grading system and determined from data extracted from the pathology reports and reviewed separately by one pathologist for the Oxford population and another pathologist for the Swedish population. Central pathology review grading had been performed for the external validation dataset NKI2. Each institutional ethics board approved the use of the human tissue material.
Relapse-free survival was defined as the interval between the date of breast surgery and the date of diagnosis of any type of relapse (local, regional, or distant). Distant metastasis–free survival was defined as the interval between the date of breast surgery and the date of a diagnosed distant relapse of breast cancer.
Gene Expression Analysis
For our unpublished dataset, microarray analysis was performed with Affymetrix U133A Genechips (Affymetrix, Santa Clara, CA). This dataset contained samples from Oxford, U.K., and Uppsala, Sweden. RNA was isolated by use of the Trizol method (Invitrogen, Carlsbad, CA), according to the manufacturer's instructions. RNA samples from Oxford were shipped on dry ice at the Jules Bordet Institute in Brussels, Belgium, for processing. For the samples from Uppsala, RNA was extracted at the Karolinska Institute, shipped on dry ice to Singapore, and hybridized at the Genome Institute of Singapore in Singapore. The quality of the RNA obtained from each tumor sample was assessed via the RNA profile generated by the Agilent bioanalyzer. Samples with a total area under the 28S and 18S bands of less than 15% of the total RNA band area, as well as a 28S/18S ratio of less than 1.1, were considered to be degraded and were not analyzed further (approximately 20% of the samples analyzed). Only tumor samples with good quality of RNA were considered for further analysis. RNA amplification, hybridization, and scanning were done according to standard Affymetrix protocols.
Image analysis and probe quantification was done with the Affymetrix software that produced raw probe intensity data in the Affymetrix CEL files. Microarray and clinical data for the 189 patients in the KJX64–KJ125 datasets are available at the Gene Expression Omnibus database ( http://www.ncbi.nlm.nih.gov/geo ), with accession code GSE2990 . Normalization was done with the program RMA ( 17 ) , which processes a group of CEL files simultaneously. The default options of RMA (with background correction, quantile normalization, and log transformation) were used. The CEL files were normalized separately in four groups, according to the institutions (Oxford or Uppsala) and the batches of measurements (untreated or tamoxifen-treated series).
Previously Published Microarray Datasets
The STNO dataset ( 12 ) was downloaded from http://genome-www.stanford.edu/breast_cancer/mopo_clinical/data.shtml . It consisted of 85 arrays, with several different chip designs. To simplify analysis, we used only the probes that were common to all designs. The gene expression values used were from the column entitled LOG_RAT2N_MEAN in the array data files. When two or more spots on an array corresponded to a clone, we used their average. No further transformation was applied before computing the gene expression grade index. Data from all 85 patients were used in the heat map, but patients with missing survival data or those that were reported to have zero follow-up time were excluded from survival analyses. Because tumor size measured in centimeters was not available in the STNO dataset, in the multivariable analysis of prognostic factors, we assigned tumors classified as T1 by the tumor–node–metastasis (TNM) system to be less than or equal to 2 cm and T2–4 tumors to be more than 2 cm. The NKI2 dataset was downloaded from the Rosetta Web site ( http://www.rii.com ). The log ratio of gene expression values was used without further transformation. Flagged expression values were considered missing. The complete clinical data file was obtained from the supplementary materials of West et al. ( 18 ) . To compare the gene expression grade index with the Van't Veer 70-gene signature ( 16 ) , the field entitled “conservFlag” in the clinical data table was used to stratify the dataset into two groups. Each group had its own cutoff for assigning low versus high risk of relapse, as described by van de Vijver et al. ( 15 ) . The NCI dataset was downloaded from the online supplementary materials of Sotiriou et al. ( 14 ) . Expression values were not modified further. The probe sets of the Affymetrix U133A GeneChip were mapped to other microarray platforms by matching the Unigene identifiers (version 180), according to the method in Praz et al. ( 19 ) (Supplemental Table 1, available at: http://jncicancerspectrum.oxfordjournals.org/jnci/content/vol98/issue4 ).
Selection of Grade-Associated Genes
We used 64 samples of ER-positive tumors in our training set KJX64 to select genes that were differentially expressed between histologic grade 1 and 3 tumors. We used only ER-positive tumors for selecting the genes because of the dependence between ER status and histologic grade; almost all ER-negative tumors were classified as either intermediate or high histologic grade (see Fig. 3, A ). If we had used all histologic grade 1 and 3 tumors regardless of the ER status in our training set, we would have selected ER-related genes that were spuriously associated with grade. Our training set KJX64 was a part of a separate ongoing study on tamoxifen resistance that will be reported later; in this study, we used only information on ER status and histologic grade without considering the clinical outcome. For microarray profiling and grading, we used primary tumor tissues that were collected before the beginning of tamoxifen treatment, so that the gene list identified with the training set was not affected by disease outcome or treatment.
The standardized mean difference of Hedges and Olkin ( 20 ) was used to rank genes by their differential expression. This meta-analytical score is similar to the t statistic, but it was better suited for our analysis because our training set consisted of array data from two different laboratories. We used the maxT algorithm of Westfall and Young ( 21 ) to correct for multiple testing, with an extension proposed by Korn et al. ( 22 ) (i.e., Algorithm A*), to control the number of false discoveries (i.e., the number of genes identified by chance alone at a given statistical significance level corrected for multiple testing). This approach takes into account the dependencies between genes. We used 10 000 permutations per gene. No prefiltering was used, and all probe sets in the Affymetrix U133A array were considered.
Gene Expression Grade Index
Standardization that was based on histologic grade 1 and histologic grade 3 status was inevitable because gene expression measures in different platforms are scaled and offset by unknown parameters and because grade compositions vary between datasets. To reduce bias from standardizing the gene expression grade index with patient information about histologic grades 1 and 3, we cross-validated the estimated gene expression grade index. That is, a patient's data were never used to standardize her own gene expression grade index. This procedure is effectively a leave-one-out cross-validation, except that only histologic grade 1 and 3 tumors were left out. Thus, tumors with histologic grade 2 or an unknown grade can be considered pure independent validation samples in the survival analyses.
Although it is possible to use the gene expression grade index as a continuous prognostic factor, it is convenient to group the tumors into two risk categories by use of a cutpoint. This binary classification provides low- and high-risk status that corresponds to and can be compared with histologic grade 1 and 3 status, respectively. Furthermore, this classification makes it possible to compare Kaplan–Meier curves and estimate hazard ratios (HRs) between two groups. We assigned patients a gene expression grade of 1 (low grade) when their gene expression grade index value was negative, and we assigned patients a gene expression grade of 3 (high grade) when it was zero or positive. A gene expression grade index of zero corresponded to the midpoint between the average gene expression grade index values from histologic grade 1 tumors and histologic grade 3 tumors in a given population. The results of the analyses did not change substantially when nearby cutpoints were used, as expected from the large sample size that we used. The hazard ratios increased when the cutpoint was lowered, although more patients were classified as high risk (i.e., corresponding to higher cost of treatment). Our arbitrarily chosen cutpoint might not have been clinically optimal, but it was sufficient to illustrate the prognostic value of gene expression grade index.
Statistical Analysis
For visualizing the gene expression values using heat maps, the values for each probe were centered by subtracting the mean expression value across patients. No gene-specific scaling (standardization) was done, so that the information about the relative signal strength between probes remained. The color tone in the heat maps was calibrated so that saturated red and saturated green were reached at values equal to three times the standard deviation of the expression values of the entire matrix. The gene expression grade index values were not affected by gene-specific centering.
For survival analysis, we used the survival package included in the R statistical analysis software ( http://www.r-project.org ). Hazard ratios and 95% confidence intervals (CIs) were estimated by use of a stratified Cox regression analysis. All stratification in Cox regression analyses was based on the dataset (including the distinction between treated and untreated NKI2). Two-sample comparisons of survival data were done with log-rank tests. The multivariable analysis was performed by use of stratified Cox regression; the assumption of proportionality was confirmed by use of scaled Schoenfeld residuals (as implemented in cox.zph function in the survival package). The P values in multivariable analysis were based on Wald tests. In a specific analysis involving one or more clinical variables, a patient was excluded if the value of at least one variable was missing, resulting in slightly different numbers of patients in various analyses. All statistical tests were two-sided. All figures were produced by custom programs written by one of the authors (P. Wirapati, unpublished programs).
R ESULTS
Differential Gene Expression Between Histologic Grade 1 and 3 Tumors
We used Affymetrix U133A GeneChips to generate expression profiles for tumor specimens from 189 patients with primary operable invasive breast cancer. Sixty-four of these expression profiles were used as the training set KJX64 ( Table 1 ) to identify genes whose expression was statistically significantly different between the 33 histologic grade 1 tumors and the 31 histologic grade 3 tumors. We identified 128 Affymetrix probe sets that corresponded to 97 unique genes by use of a conservative selection threshold ( P = .05, for a false discovery count of greater than 0) that was chosen so that false-positive results were unlikely.
The expression pattern of these 97 genes was fairly homogenous in the training set ( Fig. 1, A ). Most genes were overexpressed in grade 3 tumors and had functions that have been previously associated with cell cycle progression and proliferation (among the top 20 overexpressed genes were UBE2C, KPNA2, TPX2, FOXM1, STK6, CCNA2, BIRC5, and MYBL2; Supplemental Table 2, available at: http://jncicancerspectrum.oxfordjournals.org/jnci/content/vol98/issue4 ). We also identified a larger list of 242 probe sets (including the 128 probe sets above) that we selected under a less stringent threshold ( P = .05, for a false discovery count greater than 2); the list of 242 probe sets and of cross-platform mappings is also shown in Supplemental Table 2. The list of 242 probe sets contained 183 genes that were mapped unambiguously to Unigene identifiers. When we compared the 183 genes with previously published prognostic signatures ( 6 , 16 , 23 ) , we found 30 genes in common with the 231 genes identified to be statistically significantly associated with the outcome by van't Veer et al. ( 16 ) . Of these 231 genes, the top 70 genes were reported by the same authors as an optimal signature; we found that 11 of these 70 genes were also in our 183-gene list. Wang et al. ( 23 ) reported a signature with 76 genes, 60 of which were specifically applicable to ER-positive tumors. We found that seven of these 60 genes were also in our list. Among the 15 genes described by Paik et al. ( 6 ) , five genes in their proliferation gene group were also in our list. These overlaps indicate that these signatures contain substantial number of genes that are associated with tumor grade.
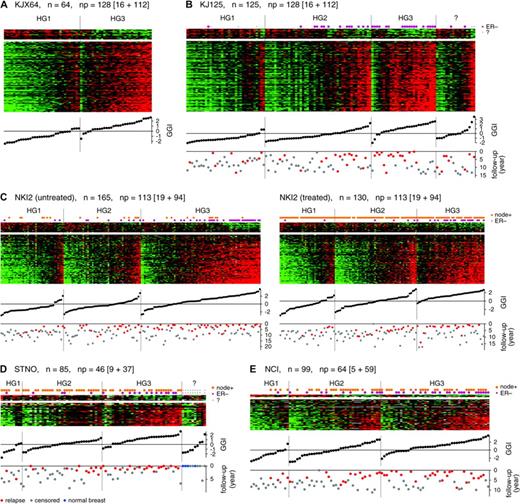
Patterns of expression of grade-related genes and their association with histologic grade (HG) and relapse-free survival. Matrices of relative gene expression values are shown as heat maps. Heat maps are grids of rectangles with colors that indicate the value of the matrix elements, where high expression is red and low expression is green. Rows of each heat map correspond to genes, sorted according to the gene-specific association with histologic grade 1 or 3, as measured by the t statistic. n = number of tumors; np = number of probe sets or clones that is broken down into those highly expressed in HG1 or HG3 tumors (as shown inside the square brackets ). Columns of each heat map correspond to individual tumors, which were sorted first by HG1, HG2, HG3, or unknown grade and then by gene expression grade index (GGI) within each histologic grade category. GGI score of each tumor is plotted below the corresponding column. Relapse-free survival times in years are indicated below the GGI scores ( gray dots = censored; red = relapsed, blue = normal breast). A ) Training set KJX64. B ) Validation dataset KJ125. C ) Dataset NKI2 from Van de Vijver et al. ( 15 ) . D ) Dataset STNO from Sorlie et al. ( 12 ) . E ) Dataset NCI from Sotiriou et al. ( 14 ) .
Selection of Genes Distinctly Expressed in Histologic Grade 2
We used the same gene selection algorithm to compare the gene expression profiles of histologic grade 2 tumors with the profiles from a group of combined histologic grade 1 and 3 tumors. No gene specifically associated with histologic grade 2 was identified by this analysis when we used the statistical significance criteria of P = .05 for false discovery count greater than zero (data not shown). We found no evidence that histologic grade 2 tumors had gene expression profiles that were independent from those that distinguished histologic grade 1 and 3 tumors. Thus, the gene expression profiles of the histologic grade 2 tumors that we analyzed appeared to be intermediate between histologic grade 1 and 3 profiles or to be a heterogeneous mixture of profiles from histologic grade 1 and 3 tumors.
Genes Associated With Histologic Grade 1 and 3 in Independent Validation Sets
To determine whether the gene expression pattern of the 97 genes that we identified in our training set KJX64 would consistently predict histologic grade in an independent group of tumors, we examined the expression of these genes in our validation set KJ125 of specimens from untreated patients with breast cancer ( Fig. 1, B ). The gene expression patterns of histologic grade 1 and 3 tumors were similar to those identified in the training set ( Fig. 1, A ). The association between these gene expression patterns and histologic grades 1 and 3 was also investigated by use of other publicly available datasets (STNO, NCI, and NKI2) that were obtained with different microarray platforms ( Table 1 ). Using the overlaps between genes in the 97-gene list that we identified above and genes that were present in each respective platform, we found associations between the gene expression patterns and histologic grades 1 and 3 that were similar to those obtained with the Affymetrix platform ( Fig. 1, C–E ), despite the difference in the number and compositions of the probes in different platforms.
To summarize the expression values of the genes associated with histologic grade, we developed a score that we termed the gene expression grade index, in which a high index corresponds to high histologic grade and vice versa. The values of this index for all datasets are plotted in heat maps ( Fig. 1 ). In all datasets, we found that the gene expression grade index corresponded well to the gene expression patterns in the heat maps. There was little overlap in the gene expression grade index values between tumors of histologic grade 1 and tumors of histologic grade 3 ( Fig. 1, B ). Only three of 35 histologic grade 1 tumors (9%) had a positive gene expression grade index, and only four of 28 histologic grade 3 tumors (14%) had a negative gene expression grade index. These seven discordant cases could be the result of a technical failure, such as an insufficient sample of tumor tissue for assay. Similar discordance were also found in the training set, but these discordances did not substantially interfere with the gene selection process, as shown by the association of the gene expression grade index with histologic grades 1 and 3 in the validation datasets.
Comparison of Gene Expression Patterns in Histologic Grade 2 Tumors and in Histologic Grade 1 and 3 Tumors
After observing that expression of genes in our 97-gene list was associated with histologic grade 1 and 3 status, we investigated whether the profiles of histologic grade 2 tumors were homogeneously intermediate or a mixture of the profiles of histologic grade 1 and 3 tumors. In heat maps of the validation datasets ( Fig. 1, B–E ), we observed that gene expression profiles of histologic grade 2 tumors ranged from those for histologic grade 1 tumors to those from histologic grade 3 tumors, with some resembling a heterogenous mixture of profiles from both histologic grade 1 and 3 tumors and some being intermediate profiles. We then used the gene expression grade index to quantify the similarity of a profile with typical profiles from histologic grade 1 and 3 tumors. The sorted index values were shown below the heat maps in Fig. 1, C–E for histologic grade 1, 2, and 3 tumors. These plots correspond to the empirical cumulative distribution function of the index within each histologic grade group. If histologic grade 2 tumors were a mixture of two distinct subtypes similar to either histologic grade 1 or 3, we would have seen a strong bimodality visible as a sharp change in the sorted index values. We did not observe this bimodal distribution. Instead, the slope of the index values of histologic grade 2 tumors changed slowly, and thus many tumors had intermediate indices. Furthermore, the range of the index values for histologic grade 2 tumors encompassed those for histologic grade 1 and 3 tumors, indicating that many histologic grade 2 tumors have extreme indices that are similar to those of histologic grade 1 or 3 tumors.
Gene Expression Grade Index in Histologic Grade 2 Tumors and Relapse-Free Survival
To evaluate the gene expression grade index as a prognostic factor, we pooled data from our validation dataset KJ125 and the STNO, NCI, and NKI2 (which was split into treated [NKI2T] and untreated [NKI2U] subsets) datasets and examined the association between histologic grade and relapse-free survival ( Fig. 2, A ). As expected, histologic grade 3 tumors were associated with a higher rate of relapse than were histologic grade 1 tumors (HR = 3.18, 95% CI = 2.1 to 4.8), whereas histologic grade 2 tumors were associated with an intermediate rate of relapse. Of the 570 tumors in this analysis, 216 (38%) were histologic grade 2, confirming previous observations that they were observed in substantial percentage ( 1 , 2 , 6 ).
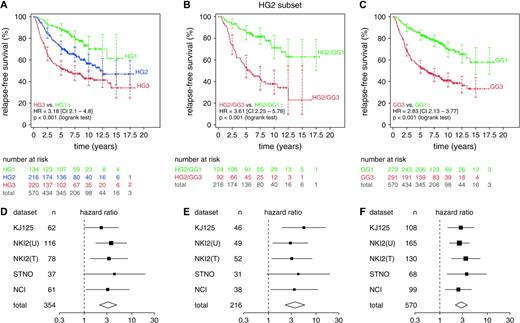
Relapse-free survival analysis for all validation datasets. Only 570 patients with complete histologic grade (HG) and relapse-free survival information were included. Kaplan–Meier analyses were conducted with pooled data. Number of patients at risk and 95% confidence intervals (CIs) for the relapse-free survival estimates (shown as error bars ) are indicated at 2.5-year intervals. Difference in relapse-free survival between two groups is summarized by the hazard ratio (HR) for recurrence with its 95% CI. NKI2(U) = untreated subset of dataset NKI2; NKI2(T) = treated subset of dataset NKI2. A ) Analysis of the whole dataset by HG1 ( green ), HG2 ( blue ), or HG3 ( red ). B ) Analysis of patients with HG2 tumors by gene expression grade (GG). The 217 patients with HG2 tumors were separated into low- and high-risk subsets by GG as GG1 ( green ) and GG3 ( red ), respectively. C ) Analysis of the whole dataset of 572 patients by GG. GG1 = green ; GG3 = red . All statistical tests were two-sided. To show consistency among different datasets, forest plots of the hazard ratios and confidence intervals for individual datasets are shown below the corresponding Kaplan–Meier plots (panels D , E , and F , corresponding to panels A , B , and C , respectively). All statistical tests were two-sided.
To examine the consistency of histologic grading in the different datasets, we used a similar survival analysis for each dataset. The differences between the relapse-free survival associated with histologic grade 1 and 3 tumors, as summarized by hazard ratios and the 95% confidence intervals, are presented in a “forest plot” ( Fig. 2, D ). The hazard ratios from the various datasets were fairly similar to each other, suggesting that no dataset strongly dominated the hazard ratio summary (i.e., “total” in the forest plot), including those from the NKI2 dataset, which was the only dataset in our study graded by a central pathologist (e.g., for the NKI2 [treated] dataset, HR = 3.31, 95% CI = 1.33 to 8.26, and for the NCI dataset, HR = 3.11, 95% CI = 1.08 to 8.93). Also, the percentages of histologic grade 2 tumors in each study were similar across datasets ( Table 1 ). Thus, the histologic grading of the five datasets appeared to be of consistently good quality and thus could be compared with grading that was based on gene expression profiling.
To investigate the clinical significance of histologic grade 2 tumors with either a grade 1-like or a grade 3-like profile, we compared the relapse-free survival of patients who had grade 1–like histologic grade 2 tumors (i.e., gene expression grade 1) with that of patients who had grade 3–like histologic grade 2 tumors (i.e., gene expression grade 3) ( Fig. 2, B ). We found a statistically significant difference in relapse-free survival that was similar to that observed between histologic grade 1 and 3 tumors ( Fig. 2, A ); i.e., among patients with histologic grade 2 tumors, a high gene expression grade index was associated with a higher risk of recurrence than was a low gene expression grade index (HR = 3.61, 95% CI = 2.25 to 5.78; P <.001, log-rank test). Also, the corresponding forest plot ( Fig. 2, E ) indicated fairly similar hazard ratios across all datasets. In dataset NKI2, which underwent central pathology review, the hazard ratios between tumors with high and low gene expression grade were slightly less than those observed in other datasets, possibly because fewer high-risk and low-risk tumors were classified as histologic grade 2. Nevertheless, the hazard ratios in the NKI2 datasets were still statistically significant, indicating that many histologic grade 2 tumors in these datasets could be reclassified by use of gene expression profiling into gene expression grade 1 or 3. When all 570 tumors were grouped according to gene expression grade 1 or 3 ( Fig. 2, C and F ), we obtained relapse-free survival profiles and hazard ratios that were similar to those in Fig. 2, A and B . We expected this result, because histologic grade 1 and 3 status corresponded well with gene expression grade 1 and 3 status, respectively.
Independent Prognostic Value of Gene expression Grade in a Multivariable Model
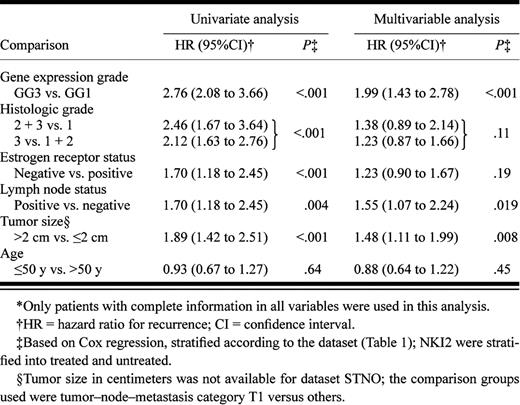
We examined several variables in a univariate analysis ( Table 3 ) and found that gene expression grade, histologic grade, ER status, lymph node status, and tumor size were all statistically significantly associated with relapse-free survival. However, in a multivariable analysis, only gene expression grade, lymph node status, and tumor size remained statistically significant, with gene expression grade having the strongest association (HR = 1.99, 95% CI = 1.43 to 2.78; P <.001). As expected from the results shown in Fig. 2, B and C , if gene expression grade was included in the model, histologic grade would provide little additional information. The opposite was not true, however, because gene expression grade could always separate histologic grade 2 tumors into prognostically distinct groups.
The multivariable analysis also showed that the association between ER status and relapse-free survival was dramatically reduced in the presence of other factors, suggesting that the prognostic power of ER status was indirect and was mediated by other factors. To investigate this possibility further, we examined the joint distribution of ER status and histologic or gene expression grade index ( Fig. 3, A and B ). We found that ER-negative status was generally associated with histologic grade 3 or a high gene expression grade index. However, ER-positive status was associated with a heterogeneous mixture of histologic grades or gene expression grade index values. Thus, although ER status and grade (either histologic or gene expression) were not independent, the two variables were not “correlated” in the sense of providing the same information (i.e., ER-positive status did not imply low histologic or gene-expression grade).
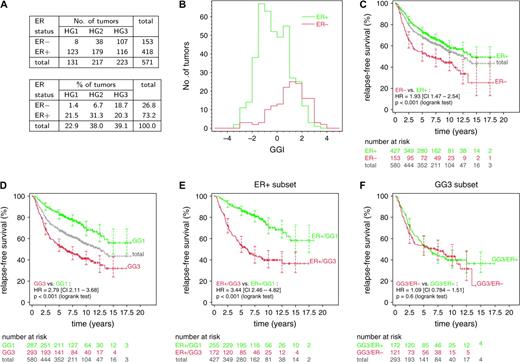
Relationship of estrogen receptor (ER) status, histologic grade (HG), and relapse-free survival. A ) Joint distribution of ER status and HG among the 571 patients with complete data for these variables. Among these patients, ER-negative HG1 tumors were very rare (only 1.6%). B–F ) Relationship of histologic grade, ER status, and relapse-free survival among 580 patients whose ER status were available. Kaplan–Meier analyses were conducted on the pooled datasets. Number of patients at risk and 95% confidence intervals (CIs) for the relapse-free survival estimates (shown as error bars ) are indicated at 2.5-year intervals. Difference in relapse-free survival between two groups is summarized by the hazard ratio (HR) for recurrence with its 95% CI. B ) Histograms of gene expression grade index(GGI) for ER-positive ( green ) and ER-negative ( red ) tumors. C ) Difference in relapse-free survival between ER-positive ( green ) and ER-negative ( red ) tumors. Total = gray . D ) Difference in relapse-free survival between patients with low ( green ) and high ( red ) GGI (GG1 and GG3, respectively). E ) Difference in relapse-free survival between GG1 ( green ) and GG3 ( red ) patients among the subset of ER-positive patients. F) Difference in relapse-free survival between ER-positive ( green ) and ER-negative ( red ) patients among the subset of GG3 patients. All statistical tests were two-sided.
We investigated the implications of the joint distribution of ER status and gene expression grade in survival analysis ( Fig 3, C–F ). Patients with ER-negative tumors had statistically significantly poorer prognosis than patients with ER-positive tumors (HR = 1.93, 95% CI = 1.47 to 2.54; P <.001; Fig. 3, C ). However, the relapse-free survival associated with ER-positive tumors was similar to that associated with all patients in the study (the “total” curve in Fig. 3, C ). In contrast, not only did gene expression grade better separate the low- and high-risk groups (HR = 2.79, 95% CI = 2.11 to 3.68; P <.001; Fig. 3, D ), but also the relapse-free survival associated with a low gene expression grade index was substantially better than that associated with the total population. To confirm that the prognostic value of ER status was indirect and mediated by gene expression grade, we investigated the association between gene expression grade and relapse-free survival in the subset of patients with ER-positive tumors. We found that gene expression grade separated these patients into a high-risk group and a low-risk group (HR = 3.44, 95% CI = 2.46 to 4.82; P <.001; Fig. 3, E ). In contrast, among patients with gene expression grade 3 tumors, ER status was not associated with the risk of recurrence (HR = 1.09, 95% CI = 0.78 to 1.51; Fig. 3, F ). Therefore, when gene expression grade is known, ER status does not provide additional information, but when ER status is known, gene expression grade can still improve prognostic accuracy.
Comparison Between Gene Expression Grade and the Amsterdam 70-Gene Signature for Predicting Metastasis
The NKI2 dataset has previously been used to evaluate the prognostic performance of the Amsterdam 70-gene expression signature ( 16 ) . Among lymph node–negative patients with breast cancer, the expression of genes in this 70-gene signature was found to be strongly associated with distant metastasis ( 15 ) . To compare the prognostic performance of our grade-associated 97 genes with that of the 70-gene signature, we mapped our list of 97 genes to the NKI2 dataset and found that 113 probes from 93 genes were in common. The 70-gene signature uses a correlation score as an estimate of the risk ( 16 ) , whereas the gene expression grade index uses the signed sum of gene expression values. Both are continuous risk indicators that require a cutoff for assigning low- or high-risk status. For the hazard ratios produced by the two systems to be directly comparable, the number of patients in the low- and high-risk categories of the two systems must match. We used the published cutoffs for the 70-gene signature, corresponding to a 10% rate of false-negative results, as previously described ( 15 ) , and chose gene expression grade index cutoffs that produced the same number of patients. The index cutoff values of −0.041 and −0.125 were used, corresponding to correlation cutoff values of 0.55 and 0.4, respectively, for the two subsets of this dataset. As shown by the Kaplan–Meier plots and the hazard ratios ( Fig. 4 ), we found similar separation in distant metastasis–free survival between low- and high-risk groups by use of the 70-gene signature (HR = 4.68, 95% CI = 2.74 to 8.0; Fig. 4, A ) and of the 93-gene gene expression grade index (HR = 3.41, 95% CI = 2.09 to 5.58; Fig. 4, B ).
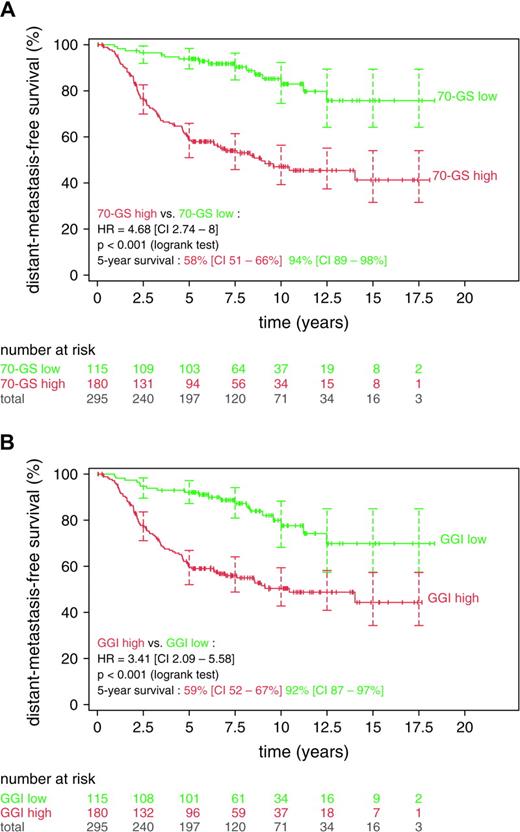
Comparison between the gene expression grade index (GGI) and the 70-gene signature. Kaplan–Meier analyses were conducted with the NKI2 dataset of van de Vijver et al. ( 15 ). Number of patients at risk and 95% confidence intervals (CIs) for the relapse-free survival estimates (shown as error bars ) are indicated at 2.5-year intervals. Difference in relapse-free survival between the two groups is summarized by the hazard ratio (HR) for recurrence with its 95% confidence interval. A ) Low- ( green ) and high- ( red ) risk groups according to the 70-gene signature (70-GS low and 70-GS high, respectively). B ) Low- ( green ) and high- ( red ) risk groups according to the gene expression grade index (GG1 and GG3, respectively). All statistical tests were two-sided.
When we used breast cancer–specific death as the survival endpoint or when the datasets were stratified according to the lymph node status, as in the original study ( 15 ) , we found similar performance between the 70-gene signature and 93-gene grade index. Furthermore, when we constructed a predictor containing 11 probes corresponding to nine genes common to the 70-gene and the 93-gene list (i.e., CCNE2, CENPA, DC13, GMPS, KNTC2, MCM6, MELK, NUSAP1, and PRC1), we found that the prognostic performance of this 11-probe predictor was similar to those from the 70-gene and 93-gene signatures (data not shown), suggesting that grade-related genes may constitute a substantial portion of the prognostic power of the 70-gene signature.
D ISCUSSION
In this study, we found that breast cancers of histologic grades 1 and 3 had distinct gene expression profiles but that histologic grade 2 tumors had heterogeneous gene expression profiles that ranged from those for histologic grade 1 tumors to those for histologic 3 grade tumors. A similar observation has been suggested in at least one previous report ( 24 ) , although that study did not characterize the association of the profiles with disease outcome. We investigated the clinical implications of this finding and discovered that the grade-related gene expression profile, as represented by the gene expression grade index, was more strongly associated with relapse-free survival than was histologic grade.
To rule out the possibility of interobserver variability in histologic grading influenced our results, we analyzed histologic data from various sources that had been graded by different pathologists. As shown in Fig. 2, B , when patients were grouped according to gene expression grade, hazard ratios for relapse-free survival were fairly consistent across the five different datasets analyzed. If histologic grading had differed substantially among these five studies, we would have expected to find substantial variability in the hazard ratios among these studies. Also, we found good separation between survival curves for patients with histologic grade 1 tumors and survival curves for patients with histologic grade 3 tumors in each of the five dataset ( Fig. 2, A ), indicating that the histologic grading was of high quality in these datasets. However, our most important observation was that the three-category histologic grading system could be replaced with a two-category gene expression grading system that may be more clinically relevant, as suggested, in multivariable analysis, by the stronger association between relapse-free survival and gene expression grade than between relapse-free survival and histologic grade. Thus, this grading system has the potential to improve the accuracy of grading for prognostic purposes.
Our study also elucidated the relationship of ER status, gene expression grade, and prognosis. ER status has been widely used to distinguish the two main subtypes of breast cancer. Various microarray studies ( 10 – 14 ) have reported that ER status corresponds to distinct gene expression profiles involving hundreds of genes. Consequently, many other clinicopathologic variables, including histologic grade, would be associated to some extent with ER status. We therefore restricted our training set to ER-positive tumors to identify genes related only to grade, to avoid selecting ER-associated genes that would have been spuriously associated with grade if the training set had included both ER-negative and ER-positive tumors. We further demonstrated that although ER status defined distinct subtypes of breast cancers, grade (particularly as measured by the gene expression grade index) was more directly associated with clinical outcome ( Fig. 3 ).
Because histologic grade is based on mitotic index, nuclear pleomorphism, and differentiation ( 1 ) , it is not surprising that most genes associated with histologic grade have roles in cell cycle progression and proliferation. These genes appears to be an important—if not the most important—component of many existing prognostic gene signatures for breast cancer that are based on gene expression profiles. When we compared the list of 183 genes that we identified by using the less stringent criteria ( P = .05 for a false discovery count of <2), we found the following numbers of shared genes: 11 of the 70 genes and 30 of the 231 genes from van't Veer et al. ( 16 ) , five of the 15 genes from Paik et al. ( 6 ) , and seven of the 76 genes from Wang et al. ( 23 ). Most of these genes are involved in cell cycle regulation and proliferation. In the recurrence score developed by Paik et al. ( 6 ) , the five genes in the proliferation group that are present in our grade–gene list had higher hazard ratios for distant recurrence than those in other gene groups [supplementary figure in Paik et al. ( 6 ) ] in their extensive training and validation sets and the highest weight in their recurrence score formula, indicating the prime importance of the proliferation group.
Our approach was novel compared with those used by other investigators analyzing microarray data [e.g., van't Veer et al. ( 16 ) and Wang et al. ( 23 ) ]. Instead of selecting genes directly through their association with survival, we identified them indirectly through histologic grade, a well-established prognostic factor for breast cancer that is rooted in the cell biology of breast cancer cells. In this study, we demonstrated that histologic grade, which summarizes histologically visible features such as mitosis and differentiation, was strongly associated with changes in the expression of many genes. It might be more difficult to associate gene expression values of primary tumors with clinical outcome, because other variables, such as treatment and other risk factors, also influence the clinical outcome. Our approach, which identified a direct association between gene expression and histologic grade without the complication of uncontrolled variables affecting the outcome, may explain the reproducible behavior of the grade-associated genes that we identified across multiple independent and heterogeneous validation sets and microarray platforms.
The prognostic value of the gene expression grade index does not appear to be specific to a particular set of genes. This observation is not surprising because genes in the list that we identified were highly correlated with one another, and the gene expression grade index effectively behaved as an average of many prognostic factors that are very similar. Although the actual sets of probes that were mapped to various platforms differed in numbers and gene compositions, the results were still highly consistent. Furthermore, we obtained good prognostic discrimination in the various datasets by use of a linear classifier in which the weights of the genes were specified in a very simple way as +1 or −1, depending only on the direction of their association with histologic high- or low-grade tumors, without using more complex methods to estimate the weights. The consistency of our results, despite the simplicity of our approach, may address concerns regarding the variability of gene signatures derived from microarray data and the reproducibility of their prognostic values ( 25 – 27 ) .
In the future, a minimal set of genes should be defined that can accurately divide histologic grade 2 tumors into prognostically distinct groups. Because expression of these genes is highly correlated with one another, arbitrary subsets of our list of grade-associated genes that are chosen only by technical constraints (such as the abundance of the RNA transcripts or the signal strength from specific probes) might be used to develop a practical diagnostic system. Thus, easy-to-implement detection methods, such as those based on immunohistochemistry or quantitative reverse transcription–polymerase chain reaction, could be devised. Furthermore, our approach does not rule out the possibility of combining biomarkers derived by gene expression profiling with other traditional factors that retain independent prognostic power, to maximize the use of available information for patient management. One possibility is to use the gene expression grade as a substitute for or complementary with histologic grading in the well-established Nottingham Prognostic Index ( 3 ) , which also considers tumor size and lymph node status.
In summary, we investigated the gene expression profiles associated with histologic grade and found that relapse-free survival was more strongly associated with gene expression grade than with histologic grade. Although we observed consistent results independently of the microarray platforms and the source of the patients, a prospective randomized clinical trial is still needed to further validate our findings. Our proposed gene expression grading system could also be used for better stratification of patients with breast cancer in clinical trials evaluating new treatments or new therapeutic targets for patients with a high gene expression grade.
C. Sotiriou, P. Wirapati, and S. Loi contributed equally to this report.
Supported by grants from the Belgian National Foundation of Cancer Research, “Fondation Jean-Claude Heuson,” “Fondation Les Amis de L'Institut Jules Bordet,” MEDIC Foundation, Breast Cancer Research Foundation (Evelyne Lauder) (C. Sotiriou), the National Center of Competence in Research Molecular Oncology of the Swiss National Science Foundation (P. Wirapati, P. Farmer, and M. Delorenzi), the Swedish Cancer Society, Stockholm Cancer Society, and the King Gustav Fifth Jubilee Fond.
We thank two anonymous reviewers for critical reading of the manuscript and their highly constructive comments.
Funding to pay the Open Access publication charges for this article was provided by the MEDIC Foundation.
References
Elston CW, Ellis IO. Pathological prognostic factors in breast cancer. I. The value of histological grade in breast cancer: experience from a large study with long-term follow-up.
Elston CW, Ellis IO. Pathological prognostic factors in breast cancer. I. The value of histological grade in breast cancer: experience from a large study with long-term follow-up. C. W. Elston & I. O. Ellis. Histopathology 1991;19;403–410.
Galea MH, Blamey RW, Elston CE, Ellis IO. The Nottingham Prognostic Index in primary breast cancer.
Fitzgibbons PL, Page DL, Weaver D, Thor AD, Allred DC, Clark GM, et al. Prognostic factors in breast cancer. College of American Pathologists Consensus Statement 1999.
Singletary SE, Allred C, Ashley P, Bassett LW, Berry D, Bland KI, et al. Revision of the American Joint Committee on Cancer staging system for breast cancer.
Paik S, Shak S, Tang G, Kim C, Baker J, Cronin M, et al. A multigene assay to predict recurrence of tamoxifen-treated, node-negative breast cancer.
Robbins P, Pinder S, de Klerk N, Dawkins H, Harvey J, Sterrett G, et al. Histological grading of breast carcinomas: a study of interobserver agreement.
Hopton DS, Thorogood J, Clayden AD, MacKinnon D. Observer variation in histological grading of breast cancer.
Theissig F, Kunze KD, Haroske G, Meyer W. Histological grading of breast cancer. Interobserver, reproducibility and prognostic significance.
Gruvberger S, Ringner M, Chen Y, Panavally S, Saal LH, Borg A, et al. Estrogen receptor status in breast cancer is associated with remarkably distinct gene expression patterns.
Perou CM, Sorlie T, Elsen MB, van de Rijn M, Jeffrey SS, Ross CA, et al. Molecular portraits of human breast tumours.
Sorlie T, Perou CM, Tibshirani R, Aas T, Geisler S, Johnsen H, et al. Gene expression patterns of breast carcinomas distinguish tumor subclasses with clinical implications.
Sorlie T, Tibshirani R, Parker J, Hastie T, Marron JS, Nobel A, et al. Repeated observation of breast tumor subtypes in independent gene expression data sets.
Sotiriou C, Neo SY, McShane LM, Korn EL, Long PM, Jazaeri A, et al. Breast cancer classification and prognosis based on gene expression profiles from a population-based study.
van de Vijver MJ, He YD, van't Veer LJ, Dai H, Hart AA, Voskuil DW, et al. A gene-expression signature as a predictor of survival in breast cancer.
van't Veer LJ, Dai H, van de Vijver MJ, He YD, Hart AA, Mao M, et al. Gene expression profiling predicts clinical outcome of breast cancer.
Bolstad BM, Irizarry RA, Astrand M, Speed TP. A comparison of normalization methods for high-density oligonucleotide array data based on bias and variance.
West RB, Nuyten DS, Subramanian S, Nielsen TO, Corless CL, Rubin BP, et al. Determination of stromal signatures in breast carcinoma.
Praz V, Jagannathan V, Bucher P. CleanEx: a database of heterogeneous gene expression data based on a consistent gene nomenclature.
Westfall PH, Young SS. Resampling-based multiple testing: examples and methods for p-value adjustment. New York (NY): Wiley;
Korn EL, Troendle J, McShane LM, Simon R. Controlling the number of false discoveries: application to high dimensional genomic data.
Wang Y, Klijn J, Zhang Y, Sieuwerts A, Look MP, Atkins D, et al. Gene-expression profiles to predict distant metastasis of lymph-node-negative primary breast cancer.
Ma XJ, Salunga R, Tuggle JT, Gaudet J, Enright E, McQuary P, et al. Gene expression profiles of human breast cancer progression.
Ein-Dor L, Kela I, Getz G, Givol D, Domany E. Outcome signature genes in breast cancer: is there a unique set?
Michiels S, Koscielny S, Hill C. Prediction of cancer outcome with microarrays: a multiple random validation strategy.

