


Abstract
Background: Bortezomib is a selective and reversible inhibitor of the 26S proteasome that shows potent antitumor activity in vitro and in vivo against several human cancers of adulthood. No data are available on bortezomib activity against human pediatric neuroblastoma. Methods: Ten neuroblastoma cell lines and suspensions of primary neuroblastoma cells from three patients were tested for sensitivity to bortezomib. Colony formation, cell proliferation, cell cycle progression, and apoptosis were evaluated by a clonogenic assay and by measuring 3 H-thymidine incorporation, bromodeoxyuridine uptake, DNA fragmentation, and phosphatidylserine exposure and propidium iodide staining, respectively. Angiogenesis was assessed by the chick embryo chorioallantoic membrane (CAM) assay. Two mouse xenograft models that mimic the growth and spread of neuroblastoma in humans were used to examine in vivo sensitivity of neuroblastoma to bortezomib. All statistical tests were two-sided. Results: Bortezomib inhibited proliferation and colony formation of neuroblastoma cell lines in a time- and dose-dependent manner. The mean bortezomib concentration that caused 50% inhibition of growth was 6.1 nM (95% confidence interval [CI] = 0.9 to 11.3 nM) at 72 hours. Bortezomib-treated neuroblastoma cells were arrested at G 2 /M and underwent apoptosis (mean percentage of apoptotic cells in four neuroblastoma cell lines treated with 20 nM bortezomib for 24 hours ranged from 20% to 35%, and caspases were activated by two- to fivefold with respect to untreated cells). Similar results were obtained for primary neuroblastoma cells exposed to bortezomib. Bortezomib inhibited angiogenesis in CAMs stimulated by conditioned medium from neuroblastoma cell lines, by neuroblastoma xenografts, and by primary neuroblastoma biopsy specimens (microvessel area: 2.9 × 10 −2 mm 2 , 95% CI = 1.8 × 10 −2 to 3.8 × 10 −2 mm 2 in CAMs treated with biopsy specimens alone and 1.3 × 10 −2 mm 2 , 95% CI = 1 × 10 −2 to 1.5 × 10 −2 mm 2 in CAMs treated with biopsy specimens plus bortezomib, P = .024). In both mouse models, mice treated with bortezomib lived statistically significantly longer than control mice (mean survival time in the pseudometastatic model: 74.2 versus 50.3 days, P <.001; mean survival time in the orthotopic model: 72.3 versus 50.6 days, P <.001). Conclusions: Bortezomib is an effective inhibitor of neuroblastoma cell growth and angiogenesis. These findings provide the rationale for further clinical investigation of bortezomib in pediatric neuroblastoma.
Neuroblastoma is a neoplasm that originates in the neural crest and is the most common extracranial solid tumor in children ( 1 ) . Although the standard treatment for neuroblastoma is based on combination chemotherapy with drugs such as doxorubicin, vincristine, cyclophosphamide, and cisplatin, the disease becomes chemoresistant over time and is eventually fatal ( 1 ) . Patients with metastatic disease who are older than 1 year at diagnosis have poor outcomes, even if they are treated with high-dose chemotherapy followed by autologous hematopoietic stem cell transplantation ( 2 ) . Therefore, novel therapeutic approaches to treat this disease are needed.
The proteasome is one target for such a novel cancer therapy ( 3 , 4 ) . The ubiquitin–proteasome pathway is responsible for the majority of eukaryotic intracellular protein turnover, and its coordinated function is essential to many cellular processes, including cell growth, differentiation, activation, and signaling ( 5 ) . Bortezomib is a low-molecular-weight, water-soluble dipeptidyl boronic acid that binds with high affinity to the proteasome and dissociates slowly, resulting in stable but reversible inhibition of the chymotryptic enzyme activity of the proteasome ( 6 , 7 ) . Bortezomib has shown promise as possible antitumor agent in preclinical studies of adult tumors such as multiple myeloma, lymphoma, ovarian cancer, lung cancer, prostate cancer, pancreatic cancer, melanoma, and glioblastoma ( 8 – 15 ) , and several phase II clinical trials of bortezomib are ongoing ( 16 – 18 ) . However, only a few studies have examined the sensitivity of pediatric tumors to proteasome inhibitors ( 19 , 20 ) . A phase I study of bortezomib was conducted in children with solid tumors ( 21 ) , but the mechanisms underlying bortezomib activity in neuroblastoma have not been previously investigated.
Bortezomib can enhance the expression of key cell cycle and proapoptotic molecules as well as abrogate the expression of activity of prosurvival factors ( 22 , 23 ) . Moreover, results of previous studies ( 10 , 13 , 24 ) have shown that bortezomib inhibits the proteasome via direct induction of tumor cell death and has indirect effects on the tumor vasculature, such as by decreasing vascular endothelial growth factor (VEGF) secretion and VEGF-associated angiogenesis ( 25 ) . More recently, it has been shown that bortezomib mediates antiangiogenesis via both direct and indirect effects on endothelial cells ( 26 ) . Together, these findings suggest mechanisms by which bortezomib may inhibit both the migration of cancer cells and tumor angiogenesis.
Since 1971, when Folkman ( 27 ) proposed the concept of controlling the growth of tumors by preventing their vascularization, the development of drugs that inhibit angiogenesis in tumors including neuroblastoma has become an important goal ( 28 , 29 ) . Over the last 10 years, several in vitro and in vivo studies have addressed the relationship between tumor progression and angiogenesis in neuroblastoma [reviewed in ( 30 ) ]. It has been reported ( 31 ) that a high vascular index is associated with poor prognosis in neuroblastoma patients. This finding suggests that aggressive neuroblastoma tumor growth depends on active angiogenesis.
Bortezomib may be advantageous in the treatment of neuroblastoma for several reasons. First, the mechanisms through which proteasome inhibitors such as bortezomib inhibit tumorigenesis differ from the mechanisms of action of drugs commonly used for neuroblastoma therapy ( 32 , 33 ) , and therefore, protease inhibitors might be more effective. Second, bortezomib is not a substrate for plasma membrane drug efflux pumps, such as multidrug resistance-associated proteins, which are related to multidrug resistance in neuroblastoma therapy ( 33 ) . Third, neuroblastoma cells are highly sensitive to antiangiogenic drugs ( 29 , 30 , 34 ) . In this paper, we examined the effects of bortezomib on human neuroblastoma cells both in vitro and in vivo. We used both lines that express wild-type p53 and lines that express mutant p53 to examine whether induction of apoptosis by bortezomib is mediated by p53.
M ATERIALS AND M ETHODS
Proteasome Inhibitor and Reagents
Bortezomib (PS-341, Velcade) was provided by Millennium Pharmaceuticals, Inc (Cambridge, MA) as a lyophilized white cake in 10-mL glass vials. Each sterile single-use vial contained 3.5 mg bortezomib and 35 mg mannitol. Vials of bortezomib were stored at 25 °C. For in vitro experiments, the contents of each vial were dissolved in 910 μL dimethyl sulfoxide (DMSO) so that the final concentration of bortezomib was 10 mM, and the reconstituted drug was stored at −20 °C; reconstituted bortezomib was thawed and diluted in culture medium (the final DMSO concentration was less than 0.1%) immediately before use. For in vivo experiments, the content of each vial was reconstituted in 3.5 mL of normal (0.9%) saline so that the reconstituted solution contained bortezomib at a concentration of 1 mg/mL. Complete dissolution of the drug in 0.9% saline took approximately 10 seconds. The reconstituted solution was clear and colorless, had a final pH that ranged from 5 to 6, and was used immediately for injection into mice.
The antioxidant N-acetylcysteine (NAC) and the pan-caspase inhibitor (Z-VAD-FMK) were purchased from Sigma (St Louis, MO). The caspase-2 inhibitor (Z-VDVAD-FMK), the caspase-8 inhibitor (Z-IETD-FMK), the caspase-9 inhibitor (Z-LEDH-FMK), the caspase-3 inhibitor (Z-DEVD-FMK), and the caspase-10 inhibitor (Z-AEVD-FMK) were purchased from Alexis (San Diego, CA).
Cell Lines and Culture Conditions
The following human neuroblastoma cell lines were used: GI-ME-N, GI-LI-N, GI-CA-N [all established in our laboratory as previously described ( 35 , 36 ) ], HTLA-230 ( 37 ) , IMR-32 ( 38 ) , LAN-5 ( 39 ) , LAN-1 ( 40 ) , SK-NBE2c ( 41 ) , SH-SY5Y ( 42 ) , and ACN ( 43 ) . All cell lines were used between passages 50 and 75. Human skin fibroblasts from healthy donors were used as controls in some experiments. All cells were grown in complete medium (Dulbecco's modified Eagle medium supplemented with 10% fetal bovine serum [FBS; GIBCO-Invitrogen Srl, Milan, Italy] and 50 IU/mL sodium penicillin G, 50 μg/mL streptomycin sulphate, and 2 mM L -glutamine [all reagents from Sigma]), as previously described ( 44 ) .
Neuroblastoma Patients and Bone Marrow-Infiltrating Neuroblastoma Cell Separation
This study was approved by the institutional review board of G. Gaslini Children's Hospital. We obtained aliquots of bone marrow from three patients with stage 4 disease who underwent bone marrow aspiration (two patients underwent aspiration at relapse and one patient at diagnosis) for diagnostic purposes after receiving informed consent from the patients' legal guardians (according to the Helsinki declaration). The median age of the patients was 4.6 years (range = 2–5.9 years), and all three patients had marked bone marrow infiltration, as assessed by morphologic analysis.
Bone marrow aspirates were subjected to osmotic lysis to deplete them of erythrocytes and then washed and resuspended in phosphate-buffered saline (PBS). We obtained CD45-negative neuroblasts by a negative selection procedure in which bone marrow cell suspensions were first incubated with a mouse anti-human CD45 monoclonal antibody (Caltag, Burlingame, CA), which detects hematopoietic cells, and subsequently with immunomagnetic beads coated with anti-mouse immunoglobulin antibodies, according to the manufacturer's instructions (Miltenyi Biotec, Bergisch Gladbach, Germany), as previously described ( 45 ) .
Preparation of Conditioned Medium from HTLA-230 Cells
We prepared HTLA-230 cell-conditioned medium as previously described ( 46 ) . Briefly, HTLA-230 cells were harvested in trypsin/EDTA solution (Sigma), washed twice in PBS, resuspended in complete medium, and cultured in 25-cm 2 flasks (2 × 10 6 cells per flask) for 2 days. The (conditioned) medium was collected, sequentially centrifuged first at 3 000 g and then at 15 000 g for 10 minutes, filtered through 0.22-μm pore size filters (Costar, Cambridge, MA), and stored at −80 °C.
Cell Proliferation Assay
All neuroblastoma cell lines were plated in 96-well plates (at 1 × 10 3 – 8 × 10 3 cells per well) in complete medium and cultured for 24 hours. The medium was removed and replaced with fresh complete medium that had been supplemented with different concentrations of bortezomib/DMSO (0–200 nM) or 0.1% DMSO (control). Cells (quadruplicate samples for each condition) were then incubated for an additional 24, 48, or 72 hours. Cells were then incubated for 18 hours with 0.5 μCi (0.0185 MBq) 3 H-thymidine (Amersham Bioscience, Little Chalfont, Buckinghamshire, UK). Cells were subsequently harvested onto glass fiber filters (Skatron Instruments, Tranby, Norway) by using a multiple automated sample harvester (Flow Laboratories, Milan, Italy), dried, and the incorporated 3 H-thymidine was analyzed by using a liquid scintillation counter (Tri-Carb 4530; Packard Instruments Company, Downers Grove, IL) as previously described ( 44 ) .
To assess the effect of length of time of drug exposure on cell proliferation, we also performed drug washout experiments according to the method described by Keshelava et al. ( 47 ) . Briefly, the bortezomib-containing medium was removed from the cultures after 1, 2, 4, 8, 12, or 18 hours by washing the cells twice with complete medium. The cells were resuspended in fresh drug-free complete medium and incubated for a total incubation time of 72 hours. Cell proliferation was assessed by measuring DNA synthesis as a function of 3 H-thymidine uptake, as described above, at various time points after the beginning of the treatment.
Clonogenic Cell Survival Assay
Neuroblastoma cells (HTLA-230, SH-SY5Y, GI-LI-N) were suspended at concentrations of 3 × 10 5 cells/mL and treated with bortezomib (0, 10, 40, or 200 nM) in culture medium for 4 hours and then plated (in triplicate) at 300 cells per well into 12-well plates with fresh drug-free medium. Cells were incubated for an additional 14 days, at which time the colonies in each well were counted (×10 magnification) after being washed with PBS, fixed with methanol, and stained with crystal violet.
Analysis of DNA Synthesis by Pulse Labeling with Bromodeoxyuridine
Exponentially growing neuroblastoma cells (SH-SY5Y, HTLA-230, GI-LI-N) (1 × 10 6 − 3 × 10 6 cells) were treated for 24 hours with 20 nM bortezomib, pulse labeled with 10 μM bromodeoxyuridine (BrdU; Sigma) for 30 minutes, harvested by scraping, washed twice with 1% bovine serum albumin (BSA) in PBS, and fixed with 70% ice-cold ethanol for 30 minutes at 4 °C, as previously described ( 46 ) . The cells were incubated for 30 minutes at room temperature in 2N HCl/0.5% Triton X-100 to denature the DNA and to produce single-stranded molecules, then washed with 0.1 M Na 2 B 4 O 7 (pH 8.5) to neutralize the acid, and resuspended in 0.5% Tween 20/1% BSA/PBS. BrdU uptake was detected by staining the cells with 20 μL fluorescein isothiocyanate (FITC)-conjugated mouse monoclonal anti-BrdU antibody (Becton Dickinson, Milan, Italy) at a final concentration of 5 μg/mL for 30 minutes at room temperature. The cells were washed and resuspended in PBS containing 5 μg/mL propidium iodide (PI). Bivariate distributions of BrdU amounts (FITC) versus DNA content (PI) were assessed by flow cytometry using a FACScan device (Beckton Dickinson) equipped with a xenon lamp and a filter set for excitation at 488 nm; FITC and PI fluorescence intensities were recorded through 520- to 530-nm and 575-nm filters, respectively. At least 20 000 cells were analyzed to produce each final densitometric plot. The gates represent the different phases of the cell cycle (R1 = sub-G 1 phase, R2 = G 1 phase, R3 = S phase, R4 = G 2 /M phase).
Analysis of Mitotic Index
Neuroblastoma cells (SH-SY5Y) were plated in 35-mm petri dishes equipped with glass slides (Amnio dish, EuroClone, Milan, Italy) at a concentration of 3 × 10 5 cells per dish. The cells were then treated with 20 nM bortezomib or solvent (control) for 18 hours. For the analysis of mitotic index, total cells (both attached and floating cells) were incubated with colcemid solution (10 μg/mL; Sigma) for 3–4 hours at 37 °C and then treated with 0.075 M KCl for 20 minutes at 37 °C. Mitotic spreads were prepared following Carnoy's fixation: cells were incubated in fixative (methanol:acetic acid, 3:1) for 30 minutes at room temperature, air dried, and stained with 4′,6-diamidino-2-phenylindole (DAPI) and viewed using an Eclipse E-1000 fluorescence microscope (Nikon Corporation, Tokyo, Japan). Mitotic index was defined as the percentage of cells with chromosomes in metaphase.
Cell Viability Assay
SH-SY5Y neuroblastoma cells treated with various concentrations of bortezomib for various times were harvested by scraping, washed with complete medium, and incubated with trypan blue (0.04%; Sigma) for 1 minute at 37 °C. The cells were then placed in a Burker chamber (Tecnovetro, Monza Milan, Italy) and counted by viewing with a contrast phase microscope (Olympus Optical Co LTD, Tokyo, Japan). Trypan blue-positive cells (i.e., dead cells), trypan blue-negative cells (i.e., living cells), and total cells were counted per microscope field at ×100 magnification (four fields were counted for each treatment). The proportion of dead (or living) cells was calculated by dividing the number of dead (or living) cells by the total number of cells per field. In some experiments, cells were treated for 1 hour with 100 μM Z-VAD-FMK (pan-caspase inhibitor, Sigma), 10 μM of Z-IETD-FMK (caspase-8 inhibitor), Z-LEDH-FMK (caspase-9 inhibitor), Z-DEVD-FMK (caspase-3 inhibitor), Z-AEVD-FMK (caspase-10 inhibitor), and Z-VDVAD-FMK (caspase-2 inhibitor) (all from Alexis), before bortezomib administration.
Western Blot Analysis
Protein lysates were prepared as previously described ( 48 ) from SH-SY5Y cells treated for 24 hours with 20 nM bortezomib. The protein lysates (40 μg per lane) were resolved on sodium dodecyl sulfate–13% polyacrylamide gels; prestained molecular weight markers were run in parallel on each gel. The resolved proteins were transferred to nitrocellulose membranes; the membranes were then incubated with mouse monoclonal antibodies against caspases 3, 8, or 9 (Cell Signaling Technology, Danvers, MA) or rabbit polyclonal antibodies against caspases 2 or 10 (MBL, Woburn, MA). Peroxidase-conjugated goat anti-mouse and anti-rabbit antibodies were used as secondary antibodies (Upstate, Lake Placid, NY and Chemicon Int, Temecula, CA, respectively). Immune complexes were visualized with the use of an enhanced chemiluminescence system (Amersham International) according to the manufacturer's instructions. To confirm equal protein loading per lane, the nitrocellulose membranes were stripped and reprobed with a mouse monoclonal antibody against human β-actin (clone C4; Boehringer Mannheim Inc, Mannheim, Germany). Caspase levels were quantified by scanning densitometry of the autoradiography films and normalized to β-actin levels.
Apoptosis Assays
Terminal deoxynucleotidyl transferase-mediated dUTP nick end labeling assay.
Neuroblastoma cells (SH-SY5Y) were plated in 4-well chamber slides (5 × 10 4 cells per well), cultured for 24 hours, and then treated with 20 nM bortezomib. At various times during bortezomib treatment, supernatants were collected and cytocentrifuged onto polylysine-coated glass slides. DNA cleavage in adherent or cytospin preparations of floating cells was assessed using an In Situ Cell Death Detection kit (Roche, Penzberg, Germany), according to the manufacturer's instructions. Briefly, slides containing adherent cells or cytospin preparations were air dried and fixed in 4% paraformaldehyde for 1 hour at room temperature, washed in PBS, and permeabilized with 0.1% Triton X-100 and 0.1% sodium citrate for 2 minutes at 4 °C. The slides were rinsed and incubated with 50 μL of terminal deoxynucleotidyl transferase-mediated dUTP nick end labeling (TUNEL) reaction mixture, which contained terminal deoxynucleotidyl transferase and FITC-labeled dUTP, in a humidified atmosphere for 1 hour at 37 °C in the dark. The slides were rinsed and mounted with coverslips using Vectashield mounting medium with DAPI (Vector Laboratories, Burlingame, CA). Cells were analyzed under an Eclipse E1000 epifluorescence microscope (Nikon Corporation) equipped with appropriate DAPI and FITC filter sets. Images were acquired with a high-sensitivity monochrome charge-coupled device camera.
Propidium iodide staining.
Detection of apoptotic/hypodiploid cells was performed using a modification of the technique described by Nicoletti et al. ( 49 ) . Briefly, aliquots of 5 × 10 5 neuroblastoma cells (GI-LI-N, IMR-32, HTLA-230, and LAN-1) were centrifuged at 290 g for 10 minutes, and the pellets were fixed with ice-cold 70% ethanol overnight at −20 °C. The cells were washed twice with PBS; resuspended in 1 mL of a solution containing 3.4 mM sodium citrate, 20 μg/mL PI (Sigma), and 100 μg/mL RNase A (ICN); and stored in the dark for 30 minutes. Cells were then analyzed on a FACScan flow cytometer (Becton Dickinson).
Caspase activation.
Caspase activation was detected using an ApoFluor Green Caspase Activity kit (Enzyme Systems Products, ICN Biomedicals, Livermore, CA). ApoFluor Green is a carboxyfluorescein-labeled fluoromethyl ketone peptide inhibitor of caspases that binds covalently to activated caspases when internalized by target cells. Bortezomib-treated and untreated neuroblastoma cell lines (SH-SY5Y, GI-LI-N, HTLA-230, IMR-32) and patient-derived primary neuroblastoma cells were collected and washed twice with 1% FBS in PBS. The cells (0.5 × 10 6 – 2 × 10 6 cells/mL) were incubated for 1 hour at 37 °C under 5% CO 2 with the ApoFluor Green solution diluted according to the manufacturer's protocol. The cells were washed twice with washing buffer and analyzed by flow cytometry. The data obtained are expressed as mean ratio fluorescence intensity (MRFI), defined as the ratio of the mean fluorescence intensity of bortezomib-treated cells to that of untreated control cells.
Phosphatidylserine detection.
Phosphatidylserine (PS) exposure was assessed with a human Annexin V–FITC kit (Bender MedSystems, Vienna, Austria). Briefly, cultured patient-derived neuroblastoma cells were treated with bortezomib, collected, washed, and incubated for 10 minutes with 5 μL Annexin V–FITC; washed once with PBS; resuspended in 190 μL prediluted binding buffer plus 10 μL of a 20 μg/mL PI stock solution; and examined by two-color flow cytometry using a FACScan device. FITC and PI fluorescence intensities were recorded through 520- to 530-nm and 575-nm filters, respectively. At least 10 000 events were collected and analyzed using Cell Quest software (Beckton Dickinson). Cells that did not stain for either Annexin V–FITC or PI were considered viable and not to have undergone measurable apoptosis (lower left quadrant), cells that stained for Annexin V–FITC but not for PI were considered to be in the early stages of apoptosis (lower right quadrant), and cells that stained positive for both Annexin V–FITC and PI were either in the late stages of apoptosis (upper right quadrant) or necrotic (upper left quadrant).
Mitochondrial membrane potential assay.
The mitochondrial permeability transition event was detected using a MitoPT kit (Immunochemistry Technologies, LLC, Bloomington, MN), according to the manufacturer's instructions. Briefly, exponentially growing neuroblastoma cells (SH-SY5Y and GI-LI-N) were plated in 6-well flat-bottomed plates (0.5 × 10 6 – 1 × 10 6 cells per well) and treated with 20 nM bortezomib for 12 or 18 hours. In some experiments, the antioxidant NAC, freshly prepared at a concentration of 1 M in PBS, was added to a final concentration of 7.5 mM 2 hours before bortezomib treatment. The cells were then harvested by scraping into ice-cold PBS, pelleted at 290 g for 8 minutes, and resuspended at 0.5 × 10 6 – 2 × 10 6 cells/mL in 1× working-strength MitoPT solution (Immunochemistry Technologies). The cells were incubated for 10–15 minutes at 37 °C in a CO 2 incubator, washed three times with 1× working-strength assay buffer (Immunochemistry Technologies), and resuspended in 1× working-strength assay buffer. The analysis was performed by using either a FACScan (Beckton Dickinson) or 96-well fluorescence plate reader (SPECTRAFluor Plus, TECAN Austria GmbH, Grodig/Salzburg, Austria). The instruments measured the red fluorescence (healthy cells). As the mitochondrial membrane potential collapsed (apoptosis), the amount of red fluorescence decreased.
In Vivo Therapeutic Studies in Mice
All experiments involving animals were reviewed and approved by the licensing and ethical committee of the National Cancer Research Institute, Genoa, Italy, and by the Italian Ministry of Health. All in vivo experiments were performed using 10 mice per group and were repeated twice.
Pseudometastatic tumor model.
Four-week-old female athymic (Nude-nu) mice were purchased from Harlan Laboratories (Harlan Italy, S.Pietro al Natisone, Italy) and housed under specific pathogen-free conditions. Mice were injected intravenously in the tail vein with 2 × 10 6 HTLA-230 tumor cells, as previously described ( 50 ) . Mice were randomly assigned to receive 1 mg bortezomib/kg body weight or saline solution (control mice). Treatment via intravenous injections began 3 days after cell inoculation and continued for a total of 4 weeks (twice a week, with a 3-day interval between injections). Body weight and general physical status of the animals were recorded daily, and mice were killed by cervical dislocation after being anesthetized with xilezine (Xilor 2%, Bio98 Srl, Milan, Italy), when they showed signs of poor health, such as abdominal dilatation, dehydration, or paraplegia.
Orthotopic tumor model.
Five-week-old female SCID mice were purchased from Harlan Laboratories. Mice were anesthetized with ketamine (Imalgene 1000, Merial Italia SpA., Milan, Italy), subjected to laparotomy, and injected with SH-SY5Y cells (1.5 × 10 6 cells in 20 μL of saline solution) in the capsule of the left adrenal gland, as previously described ( 34 ) . No mice died as a result of this treatment. Tumors were allowed to grow from the injected cells for 10 days, at which time bortezomib treatment via intravenous injection was initiated at 1 mg bortezomib/kg body weight (twice per week for 4 weeks with a 3-day interval between injections). At various times after cell inoculation (10, 20, 30, 40, 50 days), mice were selected at random and killed by cervical dislocation after being anesthetized with xilezine, and their tumors were measured with calipers. Tumor volumes were calculated using the formula π/6 [w 1 × (w 2 ) 2 ], where w 1 represents the largest tumor diameter and w 2 represents the smallest tumor diameter. The body weight and general physical status of the remaining mice were recorded daily, and the mice were killed when tumors of the killed mice reached 1000–1200 mm 3 . In some experiments, survival time—defined as the time, in days, from tumor cell inoculation until the euthanasia of mice due to evidence of poor health—was used as the main criterion for determining treatment efficacy.
Chick Embryo Chorioallantoic Membrane Assay
Fertilized white leghorn chicken eggs (Istituto Zooprofilattico di Puglia e Basilicata, Foggia, Italy) were incubated at 37 °C in constant humidity. On day 3 of incubation, a square window was cut in the shell of each egg, and 2–3 mL of albumen was removed to allow detachment of the developing chorioallantoic membrane (CAM). The window was sealed with a glass coverslip, and the eggs were returned to the incubator. On day 8 of incubation, the coverslips were removed and the growing CAMs (10 eggs per group) were treated as described by Ribatti et al. ( 51 ) by: 1) overlaying them with 1-mm 3 sterilized gelatin sponges (Gelfoam Upjohn, Kalamazoo, MI) that had been loaded with 1 μL of PBS (negative control), 1 μL of PBS containing 500 ng of recombinant fibroblast growth factor-2 (FGF-2) (R & D Systems, Abington, UK) (positive control), or 1 μL of HTLA-230 cell-conditioned medium alone or admixed with 20 nM bortezomib; 2) grafting 1- to 2-mm 3 fragments of xenograft tumors derived from HTLA-230 cells injected into nude mice onto the CAM and then treated with PBS or 20 nM bortezomib; or 3) grafting fresh biopsy specimens from patients with neuroblastoma that had been collected under sterile conditions and minced in RPMI 1640 medium to obtain 1- to 2-mm 3 fragments onto the CAM and then treated with PBS or 20 nM bortezomib. The coverslips were replaced after these treatments, and the CAMs were examined daily until day 12 of incubation, when they were photographed in ovo using a stereomicroscope equipped with a camera and image analysis system (Olympus Italia, Opera/Milan, Italy). The angiogenic response was evaluated by counting the number of vessels converging toward the sponges or the grafts. The CAMs were then processed for light microscopy. Briefly, the embryos and their membranes were fixed in ovo with Bouin's fluid (Pathtech Pty Ltd, Preston, AU). The sponges and grafts and the underlying and immediately adjacent portions of the CAMs were removed and embedded in paraffin. Serial sections (8 μm thick) were cut in a plane parallel to the surface of the CAM, stained with a 0.5% aqueous solution of toluidine blue ( Merck, Darmstadt, Germany), and observed under a Leitz-Dialux 20 light photomicroscope (Leitz, Wetzlar, Germany). The angiogenic response was assessed by using a planimetric method of point counting ( 52 ) . Microvessel area was expressed as the percentage of the total number of intersection points occupied by vessels cut transversely (i.e., vessels that were 3–10 μm in diameter). Mean values for microvessel area, with 95% confidence intervals, were determined for each analysis.
Histologic Analysis of Mouse Orthotopic Tumors
Histologic evaluation of primary tumors was performed after the third week of treatment. Briefly, orthotopic tumor-bearing mice (two mice per group) were anesthetized with xilezine and killed by cervical dislocation, and tumor samples were fixed in 4% paraformaldehyde for 5 hours at room temperature, washed twice in PBS, dehydrated in 30% sucrose for 12 hours at 4 °C, embedded in O.C.T. (Miles Chemical Co, Elkhart, IN), snap frozen, and stored at −80 °C. Sections (5 μm thick) of cryopreserved tissue were stained with monoclonal antibodies that recognize endothelial cells, i.e., anti-CD31 (goat anti-mouse, clone SC-1506, Santa Cruz Biotechnology, Santa Cruz, CA) and anti-CD34 (rat anti-mouse, clone MEC 14.7, Dako, Glostrup, Denmark); smooth muscle actin (mouse anti-human SMA, clone 1A4, Dako); a 57-kDa human neuroblastoma-specific antigen (mouse anti-human NB, clone NB84a, Dako); the proliferation antigen, Ki-67 (mouse anti-human Ki-67, clone Ki-55, Dako); and for TUNEL analysis using the In situ Cell Death Detection kit (Roche). Briefly, sections were collected on 3-amino-propyl-triethoxysilane-coated slides, fixed in 4% paraformaldehyde for 20 minutes at room temperature, washed three time in PBS, permeabilized in 0.1% Triton/PBS for 2 minutes at 4 °C, and washed twice in PBS. TUNEL analysis was performed according to manufacturer's instructions. The sections were then washed twice in PBS and saturated with 2% BSA in PBS before incubation with primary antibodies against CD31 (1:100 dilution), CD34 (1:30 dilution), SMA (1:50 dilution), NB84a (1:25 dilution), or Ki-67 (1:50 dilution) for 30 minutes at room temperature. Binding of the primary antibodies was detected with horseradish peroxidase-conjugated horse anti-goat immunoglobulin G (1:150 dilution; Vector Laboratories) for immunohistochemical analysis and red phycoerythrin-conjugated rabbit anti-mouse (1:50 dilution; Dako) or goat anti-rat (1:50 dilution; Southern Biotech, Birmingham, AL) immunoglobulin, for 30 minutes at room temperature, for immunofluorescence analysis. Sections were analyzed for CD31 positivity, by staining with diaminobenzidine substrate and, simultaneously, for apoptosis and for staining with the primary antibodies with a Nikon E-1000 fluorescence microscope equipped with specific filters for FITC, tetramethyl rhodamine iso-thyocinate, and DAPI.
Microvessel Area
Microvessel area in tumor sections that were stained with the CD31 antibody was assessed independently by two investigators (BN and DR) with the use of a Quantimet 5000 computerized image analysis system (Leica, Wetzlar, Germany). They each examined four to six randomly chosen fields (at ×250 magnification), which almost entirely covered each of three sections (every third section within nine serial sections) per sample, with the use of a 484-intersection-point square reticulum (12.5 × 10 2 /mm 2 , reference area) inserted in the eyepiece of the microscope, with each point covering an area of 72.15 μm 2 . Care was taken to select microvessels, i.e., capillaries and small venules, from among all CD31 antibody-stained vessels. Microvessels were identified as transversely sectioned tubes with a single layer of CD31-positive endothelial cells, with or without a lumen (diameter range = 3–10 μm). The area occupied by microvessels was estimated by using a planimetric point-count method ( 52 ) with slight modifications, according to which the microvessel area equaled the sum of points that hit microvessels. The microvessel area was calculated as the total number of mesh intersection points occupied by transversely sectioned microvessels. Because the size of transversely sectioned microvessels, as well as the distance between two adjacent intersection points, was small, one given intersection point could be occupied by only one transversely sectioned microvessel. These microvessels were included in the count. In contrast, microvessels transversally sectioned that did not cross intersection points were excluded from the counts. Microvessels longitudinally or tangentially sectioned, despite their position with regard to the intersection points, were also excluded from the count. We could thus be certain that a given microvessel was counted only once, even if several of its section planes were present.
Statistical Analysis
Results are expressed as mean values with 95% confidence intervals. All in vitro data are from at least three independent experiments. The statistical significance of differences between experimental and control groups was determined by Student's t test with Welch's correction or by analysis of variance with Tukey's multiple comparison test using GraphPad Prism 3.0 software (GraphPad Software, Inc, El Camino Real, San Diego, CA). Survival curves were constructed by using the Kaplan–Meier method. All in vivo experiments were performed twice. Survival in different treatment groups was compared by using Peto's log-rank test in StatsDirect 0.1 statistical software (CamCode, Ashwell, UK). All statistical tests were two-sided, and P values less than .05 were considered statistically significant.
R ESULTS
Effect of Bortezomib on the Proliferation, Clonal Growth, and Viability of Neuroblastoma Cell Lines
We first investigated the effect of bortezomib on the growth of 10 neuroblastoma cell lines in vitro by measuring 3 H-thymidine uptake. Treatment of any of the 10 cell lines with bortezomib induced a time- and dose-dependent statistically significant decrease in cell proliferation compared with proliferation of the respective untreated cell line (mean bortezomib concentration that caused 50% inhibition of growth [IC 50 ] after 24 hours of treatment: 9.6 nM, 95% confidence interval [CI] = 3.39 to 15.81 nM; after 48 hours: 7.3 nM, 95% CI = 1.1 to 13.5 nM; after 72 hours: 6.1 nM, 95% CI = 0.9 to 11.3 nM; Fig. 1, A–C , respectively). We also examined the dose–response relationship of bortezomib in SH-SY5Y cells (one of the most bortezomib-sensitive neuroblastoma cell lines) and in HTLA-230 cells (one of the most bortezomib-resistant neuroblastoma cell lines) exposed to the drug for short times (washout assay) in an effort to simulate the activity of bortezomib in vivo ( Fig. 1, D and E ). Both of these cell lines displayed lower levels of 3 H-thymidine incorporation after exposure to bortezomib, at all doses examined, for 4 or more hours than after 1 hour of exposure (i.e., bortezomib-treated SH-SY5Y cells, IC 50 at 4 hours = 60 nM versus IC 50 at 1 hour =155 nM; bortezomib-treated HTLA-230 cells, IC 50 at 8 hours = 70 nM versus IC 50 at 1 hour > 200 nM). By contrast, consistent with previous reports ( 12 , 14 , 53 ), bortezomib did not induce marked growth inhibition in normal diploid human fibroblasts after longer exposure or at higher doses ( Fig. 1, F ). These results clearly demonstrate that bortezomib specifically induced a dose-dependent death of tumor cells without affecting nontransformed cells.
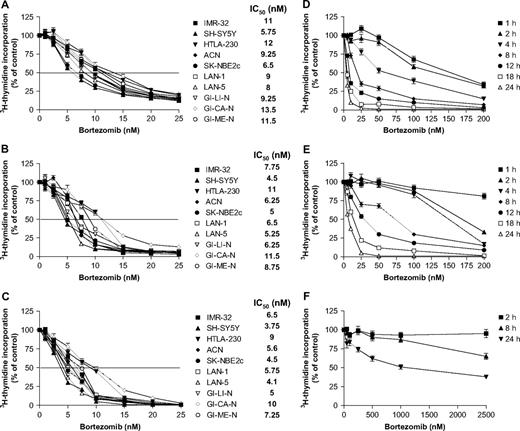
Effect of bortezomib on the growth of human neuroblastoma cell lines. Ten neuroblastoma cell lines were cultured in the presence of various concentrations (1–25 nM) of bortezomib for A ) 24, B ) 48, or C ) 72 hours. Cell proliferation was measured by 3 H-thymidine incorporation in quadruplicate wells. Results of data derived from three different experiments are expressed as mean percentage of 3 H-thymidine incorporation from quadruplicate wells as compared to that of control untreated cells (treated with culture medium containing dimethyl sulfoxide); error bars represent 95% confidence intervals. The horizontal line indicates the concentration of bortezomib that caused 50% inhibition of growth (IC 50 ) for each cell line. Drug washout assay, to assess the impact of length of bortezomib exposure on cell proliferation in D ) SH-SY5Y cells, E ) HTLA-230 cells, and F ) human fibroblasts. Cells were incubated with bortezomib for the indicated times with the indicated doses and then washed with drug-free medium. Cell proliferation was assessed by 3 H-thymidine incorporation 72 hours after initiation of treatment. Results are expressed as described above.
We further assessed the effects of bortezomib treatment on cell survival by using a clonogenic assay, which measures the long-term effects of drugs on permanent cell growth arrest and cell death more accurately than does 3 H-thymidine incorporation ( 54 ) . To examine the effect of short-term bortezomib exposure on clonogenic potential, we treated HTLA-230, SH-SY5Y, and GI-LI-N neuroblastoma cells in suspension with various concentrations of bortezomib for 4 hours, then plated the cells in fresh medium lacking bortezomib, and cultured them for an additional 14 days before counting colony numbers ( Fig. 2, A ). This brief exposure to bortezomib resulted in statistically significant dose-dependent reductions in neuroblastoma colony formation compared with that of control cells that had not been exposed to bortezomib (i.e., mean number of colonies for GI-LI-N cells treated with 40 nM bortezomib versus untreated GI-LI-N control cells: 21 versus 73, difference = 52, 95% CI = 43.3 to 60.7, P = .0033; mean number of colonies for SH-SY5Y cells treated with 40 nM bortezomib versus SH-SY5Y untreated control cells: 45 versus 70, difference = 25, 95% CI = 20 to 30, P = .0051; mean number of colonies for HTLA-230 cells treated with 40 nM bortezomib versus HTLA-230 untreated control cells: 40 versus 63, difference = 23, 95% CI = 20.5 to 25.5, P = .0041).
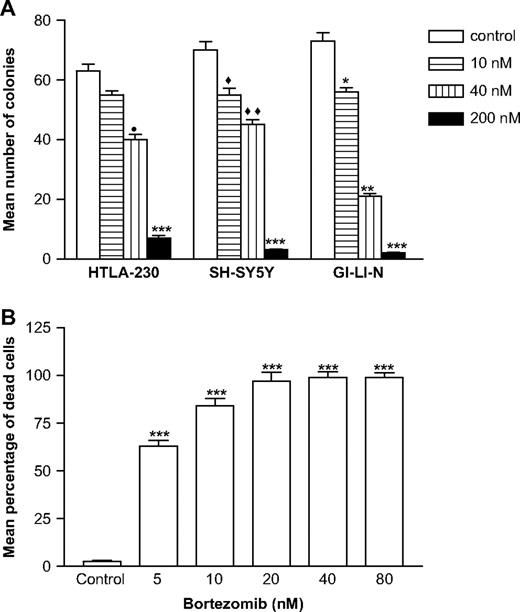
Effect of bortezomib on the clonogenic growth of neuroblastoma cell lines. A ) Concentration-dependent effects of pretreatment with bortezomib on clonogenic growth. Neuroblastoma cell lines were treated for 4 hours with bortezomib at 10, 40, or 200 nM or 0.1% dimethyl sulfoxide (control) and then replated in drug-free medium and incubated for 14 days; colonies were detected by staining with crystal violet. Bars represent the mean number of colonies of triplicate wells from two independent experiments; error bars represent 95% confidence intervals. * P = .0342, ** P = .0033, *** P <.001, ♦ P = .027, ♦♦ P = .0051, • P = .0041; all by Student's t test with Welch's correction. B ) Concentration-dependent effects of bortezomib on cell viability. SH-SY5Y cells were incubated with a range of bortezomib concentrations (5–80 nM) for 72 hours, and cell viability was determined by trypan blue exclusion method. Results are expressed as the mean percentage of dead (i.e., trypan blue positive) cells in triplicate cultures from two independent experiments; error bars represent 95% confidence intervals. ***Statistically significantly different from control ( P <.001) by analysis of variance with Tukey's multiple comparison test.
We next examined the effect of bortezomib on the cell viability of cultured neuroblastoma cells by trypan blue staining. Five neuroblastoma cell lines (LAN-1, SK-NBE2c, SH-SY5Y, IMR-32, and GI-LI-N) were incubated with various concentrations of bortezomib for 72 hours, and their viability was assessed. The results showed a dose-dependent cytotoxic activity with nearly 100% SH-SY5Y trypan blue-positive (dead) cells at a dose of 20 nM bortezomib ( Fig. 2, B ). Similar results were obtained with the other four neuroblastoma cell lines (data not shown).
Effect of Bortezomib on Neuroblastoma Cell Cycle Progression
To investigate the mechanism of action of bortezomib in neuroblastoma cells, we used flow cytometry to study the cell cycle kinetics in SH-SY5Y, HTLA-230, and GI-LI-N cells that had been treated with 20 nM bortezomib for various times and then pulse labeled with bromodeoxyuridine to examine DNA synthesis. In cells treated for 18–24 hours with 20 nM bortezomib, we observed a time-dependent increase of the proportion of SH-SY5Y cells in G 2 /M phases that was accompanied by a nearly complete depletion of cells in S phase ( Fig. 3, A–F ). Cytologic analysis of SH-SY5Y cells that had accumulated at G 2 /M phase revealed that cells cultured for 18 hours with bortezomib had a mitotic index that was nearly identical to that of control cells cultured in the absence of bortezomib (8.1% [75 mitotic cells out of 930 cells examined] versus 8% [65 mitotic cells out of 810 cells examined]), indicating that most of these cells were blocked in G 2 rather than in mitosis. The percentage of SH-SY5Y cells in the sub-G 1 fraction, which contains apoptotic cells, increased at longer times of bortezomib exposure. Similar but less pronounced effects were observed in HTLA-230 ( Fig. 3, G and H ) and GI-LI-N ( Fig. 3, I and J ) cells.
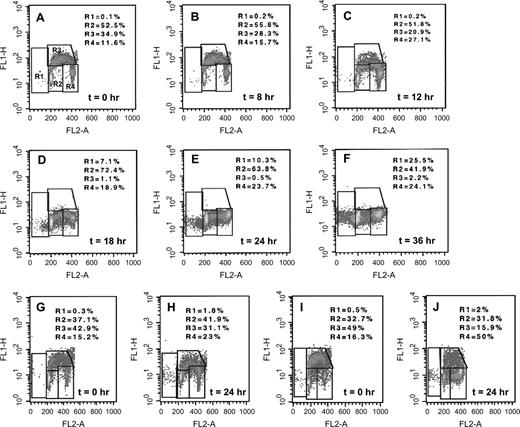
Effect of bortezomib on cell cycle progression in neuroblastoma cell lines. A – F ) SH-SY5Y, G and H ) HTLA-230, and I and J ) GI-LI-N neuroblastoma cells were exposed to 20 nM bortezomib for the indicated times, and then the cells were analyzed for DNA synthesis by pulse labeling with bromodeoxyuridine. BrdU uptake (fluorescein isothiocyanate, y -axis ) versus total cellular DNA content (propidium iodide, x -axis ) was evaluated by densitometric fluorescence-activated cell sorter analysis (R1 = sub-G 1 -phase cells; R2 = G 1 -phase cells; R3 = S-phase cells; R4 = G 2 /M-phase cells).
Effect of Bortezomib on Apoptosis in Neuroblastoma Cell Lines
To determine whether the observed bortezomib-induced reduction in viability of neuroblastoma cell lines occurred via induction of apoptosis, we used TUNEL and PI staining to measure DNA fragmentation in treated cells. SH-SY5Y cells were treated with 20 nM bortezomib for different times and double stained by TUNEL and DAPI (to detect nuclei), and the percentage of TUNEL-positive (i.e., dead) cells per microscopic field was calculated ( Fig. 4, A ). A small proportion (18%) of dead cells were detected after the first 18 hours of incubation with bortezomib. However, after 36 hours of bortezomib exposure, 62% of the cell population was TUNEL positive (i.e., dead). In the four cell lines shown in Fig. 4, B , fluorescence-activated cell sorter analysis of PI-stained cells showed a statistically significant higher percentage of apoptotic cells following 24 hours of treatment with 20 nM bortezomib compared with control cells incubated in solvent (i.e., culture medium containing DMSO) (e.g., mean percentage of apoptotic cells for bortezomib-treated versus control GI-LI-N cells: 29 versus 5, difference = 24, 95% CI = 19.3 to 28.7, P <.001) ( Fig. 4, B ).
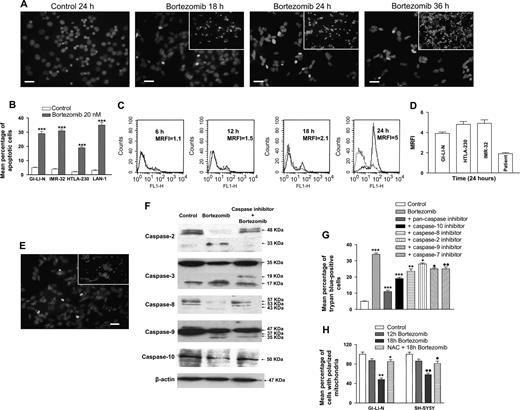
Effect of bortezomib on induction of apoptosis in neuroblastoma cells. A ) SH-SY5Y cells were treated with 20 nM bortezomib or culture medium containing dimethyl sulfoxide (control) for the indicated times, and attached and detached ( insets ) apoptotic cells were stained by terminal deoxynucleotidyl transferase-mediated dUTP nick end labeling. Cell nuclei were stained with 4′,6-diamidino-2-phenylindole. Scale bars , 50 μm. B ) Effect of bortezomib on DNA fragmentation. Neuroblastoma cell lines were incubated with 20 nM bortezomib or solvent (control) for 24 hours. Apoptotic cells with DNA fragmentation were detected by propidium iodide staining and fluorescence-activated cell sorter analysis. Results are expressed as the mean percentage of apoptotic cells with DNA fragmentation from three independent experiments; error bars represent 95% confidence intervals. ***Statistically significantly different from control ( P <.001) by analysis of variance with Tukey's multiple comparison test. C – G ) Effect of bortezomib on caspase activation. SH-SY5Y ( C ) and GI-LI-N, HTLA-230, IMR-32, and primary neuroblastoma cells (from a patient; D ) were treated with 20 nM bortezomib for the indicated times, and caspase activation was measured by flow cytometry, as described in the Materials and Methods. Results are expressed as the mean ratio fluorescence intensity with respect to control (untreated) cells. C ) Dotted lines , untreated cells; solid lines , bortezomib-treated cells. Data in ( D ) represent the mean of three different experiments. E ) SH-SY5Y cells were treated with bortezomib (20 nM) in the presence of the pan-caspase inhibitor Z-VAD-FMK for 24 hours and then analyzed for apoptosis as in panel A. F and G ) SH-SY5Y cells were treated with bortezomib (20 nM) in the presence or absence of caspase-specific inhibitors for 24 hours and then analyzed for caspase cleavage by immunoblot analysis with specific antibodies for the different caspases ( F ) or for viability using trypan blue staining ( G ). Results in G are expressed as mean values from three independent experiments; error bars represent 95% confidence intervals. P values for bortezomib versus control and for inhibitors versus bortezomib were calculated using analysis of variance with a Tukey posttest; *** P <.001, ** P = .0099, * P = .0124, • P = .0110, •• P = .0117. H ) Effect of bortezomib on mitochondrial membrane permeability. SH-SY5Y and GI-LI-N cells were treated with bortezomib (20 nM) for the indicated times in the presence or absence of 7.5 mM N-acetylcysteine (NAC), harvested, and analyzed for changes in mitochondrial membrane potential. Results are expressed as the mean percentages of cells with polarized mitochondria from four independent experiments; error bars represent 95% confidence intervals. P values for bortezomib-treated cells versus untreated control cells and for NAC + bortezomib-treated cells versus bortezomib-treated cells were calculated using analysis of variance with a Tukey posttest; ** P = .0029, * P = .0061, •• P = .0048, • P = .0314.
Induction of apoptosis may also involve activation of aspartate-specific cysteine proteases or caspases ( 55 ) . SH-SY5Y cells treated with 20 nM bortezomib for various times were probed with a fluorogenic pan-caspase substrate to measure caspase activity. As shown in Fig. 4, C , caspase activation, as measured by flow cytometry, increased in a time-dependent manner. Specifically, it increased from an undetectable level after 6 hours of treatment with 20 nM bortezomib (MRFI with respect to untreated cells = 1.1) to a measurable level after 12 hours of treatment (MRFI = 1.5), to MFRIs of 2.1 and 5 after 18 and 24 hours of exposure to bortezomib treatment, respectively. Similar increases in caspase activation were obtained with HTLA-230, IMR-32, and GI-LI-N cell lines exposed for 24 hours to bortezomib ( Fig. 4, D ).
We next investigated whether caspase activation was required for bortezomib-induced apoptosis. Neuroblastoma cells (SH-SY5Y) were pretreated for 1 hour with the pan-caspase inhibitor Z-VAD-FMK or with specific inhibitors of caspase-2, caspase-8, caspase-10, caspase-9, or caspase-3. These cells were then treated for 24 hours with 20 nM bortezomib. SH-SY5Y cells pretreated with the pan-caspase inhibitor before bortezomib treatments had fewer TUNEL-positive (i.e., apoptotic) cells than SH-SY5Y treated with bortezomib alone (7% versus 34%, difference = 27%, 95% CI = 24.5% to 29.5%, P = .0023) ( Fig. 4, E ). Selective inhibition of caspases 2 and 8 clearly blocked bortezomib-induced cleavage of the respective caspases, whereas inhibition of caspases 3, 9, and 10 only partially prevented caspase cleavage ( Fig. 4, F ). All of the caspase inhibitors induced a partial recovery from cell death induced by treating neuroblastoma cells with bortezomib (e.g., percentages of trypan blue-positive cells [i.e., dead] in cells pretreated with bortezomib + the pan-caspase inhibitor versus with bortezomib alone: 11% versus 34%, difference = 23%, 95% CI = 21.8% to 24.2%, P <.001) ( Fig. 4, G ). We also tested the effect of Z-VAD-FMK on cell proliferation because caspases have been implicated in the regulation of proliferation ( 56 ) . However, addition of the inhibitor had no effect on bortezomib-mediated inhibition of cell proliferation (data not shown).
We next investigated whether bortezomib triggered an intrinsic apoptotic signaling pathway. Stress-induced apoptosis is associated with mitochondria-related events, i.e., the loss of membrane potential and the generation of reactive oxygen species ( 57 ) . Treatment of SH-SY5Y and GI-LI-N cells with 20 nM bortezomib resulted in a time-dependent decrease in mitochondrial membrane potential ( Fig. 4, H ). However, addition of the antioxidant NAC, an inhibitor of reactive oxygen species generation, to the cells 2 hours before adding bortezomib statistically significantly increased the percentage of cells with polarized mitochondria (mean percentage of GI-LI-N cells with polarized mitochondria after 18 hours of bortezomib treatment without and with NAC: 48% versus 85%, difference = 37%, 95% CI = 34.5% to 39.5%, P = .006; mean percentage of SH-SY5Y cells with polarized mitochondria after 18 hours of bortezomib treatment without and with NAC: 58% versus 81%, difference = 23%, 95% CI = 16.8% to 29.2%, P = .031 ( Fig. 4, H ).
Because it has been proposed that p53 ( 9 , 58 ) and caspase-8 ( 23 , 59 ) are involved in the activity of bortezomib, we addressed their relevance in the neuroblastoma model. Of the 10 neuroblastoma cell lines examined in this study, four (SH-SY5Y, HTLA-230, GI-LI-N, IMR-32) do not express caspase-8 ( 60 ) and two (LAN-1 and SK-NBE2c) express mutant p53 ( 61 , 62 ) . We found that the sensitivity of all 10 neuroblastoma cell lines to bortezomib was not associated with their caspase-8 expression or p53 mutation status ( Fig. 1 ). In addition, bortezomib exposure resulted in the time-dependent induction of p53 expression in SH-SY5Y and IMR-32 cells but not in LAN-1 and SK-NBE2c (Supplementary Fig. 1; available at: http://jncicancerspectrum.oxfordjournals.org/jnci/content/vol98/issue16 ). Moreover, bortezomib-induced caspase cleavage was rescued by the selective caspase-8 inhibitor ( Fig. 4, F ), while bortezomib-induced cell death recovered by only 30.9% (95% CI = 18.5% to 43.2%, P = .0099) ( Fig. 4, G ). Therefore, we conclude that bortezomib-induced inhibition of cell proliferation and induction of neuroblastoma cell death are unrelated to caspase-8 expression and p53 mutation status.
Effect of Bortezomib on the Viability of Primary Neuroblastoma Cells
In subsequent experiments, we examined the effect of bortezomib on primary neuroblastoma cells that were isolated from the bone marrow of three patients with metastatic disease. These cell fractions were treated with bortezomib (20–40 nM) for 24 or 48 hours and then tested for cell viability and apoptosis. All three samples displayed statistically significant dose- and time-dependent decreases in cell viability, as assessed by trypan blue staining, compared with control cells (mean percentage of trypan blue-positive cells, 20 nM bortezomib-treated cells at 24 hours versus untreated control cells: 32% versus 5.5%, difference = 26.5%, 95% CI = 17.8% to 35.1%, P = .0195; 20 nM bortezomib-treated cells at 48 hours versus untreated control cells: 67% versus 9.5%, difference = 57.5%, 95% CI = 47.6% to 67.4%, P <.001) ( Fig. 5, A ). Bortezomib-induced cell death of primary neuroblastoma cells was due to apoptosis, as shown by the marked time-dependent increase in the percentage of Annexin V–positive cells ( Fig. 5, B ) and by caspase activation ( Fig. 4, D ).
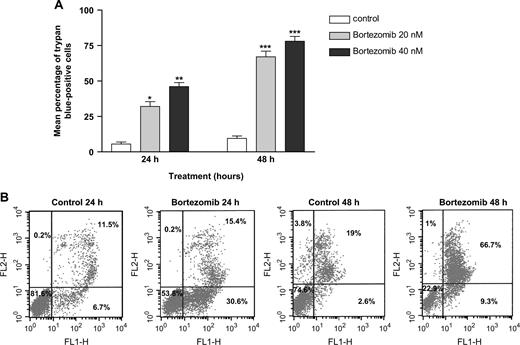
Effect of bortezomib on primary neuroblastoma cells. A ) Primary neuroblastoma cells isolated from the bone marrow of three patients with metastatic disease were incubated with 20 or 40 nM bortezomib or solvent (control) for 24 or 48 hours, and cell death was determined by trypan blue staining. Results are expressed as mean number of trypan blue–positive (i.e., dead) cells in triplicate cultures from two independent experiments. P values for bortezomib-treated cells versus untreated control cells were calculated using analysis of variance with a Tukey posttest; ** P = .0063, * P = .0195. B ) Effect of bortezomib on phosphatidylserine (PS) exposure in primary neuroblastoma cells. Primary neuroblastoma cells from one patient were incubated in the presence or absence (control) of 20 nM bortezomib for 24 or 48 hours. Cells were double stained with Annexin V–fluorescein isothiocyanate (FITC) to detect PS exposure and propidium iodide (PI) to detect DNA and analyzed by flow cytometry. FITC and PI fluorescence intensities were recorded through 520- to 530-nm (FL1-H; x -axis ) and 575-nm (FL2-H; y -axis ) filters, respectively. The lower left quadrant shows viable cells; the lower right quadrant shows viable cells in early stages of apoptosis; the upper right quadrant shows cells in later stage of apoptosis; and the upper left quadrant shows dead cells.
Effect of Bortezomib on Neuroblastoma-Induced Angiogenic Responses in the CAM Assay
We next used the CAM assay to examine whether bortezomib had any effect on angiogenesis in vivo. CAMs treated with FGF-2-loaded gelatin sponges (positive control) or with sponges loaded with HTLA-230 cell-conditioned medium showed numerous allantoic vessels radiating in a “spoked wheel” pattern toward the sponges (Fig. 6, A and B, respectively). Microscopic examination of the CAMs revealed highly vascularized tissue among the trabeculae of the sponges ( Fig. 6, C and D ). Addition of bortezomib (20 nM) to the conditioned medium drastically reduced the number of macroscopic radiating vessels ( Fig. 6, E ) and completely eliminated microscopic vessels from among the sponge trabeculae ( Fig. 6, F ). These observations were confirmed by a morphometric assessment of microvessel area (CAMs treated with FGF-2: 3.40 × 10 −2 mm 2 [95% CI = 2 × 10 −2 to 4.8 × 10 −2 mm 2 ]; CAMs treated with conditioned medium alone: 3 × 10 −2 mm 2 [95% CI = 2 × 10 −2 to 4 × 10 −2 mm 2 ]; embryos treated with conditioned medium plus 20 nM bortezomib: 1.15 × 10 −2 mm 2 [95% CI = 0.7 × 10 −2 to 1.6 × 10 −2 mm 2 ]; P = .0186 for CAMs treated with conditioned medium plus 20 nM bortezomib versus conditioned medium alone).
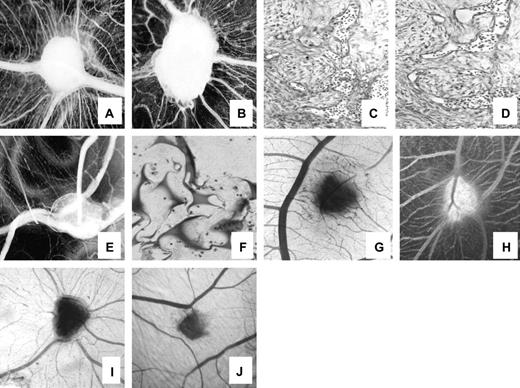
Effect of bortezomib on angiogenesis in chick chorioallantoic membranes (CAMs). Macroscopic ( A, B ) and microscopic ( C, D ) images of the angiogenic response induced by gelatin sponges soaked with recombinant fibroblast growth factor-2 ( A, C ) or with HTLA-230 cell-conditioned medium ( B, D ). Macroscopically, numerous allantoic vessels converged radially in a “spoked wheel” pattern toward the implant ( A, B ), whereas microscopically, numerous small blood vessels were detectable among the sponge trabeculae ( C, D ). Following treatment of the CAM with 20 nM bortezomib, fewer vessels surrounded the sponges and were recognizable among the trabeculae of the specimens treated with the conditioned medium of HTLA-230 cells ( E, F ). Similar features were observed when CAMs were treated with neuroblastoma biopsy specimens ( G ) or with tumor xenografts derived from mice injected intravenously with HTLA-230 cells ( H ). Following treatment with 20 nM bortezomib, fewer blood vessels invaded the biopsy specimen ( I ) or the xenograft ( J ). Original magnifications: panels A, B, E, G, H, I, and J: ×50; panels C, D, and F: ×250.
Similar results were obtained when the CAMs were treated with human neuroblastoma biopsy specimens or with tumor xenografts derived from mice injected intravenously with HTLA-230 neuroblastoma cells. In macroscopic observations 96 hours after either type of tumor specimen was grafted onto the CAMs, we observed statistically significantly fewer allantoic vessels that converge toward the implants in CAMs that were treated with bortezomib ( Fig. 6, I and J ) than in CAMs that were not treated with bortezomib ( Fig. 6, G and H ). These observations were confirmed by morphometric assessment of microvessel area (CAMs treated with biopsy specimens without versus with bortezomib: 2.9 × 10 −2 mm 2 versus 1.3 × 10 −2 mm 2 , difference = 1.6 × 10 −2 mm 2 , 95% CI = 0.8 × 10 −2 to 2.3 × 10 −2 mm 2 , P = .024; CAMs treated with tumor xenografts without versus with bortezomib: 2.7 × 10 −2 mm 2 versus 1.1 × 10 −2 mm 2 , difference = 1.6 × 10 −2 mm 2 , 95% CI = 1.2 × 10 −2 to 2 × 10 −2 mm 2 , P = .0196).
In Vivo Antitumor Activity of Bortezomib against Human Neuroblastoma Xenografts
We used two previously described animal models of neuroblastoma, an orthotopic tumor model ( 34 ) and a pseudometastatic experimental xenograft model, to evaluate the effect of bortezomib on neuroblastoma cell survival in vivo ( 50 ) . Both models are biologically and clinically relevant and address different stages of the disease, i.e., the pseudometatstic model mimics minimal residual disease and the orthotopic model mimics a primary mass with metastases.
In previous studies in several different human xenograft models ( 10 , 11 , 15 , 24 ) , bortezomib at the maximally tolerated dose of 1 mg/kg produced substantial inhibition of tumor growth. In both neuroblastoma xenograft models, we delivered bortezomib by intravenous injection every 72 hours because it has been shown that it takes this long for 26S proteasome activity to recover to control levels after being inhibited ( 6 ) . In the pseudometastatic model, we observed no decrease in body weight in bortezomib-treated mice or in the untreated control mice throughout the experiments (Fig. 7, A inset). In the pseudometastatic HTLA-230 mouse model, mice injected with bortezomib lived statistically significantly longer than mice injected with saline (mean survival time: 74.2 days versus 50.3 days, difference = 23.9 days, 95% CI = 20.8 to 26.6 days, P <.001) ( Fig. 7, A ).
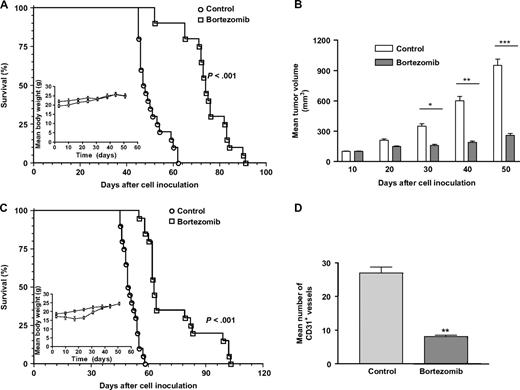
In vivo antitumor activity of bortezomib. A ) In the pseudometastatic model, nude mice were injected intravenously with HTLA-230 cells and randomly assigned to two groups (n = 20 per group). After 3 days, mice received 1 mg/kg bortezomib or saline solution (control) by intravenous injection every 3 days for 4 weeks. Survival of mice was monitored daily. P <.001 for mean survival of bortezomib-treated mice compared to saline-treated control mice (Peto's log-rank test). Inset , absolute mean body weight, in grams, after the beginning of the treatment. B – D ) An orthotopic mouse model was established by transplanting SH-SY5Y neuroblastoma cells into the left adrenal gland of SCID mice (n = 20 per group). After 10 days, the mice were randomly assigned to two groups. Bortezomib was administered as described above. B ) Tumor volumes measured at different times after cell inoculation. Bars depict the mean values, and error bars represent 95% co nfidence intervals. P values (two-tailed) were calculated using the Student's t test with Welch's correction and are compared with the control groups at the respective time points; * P = .023, ** P = .009, *** P <.001. C ) Mouse survival. Survival of mice was monitored daily. P <.001 for bortezomib compared with corresponding saline-injected controls. Inset , absolute mean body weight in grams. D ) Mean numbers of CD31 antibody-immunoreactive (CD31 + ) vessels on day 22 after the initiation of bortezomib treatment. Error bars represent 95% confidence intervals. P value (two-tailed) was calculated using the Student's t test with Welch's correction; ** P = .0087.
We next used the orthotopic tumor model to investigate the effect of bortezomib on survival as well as its potential antiangiogenic activity against human neuroblastoma. SCID mice (n = 30) were inoculated intra-adrenally with SH-SY5Y cells, which have high angiogenic activity, grow orthotopically, and have a pattern of metastasis that is similar to that of advanced-stage human neuroblastoma, and 10 days later were treated with bortezomib or saline ( 34 ) . At days 30, 40, and 50 after tumor cell inoculation, mice treated with bortezomib had statistically significantly smaller tumor xenografts than control mice (mean tumor volume of bortezomib-treated versus untreated group on day 30: 160 mm 3 versus 350 mm 3 [difference = 190 mm 3 , 95% CI = 140.3 to 239.7 mm 3 , P = .023]; on day 40: 190 mm 3 versus 600 mm 3 [difference = 410 mm 3 , 95% CI = 285.8 to 534.2 mm 3 , P = .009]; on day 50: 260 mm 3 versus 950 mm 3 [difference = 690 mm 3 , 95% CI = 498.7 to 881.3 mm 3 , P <.001]; Fig. 7, B ).
To further test the therapeutic efficacy of this treatment, we randomly assigned mice bearing established SH-SY5Y adrenal tumors to treatment via tail vein injection with saline solution (untreated controls; n = 20) or 1 mg/kg bortezomib (n = 20) every 72 hours for 4 consecutive weeks. Mice treated with bortezomib lived statistically significantly longer than control mice (mean survival time: 72.3 days versus 50.6 days, difference = 21.7 days, 95% CI = 15.5 to 27.9 days, P <.001) ( Fig. 7, C ). The mean body weight of bortezomib-treated mice was not statistically significantly lower that that of the saline-injected (control) mice ( Fig. 7, C inset), indicating that in this model, as in the pseudometastatic tumor model, bortezomib had minimal side effects.
Histologic examination of tumors removed from SCID mice on day 22 after the beginning of treatment revealed that bortezomib-treated mice had fewer blood vessels than control mice (mean number of CD31-positive vessels, bortezomib versus control: 8.1 versus 27, difference = 18.9, 95% CI = 13.2 to 24.6, P = .0087) ( Fig. 7, D ).
To assess the impact of bortezomib on tumor cell proliferation, viability, apoptosis, and angiogenesis in vivo, we stained cryosections of tumors harvested from SCID mice on day 22 after the start of treatment to evaluate the blood vessels and the surrounding tumor parenchyma. Histopathologic analysis revealed that tumors from bortezomib-treated mice had less tumor cell proliferation than tumors from control mice, as assessed by staining with an antibody against the cell proliferation marker Ki-67 ( Fig. 8, A ). Staining for the endothelial cell-specific marker CD31 revealed a marked destruction of the tumor vasculature in tumors from bortezomib-treated mice compared with control mice ( Fig. 8, B ). Double staining of tumors for apoptosis by TUNEL and antibodies against human neuroblastoma cells (NB84a), CD34 (a glycoprotein expressed on endothelial cells), or smooth muscle actin (a marker for pericytes) demonstrated that tumors from mice treated with bortezomib had more tumor cell apoptosis, as well as endothelial and pericyte cell apoptosis, in the vasculature than tumors from control mice ( Fig. 8, C, D, and E , respectively). Bortezomib-induced apoptosis was detected in tumor tissues but not in normal tissues, such as heart, lung, kidneys, liver, and spleen (data not shown).
![Immunohistochemical and immunofluorescence analysis of orthotopic tumors removed from bortezomib-treated or saline-injected (control) mice. Tumors were harvested on day 22 after the initiation of bortezomib treatment from control mice and mice treated with 1 mg/kg bortezomib, as in Fig. 7 . Tissue sections were immunostained for the cell proliferation marker Ki-67 ( A ); for endothelial cell markers CD31 (B) and CD34 ( D , left panels ); with the neuroblastoma cell-specific antibody NB84a ( C ); or for smooth muscle actin (SMA) to show pericytes ( E , left panels ); for NB84a and apoptosis (NB84a + terminal deoxynucleotidyl transferase-mediated dUTP nick end labeling [TUNEL]; C , right panels ); for CD34 and apoptosis (CD34 + TUNEL; D, right panels ); and for SMA and apoptosis (SMA + TUNEL; E , right panels ). Brown , CD31-positive endothelial cells; red , neuroblastoma84a-positive neuroblastoma cells, CD34-positive endothelial cells, or SMA-positive pericytes; green , TUNEL-positive cells; yellow , co-localization of TUNEL-positive–neuroblastoma84a-positive neuroblastoma cells, TUNEL-positive–CD34-positive endothelial cells, or TUNEL-positive–SMA-positive pericytes. Cell nuclei were stained with 4′,6-diamidino-2-phenylindole ( blue ). Scale bars , 100 μm: panels A, C, D; 200 μm: panel B; 50 μm: panel E.](https://oup.silverchair-cdn.com/oup/backfile/Content_public/Journal/jnci/98/16/10.1093_jnci_djj309/2/m_jncidjj309f08_4c.jpeg?Expires=1716477262&Signature=FW9U2hi2kU9vIBZELfUP38IlvPGWOMvM0wAvagg7MghR85S2XkBM3tCjqkqFLtP~t7Id0FFsv7OeXCxIB0AzBI8FafZM1j1SH75Ic92tRF98e~JPDYp29zG0-RmVSTO8DcScfBm3keSb31BxvJBls6hLNzP005kZjWeOe5hC6n8qcpcdaoY~1HgTo5MPEPHr8deqtayGouiI2suvlVWMpntz65OzBH5ElZCFLu-d6EVzgcppK3hbmLFk5oYYmRTC17ilpjPavp7hQP65hpQrvm3uma6So8StwVZGYZCfp9I-SgBVmgnuQfN8Dci0VXTRrEKB4xj8~dMOWF9n3ceoew__&Key-Pair-Id=APKAIE5G5CRDK6RD3PGA)
Immunohistochemical and immunofluorescence analysis of orthotopic tumors removed from bortezomib-treated or saline-injected (control) mice. Tumors were harvested on day 22 after the initiation of bortezomib treatment from control mice and mice treated with 1 mg/kg bortezomib, as in Fig. 7 . Tissue sections were immunostained for the cell proliferation marker Ki-67 ( A ); for endothelial cell markers CD31 (B) and CD34 ( D , left panels ); with the neuroblastoma cell-specific antibody NB84a ( C ); or for smooth muscle actin (SMA) to show pericytes ( E , left panels ); for NB84a and apoptosis (NB84a + terminal deoxynucleotidyl transferase-mediated dUTP nick end labeling [TUNEL]; C , right panels ); for CD34 and apoptosis (CD34 + TUNEL; D, right panels ); and for SMA and apoptosis (SMA + TUNEL; E , right panels ). Brown , CD31-positive endothelial cells; red , neuroblastoma84a-positive neuroblastoma cells, CD34-positive endothelial cells, or SMA-positive pericytes; green , TUNEL-positive cells; yellow , co-localization of TUNEL-positive–neuroblastoma84a-positive neuroblastoma cells, TUNEL-positive–CD34-positive endothelial cells, or TUNEL-positive–SMA-positive pericytes. Cell nuclei were stained with 4′,6-diamidino-2-phenylindole ( blue ). Scale bars , 100 μm: panels A, C, D; 200 μm: panel B; 50 μm: panel E.
D ISCUSSION
We have shown that bortezomib inhibited the growth and survival of human neuroblastoma cell lines and primary human neuroblastoma cells but had little effect on normal fibroblasts. Moreover, bortezomib inhibited the growth and survival of neuroblastoma cell lines and patient-derived neuroblastoma cells at concentrations lower than 10 nM, a level that is achievable in bortezomib-treated patients, as previously reported by Rajkumar et al. ( 3 ) and Boccadoro et al. ( 18 ) . By contrast, the inhibitory concentration of bortezomib for normal fibroblasts was 1 μM or higher ( Fig. 1, F ) and that for normal peripheral blood mononuclear cells is 100 nM or higher ( 18 , 63 ) , suggesting that bortezomib has preferential cytotoxicity for cancer cells.
An important factor that may influence the survival response of cells to a given drug in vitro is the method of culture. Cells grown in monolayers are often more sensitive to death-inducing agents than cells grown as colonies because of the higher surface of exposure of monolayer cultures and a limited drug penetration in the colonies ( 54 ) . Moreover, solid tumors in vivo would typically have much lower growth fractions than monolayer cell cultures ( 54 ) . Our results indicate that, unlike the majority of anticancer chemotherapeutic agents, bortezomib appears to be equally effective at killing neuroblastoma cells growing in colonies and those cultured in subconfluent monolayers. Similar results were obtained by Frankel et al. ( 8 ) using multicellular spheroids. That is, bortezomib showed equal or greater activity in spheroids than in the respective monolayer cell cultures. This finding suggests that the in vivo activity of bortezomib is unlikely to be influenced by the relatively low fraction of actively growing cells in solid tumors, which limits the therapeutic efficacy of many conventional cell cycle-dependent drugs ( 64 ) .
We further addressed the question of whether induction of apoptosis in neuroblastoma cells by bortezomib is mediated by p53. Indeed, the use of short-term assays of cultured and treated cells allowed detection of a highly statistically significant association between wild-type p53 status and sensitivity to known anticancer agents among a panel of 60 cell lines ( 65 ) . Because p53 induces both growth arrest and apoptosis in response to DNA damage, one might predict that wild-type p53 would be associated with response to such drugs when using such assays. However, no correlation was found between drug sensitivity and wild-type p53 when a subset of the same cell lines was tested in a clonogenic assay ( 66 ) . This result is due to the fact that although apoptosis has a prominent role in the response of tumor cells with wild-type p53, alternative (i.e., nonapoptotic) pathways of cell death contribute to the elimination of p53-deficient cells ( 54 , 67 ) . Two studies reported that p53 is frequently mutated in many human cancers but not in neuroblastoma; the authors suggested that cytoplasmic sequestration of p53 in effect serves to functionally inactivate this protein in neuroblastoma ( 62 , 68 ) . By contrast, another study reported nuclear localization of p53 in neuroblastoma ( 69 ) . However, Wolff et al. ( 70 ) reported that wild-type p53 accumulates in the nucleus in an inactive conformation that cannot be integrated into the transcriptional complex.
We found that SK-NBE2c and LAN-1 cells, two neuroblastoma cell lines that are unusual because they express a nonfunctional mutant form of p53 ( 61 , 62 ) , were as sensitive to bortezomib as the other neuroblastoma cell lines that expressed wild-type p53. Furthermore, bortezomib exposure resulted in the time-dependent accumulation of cells in the G 2 /M phase of the cell cycle for all cell lines tested, indicating that the G 2 /M-phase arrest caused by proteasome inhibition may occur through a p53-independent pathway, as has been observed in non–small-cell lung cancer ( 9 ) . Thus, p53 may not be the sole upstream signal for apoptosis induction in our model, as is also the case with glioblastoma multiforme ( 15 ) . However, the time-dependent induction of p53 expression in SH-SY5Y and IMR-32 cells by bortezomib (Supplementary Fig. 1) suggests the involvement of both p53-dependent and p53-independent mechanisms.
An alternative mechanism underlying bortezomib activity has been suggested to be caspase activation ( 23 , 59 ) . However, bortezomib-induced apoptosis can also occur via the mitochondrial pathway, irrespective of the status of caspase-8 whose gene is frequently inactivated in neuroblastoma ( 60 ) . Our finding that the antioxidant NAC partially blocked bortezomib-induced mitochondrial membrane potential loss in neuroblastoma cells suggests that free radicals are intermediates in this pathway of apoptosis. However, the generation of free radicals may be just one of a number of intracellular mechanisms that amplify or maintain apoptotic signaling in response to bortezomib. Moreover, although our findings suggest that caspases have a pivotal role in bortezomib-triggered apoptosis, the upstream signals that lie between drug exposure and caspase activation are unknown as is whether mechanisms of cell death other than apoptosis, such as autophagy and mitotic catastrophe, are involved in bortezomib function ( 54 , 67 ) .
In this study, we found that treatment with bortezomib inhibited tumor cell proliferation and angiogenesis and, hence, reduced total tumor volume while sparing normal organs (as assessed by the lack of change in body weight) in two different xenograft neuroblastoma models. Our studies on neuroblastoma cells implanted orthotopically in the adrenal capsule of SCID mice were designed to elucidate the effects of bortezomib on the host microenvironment, particularly on components of the microenvironment that are related to tumor angiogenesis. We found that bortezomib inhibited the growth of established orthotopic neuroblastoma tumors in mice. Our data showing fewer CD31-positive blood vessels in orthotopic tumors treated with bortezomib compared with control tumors supports the hypothesis that bortezomib affects tumor growth through its inhibitory effect on angiogenesis. Immunohistochemical analysis of orthotopic neuroblastoma tumors demonstrated a statistically significant decrease in microvessel density with an associated increase in apoptotic tumor cells and tumor-associated endothelial and perivascular cells. Indeed, double staining of the tumor vasculature with antibodies against CD34 or smooth muscle and TUNEL staining suggested that the reduction in microvessel density was attributable to a pronounced increase in apoptosis of endothelial cells and pericytes.
Our results in the orthotopic neuroblastoma model suggest that bortezomib treatment makes it possible to target both the blood vessels and the tumor mass for destruction. Our findings are in agreement with previous results showing that, in mice bearing human cancer xenografts, an antiangiogenic approach is more effective and less toxic than conventional therapy ( 71 – 73 ) . Thus, the potential for dual action of bortezomib in neuroblastoma may result in a higher and more durable anticancer effect than a strictly antiangiogenic approach.
The main limitation of our study is that detailed pharmacokinetic and toxicology studies in children should be performed before drawing conclusions about the efficacy of bortezomib in preclinical models of neuroblastoma. Moreover, although our paper focused on the efficacy of bortezomib as single agent against neuroblastoma, we recognize the importance of combining this novel drug with other agents, as suggested by the growing literature ( 18 , 63 ) .
In conclusion, these preclinical results support the design of a phase I study aimed at testing the feasibility of bortezomib treatment in neuroblastoma patients.
Work supported by Fondazione Italiana per la lotta al Neuroblastoma, Associazione Italiana Ricerca Cancro, and Ministry of Health. The study sponsors had no role in the design of the study; the collection, analysis, or interpretation of the data; the writing of the manuscript; or the decision to submit the manuscript for publication.
F. Pastorino and G. Pagnan are recipients of a Fondazione Italiana per la Lotta al Neuroblastoma fellowship; C. Brignole is a recipient of a Fondazione Italiana Ricerca Cancro fellowship.
C. Brignole, D. Marimpietri, and F. Pastorino contributed equally to the work and should be considered joint first authors; G. Pagnan and M. Ponzoni contributed equally to the work and should be considered joint last authors.
We thank B. Carlini, C. Cocco, and F. Ferlito for expert technical assistance; C. Bernardini for editing. Bortezomib was kindly provided by Millenium Pharmaceuticals Inc, Cambridge, MA.
References
De Bernardi B, Nicolas B, Boni L, Indolfi P, Carli M, Cordero Di Montezemolo L, et al. Disseminated neuroblastoma in children older than one year at diagnosis: comparable results with three consecutive high-dose protocols adopted by the Italian Co-operative Group for Neuroblastoma.
Rajkumar SV, Richardson PG, Hideshima T, Anderson KC. Proteasome inhibition as a novel therapeutic target in human cancer.
Mani A, Gelmann EP. The ubiquitin-proteasome pathway and its role in cancer.
Glickman MH, Ciechanover A. The ubiquitin-proteasome proteolytic pathway: destruction for the sake of construction.
Adams J, Palombella VJ, Sausville EA, Johnson J, Destree A, Lazarus DD, et al. Proteasome inhibitors: a novel class of potent and effective antitumor agents.
Adams J. Potential for proteasome inhibition in the treatment of cancer.
Frankel A, Man S, Elliott P, Adams J, Kerbel RS. Lack of multicellular drug resistance observed in human ovarian and prostate carcinoma treated with the proteasome inhibitor PS-341.
Ling YH, Liebes L, Jiang JD, Holland JF, Elliott PJ, Adams J, et al. Mechanisms of proteasome inhibitor PS-341-induced G(2)-M-phase arrest and apoptosis in human non-small cell lung cancer cell lines.
Nawrocki ST, Bruns CJ, Harbison MT, Bold RJ, Gotsch BS, Abbruzzese JL, et al. Effects of the proteasome inhibitor PS-341 on apoptosis and angiogenesis in orthotopic human pancreatic tumor xenografts.
Williams S, Pettaway C, Song R, Papandreou C, Logothetis C, McConkey DJ. Differential effects of the proteasome inhibitor bortezomib on apoptosis and angiogenesis in human prostate tumor xenografts.
Amiri KI, Horton LW, LaFleur BJ, Sosman JA, Richmond A. Augmenting chemosensitivity of malignant melanoma tumors via proteasome inhibition: implication for bortezomib (VELCADE, PS-341) as a therapeutic agent for malignant melanoma.
LeBlanc R, Catley LP, Hideshima T, Lentzsch S, Mitsiades CS, Mitsiades N, et al. Proteasome inhibitor PS-341 inhibits human myeloma cell growth in vivo and prolongs survival in a murine model.
Orlowski RZ, Eswara JR, Lafond-Walker A, Grever MR, Orlowski M, Dang CV. Tumor growth inhibition induced in a murine model of human Burkitt's lymphoma by a proteasome inhibitor.
Yin D, Zhou H, Kumagai T, Liu G, Ong JM, Black KL, et al. Proteasome inhibitor PS-341 causes cell growth arrest and apoptosis in human glioblastoma multiforme (GBM).
Richardson PG, Barlogie B, Berenson J, Singhal S, Jagannath S, Irwin D, et al. A phase 2 study of bortezomib in relapsed, refractory myeloma.
Davis NB, Taber DA, Ansari RH, Ryan CW, George C, Vokes EE, et al. Phase II trial of PS-341 in patients with renal cell cancer: a University of Chicago phase II consortium study.
Boccadoro M, Morgan G, Cavenagh J. Preclinical evaluation of the proteasome inhibitor bortezomib in cancer therapy.
Soldatenkov VA, Dritschilo A. Apoptosis of Ewing's sarcoma cells is accompanied by accumulation of ubiquitinated proteins.
Mugita N, Honda Y, Nakamura H, Fujiwara T, Tanaka K, Omura S, et al. The involvement of proteasome in myogenic differentiation of murine myocytes and human rhabdomyosarcoma cells.
Blaney SM, Bernstein M, Neville K, Ginsberg J, Kitchen B, Horton T, et al. Phase I study of the proteasome inhibitor bortezomib in pediatric patients with refractory solid tumors: a Children's Oncology Group study (ADVL0015).
Shinohara K, Tomioka M, Nakano H, Tone S, Ito H, Kawashima S. Apoptosis induction resulting from proteasome inhibition.
Mitsiades N, Mitsiades CS, Poulaki V, Chauhan D, Fanourakis G, Gu X, et al. Molecular sequelae of proteasome inhibition in human multiple myeloma cells.
Sunwoo JB, Chen Z, Dong G, Yeh N, Crowl Bancroft C, Sausville E, et al. Novel proteasome inhibitor PS-341 inhibits activation of nuclear factor-kappa B, cell survival, tumor growth, and angiogenesis in squamous cell carcinoma.
Hayashi T, Hideshima T, Anderson KC. Novel therapies for multiple myeloma.
Roccaro AM, Hideshima T, Raje N, Kumar S, Ishitsuka K, Yasui H, et al. Bortezomib mediates antiangiogenesis in multiple myeloma via direct and indirect effects on endothelial cells.
Wassberg E, Hedborg F, Skoldenberg E, Stridsberg M, Christofferson R. Inhibition of angiogenesis induces chromaffin differentiation and apoptosis in neuroblastoma.
Kaicker S, McCrudden KW, Beck L, New T, Huang J, Frischer JS, et al. Thalidomide is anti-angiogenic in a xenograft model of neuroblastoma.
Ribatti D, Ponzoni M. Antiangiogenic strategies in neuroblastoma.
Ribatti D, Vacca A, Nico B, De Falco G, Giuseppe Montaldo P, Ponzoni M. Angiogenesis and anti-angiogenesis in neuroblastoma.
Iwasaki I, Sugiyama H, Kanazawa S, Hemmi H. Establishment of cisplatin-resistant variants of human neuroblastoma cell lines, TGW and GOTO, and their drug cross-resistance profiles.
Manohar CF, Bray JA, Salwen HR, Madafiglio J, Cheng A, Flemming C, et al. MYCN-mediated regulation of the MRP1 promoter in human neuroblastoma.
Pastorino F, Brignole C, Marimpietri D, Cilli M, Gambini C, Ribatti D, et al. Vascular damage and anti-angiogenic effects of tumor vessel-targeted liposomal chemotherapy.
Longo L, Christiansen H, Christiansen NM, Cornaglia-Ferraris P, Lampert F. N-myc amplification at chromosome band 1p32 in neuroblastoma cells as investigated by in situ hybridization.
Cornaglia-Ferraris P, Sansone R, Mariottini GL, Longo L, Tonini GP. Evidence of loss of N-myc amplification during the establishment of a human neuroblastoma cell line.
Tumilowicz JJ, Nichols WW, Cholon JJ, Greene AE. Definition of a continuous human cell line derived from neuroblastoma.
Seeger RC, Siegel SE, Sidell N. Neuroblastoma: clinical perspectives, monoclonal antibodies, and retinoic acid.
Seeger RC, Rayner SA, Banerjee A, Chung H, Laug WE, Neustein HB, et al. Morphology, growth, chromosomal pattern and fibrinolytic activity of two new human neuroblastoma cell lines.
Biedler JL, Roffler-Tarlov S, Schachner M, Freedman LS. Multiple neurotransmitter synthesis by human neuroblastoma cell lines and clones.
Biedler JL, Helson L, Spengler BA. Morphology and growth, tumorigenicity, and cytogenetics of human neuroblastoma cells in continuous culture.
Gross N, Favre S, Beck D, Meyer M. Differentiation-related expression of adhesion molecules and receptors on human neuroblastoma tissues, cell lines and variants.
Ponzoni M, Bocca P, Chiesa V, Decensi A, Pistoia V, Raffaghello L, et al. Differential effects of N-(4-hydroxyphenyl)retinamide and retinoic acid on neuroblastoma cells: apoptosis versus differentiation.
Airoldi I, Lualdi S, Bruno S, Raffaghello L, Occhino M, Gambini C, et al. Expression of costimulatory molecules in human neuroblastoma. Evidence that CD40+ neuroblastoma cells undergo apoptosis following interaction with CD40L.
Marimpietri D, Nico B, Vacca A, Mangieri D, Catarsi P, Ponzoni M, et al. Synergistic inhibition of human neuroblastoma-related angiogenesis by vinblastine and rapamycin.
Keshelava N, Tsao-Wei D, Reynolds CP. Pyrazoloacridine is active in multidrug-resistant neuroblastoma cell lines with nonfunctional p53.
Pagnan G, Stuart DD, Pastorino F, Raffaghello L, Montaldo PG, Allen TM, et al. Delivery of c-myb antisense oligodeoxynucleotides to human neuroblastoma cells via disialoganglioside GD(2)-targeted immunoliposomes: antitumor effects.
Nicoletti I, Migliorati G, Pagliacci MC, Grignani F, Riccardi C. A rapid and simple method for measuring thymocyte apoptosis by propidium iodide staining and flow cytometry.
Pastorino F, Brignole C, Marimpietri D, Sapra P, Moase EH, Allen TM, et al. Doxorubicin-loaded Fab' fragments of anti-disialoganglioside immunoliposomes selectively inhibit the growth and dissemination of human neuroblastoma in nude mice.
Ribatti D, Gualandris A, Bastaki M, Vacca A, Iurlaro M, Roncali L, et al. New model for the study of angiogenesis and antiangiogenesis in the chick embryo chorioallantoic membrane: the gelatin sponge/chorioallantoic membrane assay.
Elias H, Hyde DM. Stereological measurements of isotropic structures. In: Elias H, Hyde DM, editors. A guide to practical stereology. Basel (Switzerland): Karger;
Adams J. The development of proteasome inhibitors as anticancer drugs.
Brown JM, Attardi LD. The role of apoptosis in cancer development and treatment response.
Bossy-Wetzel E, Green DR. Apoptosis: checkpoint at the mitochondrial frontier.
Lopes UG, Erhardt P, Yao R, Cooper GM. p53-dependent induction of apoptosis by proteasome inhibitors.
Zou W, Yue P, Lin N, He M, Zhou Z, Lonial S, et al. Vitamin C inactivates the proteasome inhibitor PS-341 in human cancer cells.
Banelli B, Casciano I, Croce M, Di Vinci A, Gelvi I, Pagnan G, et al. Expression and methylation of CASP8 in neuroblastoma: identification of a promoter region.
Keshelava N, Zuo JJ, Chen P, Waidyaratne SN, Luna MC, Gomer CJ, et al. Loss of p53 function confers high-level multidrug resistance in neuroblastoma cell lines.
Tweddle DA, Malcolm AJ, Bown N, Pearson AD, Lunec J. Evidence for the development of p53 mutations after cytotoxic therapy in a neuroblastoma cell line.
Orlowski RZ, Voorhees PM, Garcia RA, Hall MD, Kudrik FJ, Allred T, et al. Phase 1 trial of the proteasome inhibitor bortezomib and pegylated liposomal doxorubicin in patients with advanced hematologic malignancies.
Tannock IF. Cellular and molecular basic of chemotherapy. In: Tannock IF, editor. The basic science of oncology. New York: McGraw-Hill;
Weinstein JN, Myers TG, O'Connor PM, Friend SH, Fornace AJ Jr, Kohn KW, et al. An information-intensive approach to the molecular pharmacology of cancer.
Brown JM. NCI's anticancer drug screening program may not be selecting for clinically active compounds.
Nikolaev AY, Li M, Puskas N, Qin J, Gu W. Parc: a cytoplasmic anchor for p53.
Hoehner JC, Gestblom C, Olsen L, Pahlman S. Spatial association of apoptosis-related gene expression and cellular death in clinical neuroblastoma.
Wolff A, Technau A, Ihling C, Technau-Ihling K, Erber R, Bosch FX, et al. Evidence that wild-type p53 in neuroblastoma cells is in a conformation refractory to integration into the transcriptional complex.
Ellerby HM, Arap W, Ellerby LM, Kain R, Andrusiak R, Rio GD, et al. Anti-cancer activity of targeted pro-apoptotic peptides.
Curnis F, Sacchi A, Borgna L, Magni F, Gasparri A, Corti A. Enhancement of tumor necrosis factor alpha antitumor immunotherapeutic properties by targeted delivery to aminopeptidase N (CD13).

