


Abstract
Issues of reported study quality have not been addressed empirically with large-scale data in the cancer prognostic literature.
Eight quality measures pertaining to study design and assay methods (i.e., blinding, prospective versus retrospective design, power calculations, outcomes' definitions, time of enrollment, reporting of variables, assay description, and assay reference) were evaluated in cancer prognostic marker studies included in meta-analyses identified in Medline and EMBASE. To be eligible, meta-analyses had to include at least six studies and to examine binary outcomes. We estimated the ratios of relative risks, which compared the overall prognostic effects (summary relative risks) between poor-quality and good-quality studies for each quality item. Between-study heterogeneity was tested with the Q statistic (statistically significant at P <.10). All statistical tests were two-sided.
We identified 20 meta-analyses that included 331 cancer prognostic marker studies published between 1987 and 2005. Only three (0.9%) of the 331 studies presented power calculations, 129 (39.0%) studies stated that analyses were blinded, and 73 (21.5%) stated that they were prospective. Time of enrollment was defined in 232 (70.0%), 234 (70.7%) gave lists of candidate variables, and 254 (76.7%) defined outcomes. The assay used was described in 317 (95.8%), but only 177 (53.5%) provided the assay reference. Estimates of prognostic effects from poor-quality studies varied considerably and could be larger or smaller than summary estimates derived from meta-analyses. Summary ratios of relative risks of poor- versus good-quality studies for the seven quality measures ranged from 0.95 to but 1.26, but none was statistically significantly. There was statistically significant heterogeneity ( P <.10) between the ratios of relative risk estimates across meta-analyses for blinding, defining endpoints, and stating variables and assay references.
Among cancer prognostic marker studies, reporting quality of design and assay information often appears suboptimal, indicating that this literature may be largely unreliable. Given the potential clinical importance of prognostic marker information, improved design and reporting of these studies are warranted.
Many prognostic markers have been proposed for various diseases, including cancer, many have not been validated, and most have not changed clinical practice. Suboptimal study design (such as lack of blinding and retrospective design) and missing methodologic information have been associated with exaggerated results for other types of clinical research.
Meta-analysis of 331 studies on cancer prognostic markers from 20 meta-analyses.
The body of literature for prognostic marker studies may be largely unreliable because the quality of the information presented about study design and assays used often appeared suboptimal.
Because of the potential clinical importance of prognostic marker information, improvements in the design and reporting of prognostic marker studies are warranted.
Reported study quality is only a surrogate for true study quality. Individual meta-analyses, from which estimates and data were obtained, may themselves suffer from various biases and used different statistical measures to compare outcomes.
The literature on prognostic factors is rapidly expanding. Numerous prognostic markers have been proposed for diverse clinical outcomes of various diseases ( 1 , 2 ), with cancer being one of the key fields in which prognostic markers are developed. However, most proposed cancer prognostic markers have not changed clinical practice ( 3 – 5 ). The initial promising results of many proposed markers have not been validated, even when cutting-edge molecular techniques have been used to develop such markers ( 6 , 7 ). This problem may result from poor study quality and may be compounded by suboptimal reporting of prognostic studies ( 1 , 2 , 8 – 11 ). Identification of this problem has led to the development of recommendations for the reporting of prognostic marker studies (i.e., the REMARK criteria) ( 12 ). The goal of these guidelines was to encourage transparent and complete reporting to help readers judge the data and understand the context in which the conclusions apply ( 12 ). REMARK is not a quality appraisal tool per se, but many of the reporting guideline items clearly indicate which study designs and other characteristics are desirable. In particular, REMARK guidelines on reporting of study design and assay methods are directly relevant to the conduct and implementation of such research ( 12 ).
Several groups have tried to determine whether studies with good reporting quality identify weaker effects than studies with poor reporting quality or vice versa. Various empirical investigations have found that for randomized controlled trials, poor quality—in particular, lack of masking and subverted allocation concealment—may be related to exaggerated treatment effects ( 13 – 16 ); that poor quality may be related to either stronger or weaker treatment effects ( 17 – 19 ); and that findings from studies with retrospective nonrandomized designs deviate more from the findings of randomized studies than those from trials with prospective nonrandomized designs ( 20 ). However, the reationship, if any, between reported quality and prognostic effect has not been investigated in a quantitative manner in the prognostic literature.
The purpose of this study was to describe the quality of reporting of tumor prognostic marker studies included in meta-analyses and to examine whether various aspects of the reporting quality of the study were associated with the magnitude of the estimated prognostic effect across investigations that evaluated the same tumor markers. We focused on aspects of the study design and implementation in prognostic studies because retrospective design and lack of blinding have been associated with exaggerated results from studies with other designs ( 13 – 16 ).
Studies and Methods
Search Strategy and Eligibility Criteria for Meta-analyses
We identified meta-analyses of prognostic markers for cancer by searching Medline and EMBASE (last update June 2005). The search algorithm used the terms prognostic marker, prognostic factor, survival, mortality, recurrence, prediction, outcome, AND meta-analysis AND (cancer OR neoplas* OR malign*). We also included a variety of the most commonly used molecular markers and clinical prognostic factors (available from the authors upon request), to increase the sensitivity of the search.
We accepted meta-analyses that were published in the English language and that analyzed studies of nongenetic prognostic markers and cancer. Eligible meta-analyses had to include at least six primary studies ( 17 ) and to address at least one prognostic marker that fit with the definition given by the REMARK consensus statement ( 12 ), i.e., a marker has to have an association with some clinical outcome, typically a time-to-event outcome such as overall survival or recurrence-free survival, that could be assessed for the clinical management of a patient. With fewer studies, it would have been difficult to examine the association between reported quality and prognostic effects. When an article contained more than one eligible meta-analysis on different prognostic markers, each meta-analysis was considered separately. When two or more meta-analyses addressed the same prognostic marker, we used only the meta-analysis with the greater number of primary studies to avoid duplication of the information.
We accepted meta-analyses regardless of the adverse clinical outcome they addressed (death, disease progression, or no treatment response). When meta-analyses of a specific marker included more than one clinical outcome, we used only the outcome that was examined by the largest number of primary studies.
Primary Studies Included in the Meta-analyses
We retrieved the full text of the primary studies included in the identified eligible meta-analyses. Primary studies were used to evaluate quality of various reported study components. To avoid making subjective choices, we captured estimates of the prognostic effect directly from the meta-analyses for data synthesis. We did not try to re-extract the prognostic effect data from the primary studies, unless these data were not readily discernible from the corresponding meta-analysis.
Data Extraction
Two investigators (PAK and DDK) extracted data from eligible studies independently, discussed the data, and reached consensus on all components. In each meta-analysis, we recorded the author name, journal name, year of publication, number of studies included, number of patients analyzed, and the malignancy and prognostic factor addressed. For each primary study included in each meta-analysis, we recorded the point estimate of the relative risk and its 95% confidence interval for the adverse clinical outcome, as provided by the meta-analysis. Relative risk was expressed typically as hazard ratio or incidence rate ratio, but we also accepted odds ratios or risk ratios if the former metrics were not available. When the effect size information was not presented numerically in a study, this information was extracted from the meta-analysis forest plot by digitizing the forest plot images with the Engauge Digitizer version 2.12 software to obtain maximal accuracy. When a published meta-analysis presented only subgroup analyses for the outcome of interest, we included data from all studies across all subgroups.
Reported Quality Measures
For all 331 primary studies that were included in the 20 meta-analyses identified in our searches, we recorded the following information on study design and assay methods: whether the study stated that the evaluation of the prognostic marker was blinded to the patient outcome, whether the study was prospective (i.e., whether markers were measured at the time of patient enrollment and whether patients were then followed prospectively for outcomes), whether the study specified the time period during which patients were enrolled, whether the study precisely defined all clinical outcomes examined in the primary study (regardless of whether they were also examined in the meta-analysis or not), whether the study provided a list of candidate variables (i.e., variables that could potentially influence in any way the prognostic effect of the postulated prognostic marker), whether the study provided a rationale for the sample size (power calculation), and whether the study adequately described and referenced the assay methods for the prognostic marker. These quality components correspond to the sections on study design and assay methods in the REMARK recommendations ( 12 ).
Statistical Methods
The extracted relative risks for each primary study were analyzed with the use of random-effects calculations ( 21 , 22 ). Between-study heterogeneity was tested with the Q statistic (which was considered to be statistically significant for P <.10) ( 23 ), and its magnitude was measured with the I2 statistic (which was considered to be large for values of ≥50%) ( 23 ). The summary estimates of relative risk and their 95% confidence intervals, which we derived from scanned and digitized figure data, always agreed with the summary estimates stated in the published meta-analysis, with all deviations being less than 4% (mean = 1.3%, and median = 2%).
All summary estimates of relative risk were designed to be at least 1.0, i.e., we used the inverse of relative risk estimates of less than 1.0 (protective markers for the adverse clinical outcome), so that the comparison was always between the group with the higher risk for the primary outcome and the group with the lower risk for that outcome. Using this notation for the overall summary effect for each reported quality measure in each meta-analysis, we first calculated the random-effects summary estimate separately in studies with good and poor reported quality for each quality measure and then calculated the ratios of relative risks for poor- versus good-quality studies. Ratio of relative risk values of greater than 1.0 indicate that poor reported quality studies estimate larger prognostic effects than good reported quality studies and vice versa. The variance of the natural logarithm of the ratio of relative risk was estimated as the square root of the sum of variances of the natural logarithms of the summary relative risks in poor- and good-quality studies. The 95% confidence intervals were estimated as the point estimate plus or minus 1.96 times the square root of the variance. A meta-analysis could be included in this analysis only if it included studies with and without the quality component of interest. We also evaluated the difference between studies with good and poor reported quality by estimating the heterogeneity between the summary relative risks in the two subgroups with the Q and I2 statistics, described above. Finally, using random-effects calculations, we calculated the summary ratio of relative risk for each quality component across all the meta-analyses. We should acknowledge that, according to our definitions, studies with poor reported quality for a given component are likely a combination of studies with good quality in which the authors simply do not state methodologic details and studies with truly poor quality. Therefore, we would expect a dilution of the true effect of poor quality on estimated prognostic effect sizes.
Analyses were conducted with SPSS software version 13.0 (SPSS, Inc, Chicago, IL), StatXact-3 software version 3.0.2 (StatXact, 1996), and the metan module of Intercooled Stata version 8.2 (Stata Corp., College Station, TX). All P values were from two-sided statistical tests.
Results
Meta-analyses and Primary Studies Included in the Study
We initially identified 24 English language meta-analyses, four of which were excluded—three ( 24 – 26 ) because they overlapped with another meta-analysis and one ( 27 ) because it incorporated fewer than six studies. Therefore, 20 meta-analyses ( 28 – 47 ) were eligible for the analysis ( Table 1 ). The most common malignancy addressed was non–small-cell lung cancer in eight meta-analyses ( 32 , 34 – 36 , 38 , 40 , 42 , 45 ), followed by breast cancer in six ( 28 , 37 , 39 , 41 , 44 , 47 ); other malignancies included osteosarcoma in two meta-analyses ( 31 , 46 ), head and neck squamous cell carcinoma in two ( 29 , 30 ), glioblastoma in one ( 33 ), and various neoplasms in one ( 43 ). The number of primary studies included in each meta-analysis ranged from six to 50, and the number of patients enrolled ranged from 395 to 8029. The prognostic factor had a statistically significant effect on the risk of the main outcome in 15 (75%) of the meta-analyses ( 28 , 30 , 32 , 35 – 45 , 47 ), as judged by the obtained summary estimates, but only four of the summary relative risks exceeded 2.00 ( 30 , 41 , 43 , 47 ).
Characteristics of the meta-analyses analyzed and the percentage of studies fulfilling each quality item per meta-analysis *
| Reference | Malignancy | Prognostic factor | No. of studies (No. of patients) | I2 , % | RR (95% CI) | Blinded, % | Prospective, % | Time period, % | Outcome, % | Variables, % | Power, % | AD, % | AR, % |
|---|---|---|---|---|---|---|---|---|---|---|---|---|---|
| Uzzan et al. ( 28 ) | Breast cancer | MVD | 25 (6501) | 76 | 1.56 (1.30 to 1.74) | 56 | 36 | 62.5 | 50 | 91.6 | 4 | 79.1 | 45.8 |
| Kyzas et al. ( 29 ) | HNSCC | TP53 | 42 (3388) | 53 | 1.23 (0.97 to 1.57) | 47.6 | 14.3 | 71.4 | 59.5 | 66.6 | 0 | 92.9 | 28.6 |
| Kyzas et al. ( 30 ) | HNSCC | VEGF | 12 (1002) | 30 | 2.68 (1.82 to 3.96) | 66.6 | 0 | 75 | 58.3 | 83.3 | 0 | 100 | 0 |
| Pakos et al. ( 31 ) | Osteosarcoma | TP53 | 14 (436) | 0 | 1.45 (0.80 to 2.63) | 28.5 | 0 | 57.1 | 64.3 | 35.7 | 0 | 92.9 | 21.4 |
| Martin et al. ( 32 ) | NSCLC | Ki-67 | 17 (1863) | 36 | 1.52 (1.26 to 1.84) | 47 | 11.7 | 64.7 | 94.2 | 82.4 | 5.8 | 100 | 29.4 |
| Huncharek et al. ( 33 ) | Glioblastoma | EGFR | 7 (395) | 35 | 1.12 (0.61 to 2.07) | 0 | 14.3 | 57.1 | 100 | 57.1 | 0 | 100 | 85.7 |
| Meert et al. ( 34 ) | NSCLC | EGFR | 11 (2185) | 58 | 1.16 (0.95 to 1.42) | 54.5 | 18.2 | 81.8 | 100 | 72.7 | 0 | 100 | 72.7 |
| Meert et al. ( 35 ) | NSCLC | MVD | 23 (3620) | 68 | 1.92 (1.54 to 2.39) | 78.3 | 8.7 | 86.9 | 91.3 | 91.3 | 0 | 100 | 26.1 |
| Meert et al. ( 36 ) | NSCLC | c-erbB-2 | 22 (3365) | 56 | 1.53 (1.28 to 1.83) | 63.6 | 27.3 | 81.8 | 95.5 | 77.3 | 5 | 100 | 50 |
| Deming et al. ( 37 ) | Breast cancer | C-myc | 6 (1003) | 0 | 1.63 (1.25 to 2.14) | 0 | 0 | 83.3 | 50 | 83.3 | 0 | 100 | 83.3 |
| Martin et al. ( 38 ) | NSCLC | Bcl-2 | 19 (2909) | 65 | 1.69 (1.33 to 2.17) | 38.8 | 5.5 | 61.1 | 88.9 | 61.1 | 0 | 94.4 | 55.5 |
| Ryu et al. ( 39 ) | Breast cancer | BMI | 12 (8029) | 64 | 1.56 (1.22 to 2.00) | 0 | 66.6 | 100 | 100 | 100 | 0 | 66.6 | 58.3 |
| Mascaux et al. ( 40 ) | NSCLC | K-Ras | 30 (3620) | 55 | 1.32 (1.14 to 1.51) | 30 | 13.3 | 70 | 90 | 66.6 | 0 | 100 | 76.6 |
| Weinschenker et al. ( 41 ) | Breast cancer | BMM | 9 (2252) | 78 | 2.03 (1.46 to 2.84) | 33.3 | 100 | 66.6 | 77.7 | 66.6 | 0 | 100 | 88.8 |
| Steels et al. ( 42 ) | NSCLC | TP53 | 50 (5924) | 37 | 1.57 (1.41 to 1.75) | 48.3 | 8.3 | 88 | 92 | 72 | 0 | 98 | 72 |
| Funke and Schraut ( 43 ) | Various | BMM | 9 (548) | 68 | 2.36 (1.70 to 3.28) | 33.3 | 100 | 44.4 | 55.5 | 44.4 | 0 | 100 | 77.7 |
| Ferrandina et al. ( 44 ) | Breast cancer | Cathepsin-D | 12 (2691) | 52 | 1.98 (1.42 to 2.77) | 25 | 16.6 | 66.6 | 50 | 100 | 0 | 100 | 58.3 |
| Choma et al. ( 45 ) | NSCLC | DNA ploidy | 34 (3761) | 24 | 1.89 (1.51 to 2.32) | 22.2 | 41.7 | 70.4 | 85.2 | 66.6 | 0 | 100 | 74.1 |
| Pakos and Ioannidis ( 46 ) | Osteosarcoma | Pgp | 14 (597) | 52 | 1.32 (0.72 to 2.41) | 57.2 | 14.3 | 57.1 | 78.6 | 35.7 | 0 | 100 | 42.9 |
| Pharoah et al. ( 47 ) | Breast cancer | TP53 | 12 (2319) | 55 | 2.20 (1.56 to 3.09) | 18.2 | 0 | 75 | 58.3 | 100 | 0 | 100 | 83.3 |
The main outcome in all meta-analyses was death, except for three studies ( 28 , 43 , 44 ) in which disease progression or death was presented and one study ( 46 ) in which no response to treatment was presented. The effect metric was the hazard ratio in 11 studies ( 28 , 32 , 34 – 40 , 42 , 47 ) and the odds ratio in the others ( 29 – 31 , 33 , 41 , 43 – 46 ). RR = relative risk; CI = confidence interval; AD = assay described; AR = assay referenced, MVD = microvessel density; HNSCC = head and neck squamous cell carcinoma; TP53 = tumor suppressor protein 53 and its gene; VEGF = vascular endothelial growth factor; NSCLC = non–small-cell lung cancer; Ki-67 = proliferation index Ki-67, c-erbB-2: HER-2/neu receptor; EGFR = epidermal growth factor receptor; C-myc = oncogene c-myc; Bcl-2 = oncogene bcl-2; BMI = body mass index; K-Ras = oncogene K-Ras; BMM = bone marrow micrometastases; Pgp = P-glycoprotein.
There were 380 analyzed relative risk estimates across the 20 meta-analyses. These estimates were derived from 340 primary articles [(53–392) available online]; some articles contributed two different population estimates in a meta-analysis or provided data for more than one meta-analysis [(57,70,74,101,108,118,127,136,137,155,158,161,171,175,188,194,197,199,217,239,251,253,264, 274,282,284,346,350,352,355) available online]. Only four primary studies [(111,179,235,358) available online] had more than 1000 patients, with the largest sample size being 1238 patients [(235) available online]. We extracted data (Supplementary Table 1 and Supplementary Data, available online) from 331 of these 340 primary articles—seven [(213,249,257,321,322,365,385) available online] were in Japanese, and we could not retrieve the full text for two studies [(89,124) available online]. All articles were published between 1987 and 2005. The relative risk and standard error for each study were obtained from digitized forest plots from 12 of the meta-analyses ( 28 , 32 – 37 , 39 , 40 , 42 , 44 , 47 ). Five meta-analyses ( 37 , 39 , 41 , 44 , 47 ) used adjusted results for all studies. Four meta-analyses ( 29 – 31 , 46 ) used unadjusted results for all studies. The remaining 11 meta-analyses ( 28 , 32 – 36 , 38 , 40 , 42 , 43 , 45 ) apparently used adjusted and unadjusted estimates.
Quality Measures
The percentage of studies that adequately reported each quality component is presented for each meta-analysis in Table 1 . One hundred and twenty-nine (39.0%) of the 331 studies clearly stated that the evaluation of the prognostic marker was blinded to the patient outcome (for the many uncited references here and elsewhere in the section, see Supplementary Table 1 and Supplementary Data, available online). Only four studies [(72,91,197,253) available online] stated that the evaluation of the patient outcome was blinded to the marker. The percentage of blinded studies within a single meta-analysis varied substantially across meta-analyses, from 0% to 78.3% (exact P <.001). Only 73 (21.5%) of the 331 primary studies stated that they were prospective studies. However, again, substantial variability across meta-analyses was found, from 0% to 100% (exact P <.001), and two meta-analyses analyzed only prospective studies ( 41 , 43 ). The time period during which patients were selected was precisely defined in 232 (70.0%) of the 331 studies, with less variability across meta-analyses (range = 44%–100%; exact P = .092).
Outcomes were precisely defined in 254 (76.7%) of the 331 studies (range = 50%–100% across meta-analyses; exact P <.001). This percentage may be spuriously high because we considered all mortality definitions to be appropriate regardless of whether any level of detail was provided. A list of the considered candidate variables was presented in 234 (70.7%, range = 36%–100%; exact P <.001) studies. Only three (0.9%) [(61,152,155) available online] of the 331 primary studies gave a rationale (power calculation) for the sample size used. Finally, assay methods were described in 317 (95.8%, range = 67%–100%; exact P = .003) of the 331 studies, but the methods were referenced in only about half of them (i.e., 177 [53.5%] studies), with considerable variability across meta-analyses (range = 0%–89%; exact P <.001).
Quality Measures and Magnitude of Prognostic Effects
For each quality measure, we calculated a ratio of relative risk among all the meta-analyses. The ratio of relative risk and its 95% confidence interval for each quality measure is shown in Fig. 1 . Data on power calculations could not be reliably analyzed because too few studies provided a power calculation. We found scattered signals for statistically significant prognostic associations across seven ( 28 , 30 , 33 , 35 , 40 , 43 , 47 ) of the 20 meta-analyses that one or more quality component may be statistically significantly related to the magnitude of the prognostic effect. However, the signals were not consistent across studies, and only one meta-analysis ( 43 ) obtained statistically significantly larger effect sizes in poor-quality studies than in good-quality studies for three different quality components. In this meta-analysis, bone marrow micrometastases were found to be a stronger predictor of disease progression in studies that did not define the outcomes adequately than in those with well-defined outcomes, in studies that did not list the candidate variables than in those that listed them, and in studies that did not reference the assay used than in those with well-referenced assays.
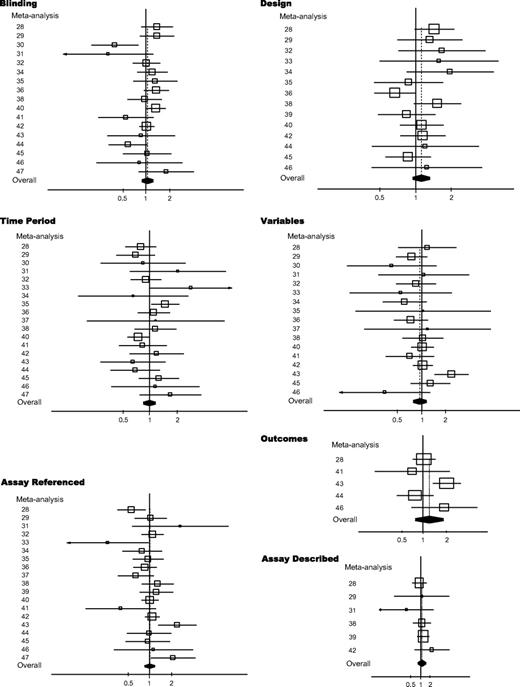
Ratios of relative risks (RRRs) and 95% confidence intervals (CIs) for each quality measure among all the meta-analyses. Summary RRRs and 95% CIs were derived from random-effects analyses. Each meta-analysis is shown by the reference number given in Table 1 . Summary RRR = dashed line ; RRR = open square ; 95% CI = line ; 95% CIs of summary RRRs = solid diamonds . Size of symbol is proportional to the inverse variance of the estimate.
Statistically significantly larger prognostic effects were found in one meta-analysis for nonblinded studies than for blinded studies ( 40 ), but the opposite result was found in another meta-analysis ( 30 ). No statistically significant differences in prognostic effects were found between prospective studies and retrospective studies. In two meta-analyses ( 33 , 35 ), studies that did not define the enrollment time period gave statistically significantly higher prognostic effects, and in one meta-analysis ( 40 ), such studies gave statistically significantly smaller effects. In addition to the meta-analysis of Funke and Schraut ( 43 ), another meta-analysis ( 47 ) found greater prognostic effects in studies that did not provide a reference for the assay, but the opposite was observed in two other meta-analyses ( 28 , 33 ).
Summary Ratios of Relative Risks
Summary ratios of relative risks for poor- versus good-quality studies for various quality components ranged from 0.95 to 1.26 ( Table 2 ). With the exception of listing of candidate variables, these summary ratios of relative risks tended to indicate that larger prognostic effects were associated with poor-quality studies than with good-quality studies; however, none of these ratios of relative risks was statistically significant. There was statistically significant variability across the combined meta-analyses for the ratio of relative risks defined by the following four of these quality components: blinding ( P = .05), defining outcome ( P = .03), listing candidate variables ( P = .09), and providing references for the assays ( P = .02). This result is consistent with the pattern described above, in which several meta-analyses individually observed larger or smaller prognostic effects in poor- versus good-quality studies ( Fig. 1 ).
Summary ratios of relative risks (RRRs) and 95% confidence intervals (CIs) for studies with poor- versus good-quality reporting for all the quality measures
| Quality measure | Meta-analyses * | Summary RRR (95% CI) | I2 ( P value) † |
|---|---|---|---|
| Blinding | 17 | 1.05 (0.90 to 1.23) | 40 (.05) |
| Design ‡ | 14 | 1.12 (0.94 to 1.32) | 17 (.27) |
| Outcomes | 5 | 1.26 (0.76 to 2.09) | 62 (.03) |
| Time period | 19 | 1.00 (0.86 to 1.17) | 25 (.15) |
| Variables | 17 | 0.95 (0.79 to 1.14) | 34 (.09) |
| Assay described | 6 | 1.10 (0.82 to 1.47) | 0 (.68) |
| Assay referenced | 19 | 1.01 (0.86 to 1.19) | 45 (.02) |
The number of meta-analyses had both studies with poor quality and studies with good quality (based on reporting).
All statistical tests were two-sided.
Retrospective versus prospective design. Studies with unstated design (amounting to 10% of total) are not included in the calculations presented. Their inclusion in the poor-quality group would not change the estimates considerably (data not shown).
Discussion
Our analysis indicates that the reporting of important quality information in cancer prognostic studies is often suboptimal. Power calculations for the required sample size were rarely presented, indicating that investigators may tend to conduct opportunistic studies on the basis of specimen availability rather than on thoughtful design. Most studies that we examined were small and underpowered to detect modest effects. It is also possible that considerable publication bias may be operating in this field; this bias would further confound efforts to arrive at accurate estimates of prognostic effects. Only a few studies stated that the analysis was blinded, and the blinding in these studies was limited to masking the evaluation of the prognostic marker to the outcome but not the converse. Only 20% of the studies that we analyzed were apparently prospective. Furthermore, although almost all studies described the method for the assessment of the prognostic marker, only half of them referenced the assay method to make further details readily retrievable. The lists of candidate variables and specification of the outcomes were usually adequate. However, mortality, one of the least ambiguous outcomes, was a very common outcome in the studies that we evaluated. The percentage of studies in which all clinical endpoints were precisely defined appeared to be lower for studies examining other softer endpoints than for those examining mortality. Again, we emphasize that the quality of the reporting should be distinguished from the quality of what was actually done.
For all quality components examined, we did not find strong evidence that studies with a poor-quality indicator had a larger prognostic effect than studies with a good-quality indicator. However, there was wide diversity across meta-analyses for most of the quality measures examined. In several meta-analyses, studies with poor-quality reporting provided statistically significantly different estimates, but these estimates could be either smaller or larger effects than those of good-quality studies. Because it is not possible to predict how quality problems could alter the estimated prognostic effect in a specific meta-analysis, it is not possible to correct the final estimates by simply adjusting for quality problems.
Previous studies ( 1 , 2 , 8 – 11 ) that evaluated selected aspects of reporting of specific quality features in prognostic marker studies concur that major problems exist and that there is much room for improvement. We should acknowledge, however, that poor reporting does not by itself indicate bias, unless the incomplete reporting is an attempt to avoid disclosing some adverse aspect of how the study was designed or conducted. A recent review ( 48 ) noted that evaluation of these quality measures in systematic reviews is often incomplete and inadequate. Given these deficits, the recently proposed REMARK reporting guidelines ( 12 ) are a step forward. However, even the best-quality reporting in a study will not transform a poorly designed or analyzed study into a good one. Improved design and conduct of prognostic studies are really the key components in increasing the reliability of this important literature. Improvement in this area may require the development of common standards and collaborations between investigators who focus on minimizing selective reporting and publication bias ( 49 ).
Our study has several limitations. First, reported quality is only a surrogate for the true study quality ( 16 ), and it may blur the relationship between true quality and prognostic effects. However, it is extremely difficult to evaluate the true quality because there is no protocol registration of prognostic studies that would allow comparison of what was done and what was reported ( 12 ). Second, we used data and estimates from previously published meta-analyses. It is possible that one or more of these meta-analyses suffer from various biases ( 29 ), including publication bias, selective reporting, and lack of standardization of predictors and outcomes. However, unpublished and missing or nonstandardized data are unlikely to represent large, well-powered investigations of better quality. Third, we unavoidably had to accept different effect metrics (hazard ratios or odds ratios) to compare outcomes across meta-analyses. Most of the meta-analyses examined reported hazard ratios. Odds ratios may deviate more from one than the hazard ratios. However, inflation of the effect is likely to be only modest for the values encountered in these studies ( 50 ), and the ratio of odds ratios should generally be a good approximation to the ratio of hazard ratios. Fourth, we only examined prognostic studies in the field of cancer. Similar analyses in randomized trials ( 17 , 18 ) have presented variable results for different quality measures in various medical fields. Therefore, even though cancer is one of the most prominent fields in the prognostic literature, our results should be confirmed across other fields. Analyses of the genetics literature have also found major problems that raise questions about the credibility of the results of the genetic associations ( 51 , 52 ). Even though three-quarters of the analyzed prognostic factors had statistically significant summary estimates of relative risk, these relative risks were generally modest. It is unclear whether quality-related biases may be more prominent when reported relative risks are more pronounced.
Even when we allow for these caveats, the association between quality defects and prognostic effects may be unpredictable. Because of poor-quality reporting and the overall poor quality of the design and the performance of cancer prognostic studies ( 29 ), the literature on prognostic markers in cancer may be largely unreliable. Given the potential clinical importance of this prognostic information, efforts to improve the design and reporting of these studies are warranted.
There is no funding or conflict of interest regarding this study. The authors had full responsibility for the design of the study, the collection of the data, the analysis and interpretation of the data, the decision to submit the manuscript for publication, and the writing of the manuscript.
References
Simon R, Altman DG. Statistical aspects of prognostic factor studies in oncology.
Schilsky RL, Taube SE. Tumor markers as clinical cancer tests—are we there yet?.
Hayes DF, Bast RC, Desch CE, Fritsche H Jr, Kemeny NE, Jessup JM, et al. Tumor marker utility grading system: a framework to evaluate clinical utility of tumor markers.
Bast RC Jr, Ravdin P, Hayes DF, Bates S, Fritsche H Jr, Jessup JM, et al.
Ransohoff DF. Lessons from controversy: ovarian cancer screening and serum proteomics.
Riley RD, Abrams KR, Sutton AJ, Lambert PC, Jones DR, Heney D, et al. Reporting of prognostic markers: current problems and development of guidelines for evidence-based practice in the future.
Altman DG, Lyman GH. Methodological challenges in the evaluation of prognostic factors in breast cancer.
Burton A, Altman DG. Missing covariate data within cancer prognostic studies: a review of current reporting and proposed guidelines.
Deeks JJ, Dinnes J, D'Amico R, Sowden AJ, Sakarovitch C, Song F, et al. International Stroke Trial Collaborative Group; European Carotid Surgery Trial Collaborative Group. Evaluating non-randomised intervention studies.
McShane LM, Altman DG, Sauerbrei W, Taube SE, Gion M, Clark GM. Statistics Subcommittee of the NCI-EORTC Working Group on Cancer Diagnostics. Reporting recommendations for tumor marker prognostic studies (REMARK).
Lijmer JG, Mol BW, Heisterkamp S, Bonsel GJ, Prins MH, van der Meulen JH, et al. Empirical evidence of design-related bias in studies of diagnostic tests.
Juni P, Egger M. Allocation concealment in clinical trials.
Linde K, Scholz M, Ramirez G, Clausius N, Melchart D, Jonas WB. Impact of study quality on outcome in placebo-controlled trials of homeopathy.
Kjaergard LL, Villumsen J, Gluud C. Reported methodologic quality and discrepancies between large and small randomized trials in meta-analyses.
Balk EM, Bonis PA, Moskowitz H, Schmid CH, Ioannidis JP, Wang C, et al. Correlation of quality measures with estimates of treatment effect in meta-analyses of randomized controlled trials.
Moher D, Jadad AR, Nichol G, Penman M, Tugwell P, Walsh S. Assessing the quality of randomized controlled trials: an annotated bibliography of scales and checklists.
Juni P, Witschi A, Bloch R, Egger M. The hazards of scoring the quality of clinical trials for meta-analysis.
Ioannidis JP, Haidich AB, Pappa M, Pantazis N, Kokori SI, Tektonidou MG, et al. Comparison of evidence of treatment effects in randomized and nonrandomized studies.
Pettiti DB. Meta-analysis, decision analysis and cost-effectiveness analysis. 2nd ed. New York (NY): Oxford University Press;
Lau J, Ioannidis JP, Schmid CH. Quantitative synthesis in systematic reviews.
Higgins JP, Thompson SG. Quantifying heterogeneity in a meta-analysis.
Mitsudomi T, Hamajima N, Ogawa M, Takahashi T. Prognostic significance of p53 alterations in patients with non-small cell lung cancer: a meta-analysis.
Huncharek M, Kupelnick B, Geschwind JF, Caubet JF. Prognostic significance of p53 mutations in non-small cell lung cancer: a meta-analysis of 829 cases from eight published studies.
Huncharek M, Muscat J, Geschwind JF. K-ras oncogene mutation as a prognostic marker in non-small cell lung cancer: a combined analysis of 881 cases.
Riley RD, Burchill SA, Abrams KR, Heney D, Sutton AJ, Jones DR, et al. A systematic review of molecular and biological markers in tumours of the Ewing's sarcoma family.
Uzzan B, Nicolas P, Cucherat M, Perret GY. Microvessel density as a prognostic factor in women with breast cancer: a systematic review of the literature and meta-analysis.
Kyzas PA, Loizou KT, Ioannidis JP. Selective reporting biases in cancer prognostic factor studies.
Kyzas PA, Cunha IW, Ioannidis JP. Prognostic significance of vascular endothelial growth factor immunohistochemical expression in head and neck squamous cell carcinoma: a meta-analysis.
Pakos EE, Kyzas PA, Ioannidis JP. Prognostic significance of TP53 tumor suppressor gene expression and mutations in human osteosarcoma: a meta-analysis.
Martin B, Paesmans M, Mascaux C, Berghmans T, Lothaire P, Meert AP, et al. Ki-67 expression and patients survival in lung cancer: systematic review of the literature with meta-analysis.
Huncharek M, Kupelnick B. Epidermal growth factor receptor gene amplification as a prognostic marker in glioblastoma multiforme: results of a meta-analysis.
Meert AP, Martin B, Delmotte P, Berghmans T, Lafitte JJ, Mascaux C, et al. The role of EGF-R expression on patient survival in lung cancer: a systematic review with meta-analysis.
Meert AP, Paesmans M, Martin B, Delmotte P, Berghmans T, Verdebout JM, et al. The role of microvessel density on the survival of patients with lung cancer: a systematic review of the literature with meta-analysis.
Meert AP, Martin B, Paesmans M, Berghmans T, Mascaux C, Verdebout JM, et al. The role of HER-2/neu expression on the survival of patients with lung cancer: a systematic review of the literature.
Deming SL, Nass SJ, Dickson RB, Trock BJ. C-myc amplification in breast cancer: a meta-analysis of its occurrence and prognostic relevance.
Martin B, Paesmans M, Berghmans T, Branle F, Ghisdal L, Mascaux C, et al. Role of Bcl-2 as a prognostic factor for survival in lung cancer: a systematic review of the literature with meta-analysis.
Ryu SY, Kim CB, Nam CM, Park JK, Kim KS, Park J, et al. Is body mass index the prognostic factor in breast cancer?: a meta-analysis.
Mascaux C, Iannino N, Martin B, Paesmans M, Berghmans T, Dusart M, et al. The role of RAS oncogene in survival of patients with lung cancer: a systematic review of the literature with meta-analysis.
Weinschenker P, Soares HP, Clark O, Del Giglio A. Immunocytochemical detection of epithelial cells in the bone marrow of primary breast cancer patients: a meta-analysis.
Steels E, Paesmans M, Berghmans T, Branle F, Lemaitre F, Mascaux C, et al. Role of p53 as a prognostic factor for survival in lung cancer: a systematic review of the literature with a meta-analysis.
Funke I, Schraut W. Meta-analyses of studies on bone marrow micrometastases: an independent prognostic impact remains to be substantiated.
Ferrandina G, Scambia G, Bardelli F, Benedetti Panici P, Mancuso S, Messori A. Relationship between cathepsin-D content and disease-free survival in node-negative breast cancer patients: a meta-analysis.
Choma D, Daures JP, Quantin X, Pujol JL. Aneuploidy and prognosis of non-small-cell lung cancer: a meta-analysis of published data.
Pakos EE, Ioannidis JP. The association of P-glycoprotein with response to chemotherapy and clinical outcome in patients with osteosarcoma. A meta-analysis.
Pharoah PD, Day NE, Caldas C. Somatic mutations in the p53 gene and prognosis in breast cancer: a meta-analysis.
Hayden JA, Cote P, Bombardier C. Evaluation of the quality of prognosis studies in systematic reviews.
Ioannidis JP, Gwinn M, Little J, Higgins JP, Bernstein JL, Boffetta P, et al. A road map for efficient and reliable human genome epidemiology.
Selvin S. Statistical analysis of epidemiologic data. New York (NY): Oxford University Press;
Bogardus ST Jr, Concato J, Feinstein AR. Clinical epidemiological quality in molecular genetic research: the need for methodological standards.

