


Abstract
Mammographic breast density is a strong risk factor for breast cancer. Tamoxifen, which reduces the risk of breast cancer in women at high risk, also reduces mammographic breast density. However, it is not known if tamoxifen-induced reductions in breast density can be used to identify women who will benefit the most from prophylactic treatment with this drug.
We conducted a nested case–control study within the first International Breast Cancer Intervention Study, a randomized prevention trial of tamoxifen vs placebo. Mammographic breast density was assessed visually and expressed as a percentage of the total breast area in 5% increments. Case subjects were 123 women diagnosed with breast cancer at or after their first follow-up mammogram, which took place 12–18 months after trial entry, and control subjects were 942 women without breast cancer. Multivariable logistic regression was used to adjust for other risk factors. All statistical tests were two-sided.
In the tamoxifen arm, 46% of women had a 10% or greater reduction in breast density at their 12- to 18-month mammogram. Compared with all women in the placebo group, women in the tamoxifen group who experienced a 10% or greater reduction in breast density had 63% reduction in breast cancer risk (odds ratio = 0.37, 95% confidence interval = 0.20 to 0.69, P = .002), whereas those who took tamoxifen but experienced less than a 10% reduction in breast density had no risk reduction (odds ratio = 1.13, 95% confidence interval = 0.72 to 1.77, P = .60). In the placebo arm, there was no statistically significant difference in breast cancer risk between subjects who experienced less than a 10% reduction in mammographic density and subjects who experienced a greater reduction.
The 12- to 18-month change in mammographic breast density is an excellent predictor of response to tamoxifen in the preventive setting.
Tamoxifen reduces the risk of breast cancer in women at high risk and reduces mammographic breast density, a strong risk factor for breast cancer. However, it is not known if tamoxifen-induced reductions in breast density can be used to identify women who will benefit the most from prophylactic treatment with tamoxifen.
A nested case–control study within a randomized prevention trial of tamoxifen vs placebo in which mammographic breast density was assessed visually at baseline and 12–18 months after trial entry and expressed as a percentage of the total breast area.
Compared with the placebo group, women in the tamoxifen arm who experienced a reduction in mammographic density of at least 10% had a 63% relative reduction in breast cancer risk, whereas those who experienced lesser reduction in mammographic density had no risk reduction. In the placebo arm, the risk of breast cancer did not differ between women who experienced less than a 10% reduction in mammographic density and those who experienced a greater reduction.
The 12- to 18-month change in mammographic breast density is an excellent predictor of response to tamoxifen in the preventive setting.
The reproducibility of the breast density measurements could only be assessed in a small number of subjects and was lower for breast density change over 12–18 months than for breast density at either baseline or 12–18 months. The original reader was blinded only to treatment allocation and not to case–control status. Films were obtainable for only approximately 55% of the women who developed breast cancer. Mammograms were assessed visually without computer aid.
From the Editors
Multiple studies have documented that mammographic breast density, alone ( 1–3 ) or in combination with other risk factors ( 4–6 ), is a risk factor for breast cancer. The attributable risk of breast cancer due to mammographic density is higher than that due to any other currently known risk factor. Furthermore, mammographic density is modifiable by exposures that influence breast cancer risk: it is increased in users of hormone replacement therapy (HRT) ( 7 , 8 ) and decreased by tamoxifen ( 9 , 10 ). However, for mammographic density to achieve the status of a validated biomarker for risk of breast cancer, as blood pressure and low-density lipoprotein (LDL) cholesterol have attained for heart disease, it is necessary to demonstrate that a short-term reduction in mammographic density accurately predicts a subsequent long-term reduction in breast cancer risk and, further, that those who experience the largest reduction in mammographic density are most likely to benefit from the preventive intervention. Kerlikowske et al. ( 11 ) found that changes in mammographic density were more strongly associated with subsequent risk of breast cancer than a single measure of mammographic density, but these changes were not related to any specific preventive intervention. Chemoprevention strategies have already been shown to be effective for reducing breast cancer risk in women at high risk of developing breast cancer ( 12 ); however, except for one randomized prevention trial ( 13 ) that reported an 86% reduction in the number of breast cancer cases among women with atypical hyperplasia who received tamoxifen vs placebo (three vs 23 cases), there is little information about which individual patients are most likely to benefit from prophylactic treatment with tamoxifen. Here, we report results of a case–control study nested within the first International Breast Cancer Intervention Study (IBIS-I), in which we examined whether a reduction in mammographic breast density after 12–18 months of tamoxifen treatment is an early indicator of the effect of tamoxifen on an individual’s risk of developing breast cancer.
Subjects and Methods
Study Setting and Population
The IBIS-I chemoprevention study was designed to evaluate the role of tamoxifen for breast cancer risk reduction in high-risk women ( 14 ). A total of 7152 women from the United Kingdom (60%), Australia or New Zealand (37%), and the rest of Europe (3%) aged 30–70 years were randomly assigned in a double-blinded fashion from April 1992 through March 2001 to either tamoxifen (20 mg/d) or placebo for 5 years. At the most recent analysis (based on a median follow-up of 96 months), tamoxifen was found to reduce the risk of developing invasive estrogen receptor–positive breast cancer by 34% but had no effect on the risk of developing invasive estrogen receptor–negative breast cancer ( 15 ).
The focus of this analysis was the extent to which changes in mammographic breast density between a baseline mammogram and the first follow-up mammogram (referred to as the 12-month mammogram below) predict subsequent treatment efficacy. We conducted a nested case–control study to investigate relationships between treatment, change in mammographic density, and known breast cancer risk factors. Detailed breast cancer risk factors were collected at study entry, and mammograms were taken at study entry (ie, baseline), and at 12- to 18-month intervals thereafter. To be eligible for IBIS-I, a woman had to be between 35 and 70 years old and have at least twice the average risk of a 50-year-old woman of developing breast cancer ( 14 ). Typically, therefore, an IBIS-I participant would have either a history of benign proliferative breast disease or a strong family history of breast cancer (ie, a mother or sister who developed breast cancer before age 50 years). The absolute observed 10-year risk of developing breast cancer in the placebo arm of the main study was 6.4% ( 15 ).
All IBIS-I participants provided written informed consent to join the trial and to have their medical records examined, and all subsequently provided more detailed written informed consent that specifically included the use of their mammograms. This study was approved by the North Somerset and South Bristol Research Ethics Committee and by the local ethics committees in hospitals in which it was conducted. The IBIS-I trial is registered with controlled-trials.com as ISRCTN91879928.
Mammographic Breast Density Assessment
We retrieved mammograms for case subjects (those who developed breast cancer) from participating study centers in the United Kingdom and Finland for centralized mammographic density reading at the Cambridge Breast Unit (Cambridge, UK). To minimize the administrative workload, control subjects were selected only from the major participating UK centers in Aberdeen, Bristol, Cardiff, Edinburgh, London, Manchester, Nottingham, and Southampton. We identified 1064 potential control subjects (women who had completed 5 years of treatment with full compliance and had not developed breast cancer) and requested the mammograms for these women. A total of 942 complete sets of mammograms (baseline and first follow-up) were recovered. The missing mammograms had either been lost or destroyed in accordance with the local archiving policy. The control subjects who were selected for this case–control study did not differ with respect to demographic factors from the IBIS-I control subjects who were not selected (data not shown).
Case subjects were women from the United Kingdom and Finland who were diagnosed with breast cancer either as a result of, or after, their first follow-up mammogram. Of the 224 British and Finnish women who had a diagnosis of breast cancer before the cutoff date of October 1, 2007, that was reported to us before September 30, 2008, 126 had retrievable baseline and 12-month mammograms. Three of these women had been diagnosed within the first 12 months on study and were excluded from the analysis. The remaining 123 women came from the following centers: Aberdeen (n = 6), Bristol (n = 33), Cambridge (n = 1), Cardiff (n = 7), Chelmsford (n = 4), Edinburgh (n = 8), Glasgow (n = 2), London (n = 16), Huddersfield (n = 3), Leeds (n = 1), Manchester (n = 21), Newcastle (n = 2), Nottingham (n = 4), Birmingham (n = 3), Southampton (n = 5), and Tampere, Finland (n = 7). These women did not differ from the IBIS-I case subjects who were not selected for this case–control study with respect to demographic factors or tumor characteristics (data not shown).
Mammographic density was assessed visually by one radiologist (R. M. L. Warren) who viewed the mammograms on an X-ray film illuminator [Kenex (Electro-Medical) Limited, Harlow, UK] and visually estimated the proportion of the total breast area that was composed of dense tissue (to the nearest 5%). Original films were used for the assessments, with the exception of those for Finnish women, for whom only copies of the original films were available. Baseline films were taken at or up to 12 months before randomization, and follow-up films were taken at least 12 months after randomization; the median time between randomization and first follow-up mammogram was 18 months (interquartile range = 16–19 months), and the median time between baseline mammogram and the first follow-up mammogram was 19 months (interquartile range = 18–23 months). The assessment of mammographic density for both case subjects and control subjects was based on a composite assessment of both the left and right mediolateral-oblique views, except for the 13 case subjects who were diagnosed at the first follow-up mammogram; those assessments were made using only the film for the contralateral breast.
Mammograms were read sequentially, in date order, with the reader blinded to the women’s treatment group and risk factors. Because the majority of the mammograms for case subjects were retrieved and read subsequent to those of the control subjects, the reader was not blinded to case status.
To assess the reproducibility of the density readings, we scanned all of the mammograms so they could be reread by the original reader (R. M. L. Warren) and by other readers. The scanned images were analyzed with the use of a computer-assisted approach [Cumulus 3.0 software ( 16 )]; Martin Yaffe, Sunnybrook Health Sciences Centre, Toronto, Canada.
Statistical Analysis
We used univariate and multivariable logistic regression analyses to examine associations between change in mammographic density and the risk of breast cancer overall, and in the tamoxifen and placebo arms of the study. Change in mammographic density between the baseline mammogram and the 12-month mammogram was categorized into four levels (increase, no change, 5% absolute reduction, or absolute reduction ≥10%) and as a binary variable (absolute reduction ≥10% or absolute reduction <10%). We chose the 5% cut point because density was measured in 5% increments. The 10% cut point was chosen because it was the minimum change that could be reproducibly detected. We also calculated the odds ratios (ORs) for the risk of developing breast cancer in the tamoxifen arm as a whole and in specific subgroups, using the placebo arm as the reference. Subjects in the tamoxifen arm with a density reduction of less than 10% and those with a density reduction of at least 10% were compared separately with the placebo arm (as a whole). Control subjects were not individually matched to case subjects; however, analyses were adjusted for age and mammographic density at entry to IBIS-I, body mass index (as a continuous variable), and history of atypical hyperplasia or lobular carcinoma in situ (LCIS), as appropriate. All tests of statistical significance were two-sided, and a P value less than or equal to .05 was considered statistically significant.
Results
Baseline Characteristics
Baseline characteristics for the 123 case subjects and 942 control subjects, overall and by treatment group, are presented in Table 1 . All characteristics were well balanced between treatment groups; however, as expected, the distributions differed between case subjects and control subjects. In univariate analyses, aside from history of atypical hyperplasia or LCIS, mammographic breast density was the single most important baseline factor for predicting risk ( Ptrend = .008). Mean mammographic breast density at entry to IBIS-I was 51% in case subjects and 44% in control subjects ( P = .02). The association between mammographic breast density at entry to IBIS-I and risk of developing breast cancer was most clearly seen in the placebo arm ( Ptrend = .007), in which the mean mammographic density at entry was 53% in case subjects and 44% in control subjects ( P = .01). The association between mammographic breast density at entry to IBIS-I and risk of developing breast cancer was not statistically significant for women allocated to tamoxifen ( Ptrend = .39), for whom the mean mammographic density at entry was 47% in case subjects and 44% in control subjects ( P = .50). However, a test for interaction between baseline mammographic breast density and treatment was not statistically significant ( P = .8). The predictive value of baseline breast density increased when the logistic regression analysis was adjusted for body mass index and the presence of atypical hyperplasia or LCIS ( Ptrend = .005) ( Table 1 ). For example, in the study as a whole, the odds ratio for the risk of developing breast cancer that was associated with the highest breast density category (76%–100%) increased from 2.83 in the univariate analysis to 3.43 in the multivariable analysis. Both the univariate and multivariable analyses suggest that having a history of atypical hyperplasia or LCIS was associated with a considerably increased risk of developing breast cancer.
Odds ratios (ORs) for the risk of developing breast cancer from univariate and multivariable logistic regression models *
| All subjects | Tamoxifen group | Placebo group | ||||||||||
| Variable | Case subjects (N = 123) | Control subjects (N = 942) | Univariate OR † (95% CI) | Multivariable OR ‡ (95% CI) | Case subjects (N = 51) | Control subjects (N = 456) | Univariate OR † (95% CI) | Multivariable OR ‡ (95% CI) | Case subjects (N = 72) | Control subjects (N = 486) | Univariate OR † (95% CI) | Multivariable OR ‡ (95% CI) |
| Age in y, No. (%) | ||||||||||||
| <45 | 21 (17) | 212 (22) | 1.00 (referent) | — | 6 (12) | 109 (24) | 1.00 (referent) | — | 15 (21) | 103 (21) | 1.00 (referent) | — |
| 45–49 | 45 (36) | 340 (36) | 1.34 (0.77 to 2.31) | — | 20 (39) | 160 (35) | 2.27 (0.89 to 5.84) | — | 25 (35) | 180 (37) | 0.95 (0.48 to 1.89) | — |
| 50–54 | 28 (23) | 214 (23) | 1.32 (0.73 to 2.40) | — | 14 (27) | 105 (23) | 2.42 (0.90 to 6.54) | — | 14 (19) | 109 (22) | 0.88 (0.41 to 1.92) | — |
| 55–59 | 17 (14) | 93 (10) | 1.85 (0.93 to 3.66) | — | 5 (10) | 40 (9) | 2.27 (0.66 to 7.85) | — | 12 (17) | 53 (11) | 1.55 (0.68 to 3.56) | — |
| ≥60 | 12 (10) | 83 (9) | 1.46 (0.69 to 3.10) | — | 6 (12) | 42 (9) | 2.60 (0.79 to 8.50) | — | 6 (8) | 41 (9) | 1.00 (0.36 to 2.77) | — |
| Ptrend | .16 | .14 | .57 | |||||||||
| Mean (SD) | 51(6) | 51 (6) | 52 (6) | 51 (6) | 51 (6) | 51 (6) | ||||||
| P§ | .21 | .23 | .53 | |||||||||
| Median (IQR) | 50 (9) | 50 (46–54) | 51 (48–54) | 50 (46–42) | 50 (46–56) | 49 (46–-54) | ||||||
| P‖ | .19 | .19 | .53 | |||||||||
| % breast density at baseline, No. (%) | ||||||||||||
| 0 | 8 (7) | 106 (11) | 1.00 (referent) | 1.00 (referent) | 5 (10) | 53 (12) | 1.00 (referent) | — | 3 (4) | 53 (11) | 1.00 (referent) | 1.00 (referent) |
| 1–10 | 10 (8) | 93 (10) | 1.47 (0.56 to 3.89) | 1.50 (0.57 to 3.99) | 5 (10) | 40 (9) | 1.35 (0.36 to 4.99) | — | 5 (7) | 53 (11) | 1.74 (0.39 to 7.66) | 1.64 (0.37 to 7.36) |
| 11–25 | 17 (14) | 116 (12) | 2.01 (0.83 to 4.86) | 2.11 (0.87 to 5.14) | 7 (14) | 55 (12) | 1.41 (0.42 to 4.74) | — | 10 (14) | 61 (13) | 2.98 (0.78 to 11.42) | 3.35 (0.86 to 13.04) |
| 26–50 | 23 (19) | 225 (24) | 1.43 (0.62 to 3.31) | 1.36 (0.57 to 3.24) | 10 (20) | 116 (25) | 0.95 (0.31 to 2.91) | — | 13 (18) | 109 (22) | 2.26 (0.61 to 8.30) | 2.48 (0.66 to 9.25) |
| 51–75 | 30 (24) | 214 (23) | 2.09 (0.92 to 4.78) | 2.26 (0.97 to 5.28) | 11 (21) | 103 (23) | 1.31 (0.42 to 4.06) | — | 19 (26) | 111 (23) | 3.34 (0.93 to 11.92) | 3.58 (0.97 to 13.18) |
| 76–100 | 35 (28) | 188 (20) | 2.83 (1.25 to 6.43) | 3.43 (1.43 to 8.19) | 13 (25) | 89 (19) | 1.81 (0.59 to 5.50) | — | 22 (31) | 99 (20) | 4.44 (1.25 to 15.80) | 5.29 (1.41 to 19.83) |
| Ptrend | .008 | .005 | .39 | .007 | .004 | |||||||
| Mean (SD) | 51 (31) | 44 (30) | 47 (32) | 44 (30) | 53 (30) | 44 (30) | ||||||
| P§ | .02 | .50 | .01 | |||||||||
| Median (IQR) | 55 (20–80) | 40 (15–70) | 45 (20–80) | 40 (17–70) | 63 (25–80) | 43 (15–70) | ||||||
| P‖ | .01 | .50 | .01 | |||||||||
| Body mass index in kg/m 2 , No. (%) | ||||||||||||
| ≤23 | 20 (16) | 224 (24) | 1.00 (referent) | 1.00 (referent) | 11 (22) | 114 (25) | 1.00 (referent) | — | 9 (13) | 110 (23) | 1.00 (referent) | 1.00 (referent) |
| 24–25 | 26 (21) | 186 (20) | 1.53 (0.83 to 2.84) | 1.81 (0.96 to 3.43) | 9 (18) | 89 (20) | 1.02 (0.40 to 2.57) | — | 17 (24) | 97 (20) | 2.12 (0.90 to 4.99) | 2.54 (1.03 to 6.29) |
| 26–30 | 47 (38) | 308 (33) | 1.65 (0.95 to 2.87) | 2.42 (1.33 to 4.41) | 15 (29) | 137 (30) | 1.07 (0.47 to 2.43) | — | 32 (44) | 171 (35) | 2.25 (1.03 to 4.93) | 3.69 (1.57 to 8.70) |
| ≥30 | 27 (22) | 211 (22) | 1.40 (0.76 to 2.58) | 2.35 (1.20 to 4.61) | 13 (25) | 109 (24) | 1.19 (0.51 to 2.78) | — | 14 (19) | 102 (21) | 1.67 (0.69 to 4.02) | 3.27 (1.23 to 8.67) |
| Unknown | 3 (3) | 13 (1) | — | — | 3 (6) | 7 (1) | — | — | 0 (0) | 6 (1) | — | — |
| Ptrend | .37 | .007 | .68 | .26 | .03 | |||||||
| Mean (SD) | 27 (5) | 27 (5) | 27 (5) | 27 (5) | 27 (5) | 27 (5) | ||||||
| P§ | .35 | .48 | .52 | |||||||||
| Median (IQR) | 26 (24–29) | 26 (23–29) | 26 (24–31) | 26 (23–30) | 26 (24–28) | 26 (23–29) | ||||||
| P‖ | .40 | .50 | .64 | |||||||||
| Atypical hyperplasia or LCIS, No. (%) | ||||||||||||
| No | 112 (91) | 925 (98) | 1.00 (referent) | 1.00 (referent) | 48 (94) | 448 (98) | 1.00 (referent) | 1.00 (referent) | 64 (89) | 477 (98) | 1.00 (referent) | 1.00 (referent) |
| Yes | 11 (9) | 17 (2) | 5.38 (2.45 to 11.79) | 4.93 (2.18 to 11.18) | 3 (6) | 8 (2) | 3.35 (0.85 to 13.12) | 3.35 (0.85 to 13.12) | 8 (11) | 9 (2) | 6.82 (2.53 to 18.36) | 9.09 (2.82 to 29.27) |
| P¶ | <.001 | <.001 | .08 | .08 | <.001 | <.001 | ||||||
| Use of hormone replacement therapy during study, No. (%) | ||||||||||||
| Never | 73 (59) | 614 (65) | 1.00 (referent) | — | 27 (53) | 398 (65) | 1.00 (referent) | — | 46 (64) | 316 (65) | 1.00 (referent) | — |
| Previous | 22 (18) | 125 (13) | 1.40 (0.82 to 2.37) | — | 10 (20) | 63 (14) | 1.61 (0.72 to 3.60) | — | 12 (17) | 62 (13) | 1.28 (0.63 to 2.58) | — |
| Current | 28 (23) | 203 (22) | 1.12 (0.70 to 1.79) | — | 14 (27) | 95 (21) | 1.55 (0.78 to 3.11) | — | 14 (19) | 108 (22) | 0.87 (0.45 to 1.65) | — |
| Ptrend | .47 | .34 | .67 | |||||||||
All P values are two-sided. — = not applicable; CI = confidence interval; IQR = interquartile range; LCIS = lobular carcinoma in situ.
All odds ratios except those for age adjusted by age at trial entry.
Adjusted by age at entry and all other variables retained in this column. All other variables were considered for inclusion in the multivariable model but were not retained in the final model unless statistically significant.
Two-sample t test.
Wilcoxon rank sum test.
Test of individual regression coefficients.
When no adjustment was made for baseline characteristics, the reduction in breast cancer risk associated with tamoxifen treatment that we observed in this case–control study was 25% (OR = 0.75, 95% CI = 0.51 to 1.10, P = .14). The magnitude of the risk reduction is consistent with the IBIS-I study as a whole ( 15 ), which found, after 96 months of follow-up, a 27% reduction in breast cancer risk with tamoxifen (OR = 0.73, 95% CI = 0.58 to 0.91, P = .004); however, the reduction in risk in this study was not statistically significant, perhaps owing to the far smaller study size.
Change in Breast Density
Table 2 shows how mammographic breast density changed between the baseline mammogram and the first follow-up mammogram in case and control subjects. Compared with control subjects, case subjects were more likely to have high mammographic breast density (ie, density >50%) at the baseline mammogram (53% of case subjects vs 46% of control subjects) and less likely to experience a reduction in mammographic density during the first 12–18 months of the study that was large enough to move them to a lower density category (20% of case subjects vs 25% of control subjects).
Numbers of case and control subjects in each density category at the baseline mammogram and at the first follow-up mammograms (after 12–18 months on study) *
| Density category at baseline (%) | Density category at first follow-up (%) | |||||
| 0–10 | 11–25 | 26–50 | 51–75 | 75–100 | Total | |
| Case subjects | ||||||
| 0–10 | 17 (9/8) | 1 (1/0) | 0 | 0 | 0 | 18 (10/8) |
| 11–25 | 4 (1/3) | 11 (5/6) | 2 (1/1) | 0 | 0 | 17 (7/10) |
| 26–50 | 1 (0/1) | 6 (5/1) | 16 (5/11) | 0 | 0 | 23 (10/13) |
| 51–75 | 0 | 0 | 8 (4/4) | 22 (7/15) | 0 | 30 (11/19) |
| 76–100 | 0 | 0 | 0 | 6 (5/1) | 29 (8/21) | 35 (13/22) |
| Total | 22 (10/12) | 18 (11/7) | 26 (10/16) | 28 (12/16) | 29 (8/21) | 123 (51/72) |
| Control subjects | ||||||
| 0–10 | 193 (93/100) | 6 (0/6) | 0 | 0 | 0 | 199 (93/106) |
| 11–25 | 34 (20/14) | 72 (33/39) | 10 (2/8) | 0 | 0 | 116 (55/61) |
| 26–50 | 8 (6/2) | 58 (36/22) | 155 (73/82) | 3 (0/3) | 1 (1/0) | 225 (116/109) |
| 51–75 | 0 | 3 (2/1) | 67 (43/24) | 139 (57/82) | 5 (1/4) | 214 (103/111) |
| 76–100 | 0 | 0 | 3 (3/0) | 66 (36/30) | 119 (50/69) | 188 (89/99) |
| Total | 235 (119/116) | 139 (71/68) | 235 (121/114) | 208 (93/115) | 125 (52/73) | 942 (456/486) |
The first number in each cell is the total number of subjects. Numbers in parentheses are the tamoxifen and placebo groups, respectively.
Table 3 presents the odds ratios for risk of breast cancer in each category of density change. The magnitude of the change in breast density was highly dependent on the treatment group and greatest in the control subjects who received tamoxifen. For example, among control subjects in the tamoxifen group, the mean reduction in mammographic breast density was 8.2%, and 48% of these women experienced a 10% or greater reduction; among control subjects in the placebo group, the mean density reduction was 3.8% and only 26% of these women experienced a 10% or greater reduction. The difference in mean density reduction between control subjects in the tamoxifen group and control subjects in the placebo group was statistically significant ( P < .001). More importantly, only 29% of the women in the tamoxifen group who developed breast cancer (ie, case subjects) had a 10% or greater reduction in breast density compared with 48% of the control subjects in the tamoxifen group ( P = .01). By contrast, there was no statistically significant association between change in breast density and breast cancer risk in the placebo group ( Ptrend = .51). Compared with all women in the placebo group, women in the tamoxifen group who experienced a 10% or greater reduction in breast density had a relative risk reduction of 63% (OR = 0.37, 95% CI = 0.20 to 0.69, P = .002), whereas those who took tamoxifen but experienced less than a 10% reduction in breast density had no risk reduction (OR = 1.13, 95% CI = 0.72 to 1.77, P = .60) ( Table 4 ).
Odds ratios (ORs) associated with categories of change in breast density in the tamoxifen and placebo arms *
| Change in breast density, No. (%) | Tamoxifen group | Placebo group | ||||
| Case subjects (N = 51) | Control subjects (N = 456) | OR (95% CI) | Case subjects (N = 72) | Control subjects (N = 486) | OR (95% CI) | |
| Increase | 4 (8) | 16 (3) | 2.13 (0.64 to 7.20) | 9 (12) | 57 (12) | 1.23 (0.54 to 2.81) |
| No change | 20 (39) | 141 (31) | 1.00 (referent) | 27 (38) | 206 (42) | 1.00 (referent) |
| Reduction 5% | 12 (24) | 82 (18) | 0.90 (0.40 to 2.04) | 21 (29) | 98 (20) | 1.35 (0.71 to 2.58) |
| Reduction ≥10% | 15 (29) | 217 (48) | 0.32 (0.14 to 0.72) | 15 (21) | 125 (26) | 0.69 (0.34 to1.41) |
| Ptrend | .001 | .51 | ||||
Odds ratios adjusted for age, breast density at baseline, history of atypical hyperplasia or lobular carcinoma in situ, and body mass index. P values are two-sided. CI = confidence interval.
Odds ratios (ORs) for the risk of developing breast cancer for the tamoxifen arm (using the placebo arm as reference) overall and by breast density reduction category in specific subgroups *
| Variable | No. of control subjects/No. of case subjects | Tamoxifen, all | Tamoxifen, breast density reduction <10% | Tamoxifen, breast density reduction ≥10% | ||
| OR (95% CI) † | No. of case subjects | OR (95% CI) ‡ | No. of case subjects | OR (95% CI) § | ||
| Overall ‖ | 929/120 | 0.73 (0.49 to 1.08) | 35 | 1.13 (0.72 to 1.77) | 13 | 0.37 (0.20 to 0.69) |
| Tumor ER status ‖ | ||||||
| Positive | 929/100 | 0.67 (0.43 to 1.03) | 28 | 1.06 (0.65 to 1.73) | 10 | 0.32 (0.16 to 0.65) |
| Negative | 929/19 | 1.22 (0.49 to 3.05) | 7 | 1.67 (0.60 to 4.69) | 3 | 0.76 (0.20 to 2.87) |
| Baseline breast density ¶ | ||||||
| ≤10% | 200/18 | 1.36 (0.51 to 3.66) | 10 | 1.45 (0.54 to 3.88) | 0 | — |
| 11%–50% | 340/37 | 0.55 (0.27 to 1.13) | 11 | 0.97 (0.43 to 2.14) | 3 | 0.21 (0.06 to 0.75) |
| 51%–100% | 389/65 | 0.68 (0.39 to 1.18) | 14 | 1.09 (0.55 to 2.15) | 10 | 0.44 (0.21 to 0.93) |
| Menopausal status ‖ | ||||||
| Premenopausal | 496/58 | 0.59 (0.33 to 1.06) | 14 | 1.18 (0.60 to 2.32) | 6 | 0.27 (0.11 to 0.66) |
| Postmenopausal | 433/62 | 0.87 (0.51 to 1.50) | 21 | 1.10 (0.61 to 2.01) | 7 | 0.53 (0.22 to 1.28) |
| Atypical hyperplasia or LCIS # | ||||||
| No | 912/109 | 0.76 (0.50 to 1.13) | 34 | 1.13 (0.72 to 1.78) | 11 | 0.37 (0.19 to 0.73) |
| Yes | 17/11 | 0.38 (0.07 to 2.21) | 1 | 1.13 (0.05 to 25.21) | 2 | 0.29 (0.04 to 2.03) |
| HRT use ‖ | ||||||
| Never taken | 648/83 | 0.60 (0.37 to 0.98) | 21 | 0.97 (0.55 to 1.71) | 9 | 0.31 (0.15 to 0.67) |
| Ever taken | 281/37 | 1.08 (0.54 to 2.18) | 14 | 1.54 (0.72 to 3.23) | 4 | 0.53 (0.17 to 1.66) |
— = not applicable; CI = confidence interval; ER= estrogen receptor; HRT = hormone replacement therapy; LCIS = lobular carcinoma in situ.
For the tamoxifen arm relative to the placebo arm.
For women in the tamoxifen arm who experienced an absolute reduction in breast density less than 10% relative to the placebo arm (as a whole).
For women in the tamoxifen arm who experienced an absolute reduction in breast density of 10% or more relative to the placebo arm (as a whole).
Adjusted for age and breast density at entry, history of LCIS or atypical hyperplasia, and body mass index.
Adjusted for age at entry, history of LCIS or atypical hyperplasia, and body mass index.
Adjusted for age and breast density at entry and body mass index.
Subgroup Analysis
We conducted subgroup analyses to further explore the 63% reduction in breast cancer risk associated with a 10% or greater reduction in breast density in the tamoxifen arm ( Table 4 ). Overall, tamoxifen was more effective in preventing estrogen receptor–positive breast cancer than it was in preventing estrogen receptor–negative breast cancer and was more effective in women who were premenopausal, had never taken HRT, or who had a previous diagnosis of atypical hyperplasia or LCIS, but there were no statistically significant differences in the odds ratios between the subgroups. Tamoxifen did not reduce the risk of breast cancer in subjects with a baseline breast density of 10% or less, but did reduce the risk of developing breast cancer considerably in subjects with baseline breast densities greater than 10%. The relative reduction in risk was slightly smaller in subjects with a baseline breast density greater than 50% than for those with a baseline breast density of 11%–50%, but the difference in odd ratios between these groups was not statistically significant.
Tamoxifen was found to be particularly effective in reducing the risk of breast cancer in women with a history of atypical hyperplasia or LCIS ( 13 ). Thus, the relationship between this lesion and mammographic breast density is of considerable interest. Mean breast density at baseline among women with atypical hyperplasia or LCIS at baseline was 70% compared with 44% in women without these lesions at baseline ( P < .001), and the mean reduction in breast density was also greater (9.64% vs 5.66%, P = .02). The mean breast density reduction was 8.53% for women with atypical hyperplasia or LCIS at baseline in the placebo group and 11.36% for equivalent women in the tamoxifen group, but the difference was not statistically significant ( P = .4).
A reduction in breast cancer risk associated with tamoxifen was seen in all subgroups of tamoxifen subjects who experienced a density reduction of at least 10% (and was statistically significant in the majority), but not in tamoxifen subjects who experienced a lesser density reduction.
Potential Impact of Compliance
It is possible that the greater reduction in breast cancer risk we observed in subjects from the tamoxifen arm who experienced a density reduction of 10% or more simply reflected better treatment compliance and is not a measure of biological response to treatment. To test this possibility, we computed the percentage of the potential treatment that was given up to 3 months before diagnosis in all of the case subjects. The analogous computation could not be done for the control subjects because they were selected because of their complete compliance over the 5 years of treatment. Among case subjects in the tamoxifen arm, those with a 10% or greater reduction in breast density had slightly poorer compliance on average compared with those with lesser reductions (84% vs 90%, respectively), but the difference was not statistically significant ( P = .47). Case subjects in the placebo arm had better compliance on average than case subjects in the tamoxifen arm (96% vs 88%, P = .02). We also examined Kaplan–Meier curves of time to stopping treatment in case subjects, censored 3 months before cancer diagnosis, and again found a statistically significant difference between the treatment arms ( P = .02), but no statistically significant difference between subjects in the tamoxifen arm who experienced a reduction in mammographic density of less than 10% and subjects in the tamoxifen arm who experienced a greater reduction ( P = .25) (data not shown). Thus, the lower incidence rate in those with larger density reductions was not due to better compliance.
Impact of HRT
We previously found that women who were taking HRT during the IBIS-I study did not experience a reduction in breast cancer risk with tamoxifen ( 15 ). Therefore, in this study, we examined whether this finding might be related to changes in mammographic density. Overall, the mean reduction in breast density was 6.0% (95% CI = 5.3% to 6.6%) for women who had never taken HRT, 6.1% (95% CI = 4.5% to 7.7%) for those who had taken HRT only before entry into the study, and 4.9% (95% CI = 3.7% to 6.1%) for those who started taking HRT during the study, but before the first repeat mammogram. In the placebo arm, the corresponding mean reductions in breast density were 3.6% (95% CI = 2.8% to 4.4%), 5.2% (95% CI = 2.9% to 7.5%), and 3.4% (95% CI = 1.9% to 5.0%), respectively; in the tamoxifen arm, the mean reductions were substantially greater at 8.6% (95% CI = 7.6% to 9.7%), 7.1% (95% CI = 4.8% to 9.3%), and 6.6% (95% CI = 4.7% to 8.5%), respectively. After adjusting for age and breast density at IBIS-I entry, body mass index at IBIS-I entry, age at menarche, menopausal status at entry to IBIS-I, smoking, family history, benign breast disease (atypical hyperplasia or LCIS), and treatment arm, the mean reduction in breast density was smaller in women who started HRT during the study compared with those who had never taken HRT (4.3% vs 6.3%), mean difference in breast density reduction = 2.02%, 95% CI = 0.02% to 3.83%, P = .03. However, adjusting for HRT use had no material impact on the estimate of risk reduction associated with a reduction in breast density (data not shown).
Impact of Length of Time Between the Baseline and Follow-up Mammograms on Change in Breast Density
To assess whether variations in the length of time between the baseline and follow-up mammograms could have influenced our results, we adjusted for this factor in additional regression analyses. The length of time between the baseline and the follow-up mammograms was not statistically significant in any of the models (ie, there was no association with breast cancer risk), and adjustment for the length of time between mammograms did not substantially change the reported risk estimates. In addition, there was no statistically significant difference between case and control subjects in the median length of time between the baseline and follow-up mammograms ( P = .62, two-sample Wilcoxon rank-sum test).
Reproducibility of Density Readings
The reproducibility of the mammographic density readings was initially assessed by having the scanned images relating to all subjects reread using interactive thresholding software (Cumulus). Unfortunately, the quality of the scans was substandard (eg, the well-established positive association between increasing density and increasing breast cancer risk was not seen in the computer-assisted assessments) and neither visual nor computer-assisted assessments (by R. M. L. Warren, the original reader) reproduced the visual readings of the original films. Although it was not possible to reread a large number of the original mammograms because the majority of the films had been destroyed, we were able to recover the original films for 48 women (40 control subjects and eight case subjects) from two UK centers. The films for each woman were reread, baseline mammogram first and then the follow-up, by R. M. L. Warren and four other readers (J. Warwick, E. Pinney, Iqbal Warsi [no current affiliation], and Prue Allgood [Centre for Cancer Prevention, Wolfson Institute of Preventive Medicine, Queen Mary University of London]), all of whom were completely blinded to as to treatment arm. The rereading took place 10 years after the initial reading. For the original reader (R. M. L. Warren), the correlation between the original and repeat mammographic breast density assessment readings was very high: the Pearson correlation coefficient for the baseline mammograms was 0.98 (95% CI = 0.96 to 0.99), for the follow-up mammograms was 0.97 (95% CI = 0.97 to 0.99), and for the density change over 12–18 months was 0.78 (95% CI = 0.63 to 0.87) ( Figure 1 ). The correlation between the original mammographic breast density assessment by R. M. L. Warren and the subsequent mammographic breast density assessments by the other four readers was also very high for the baseline mammograms ( r ranged from 0.86 to 0.90) and for the follow-up mammograms ( r ranged from 0.87 to 0.91) but was only moderate for breast density change over 12–18 months ( r ranged from 0.48 to 0.67).
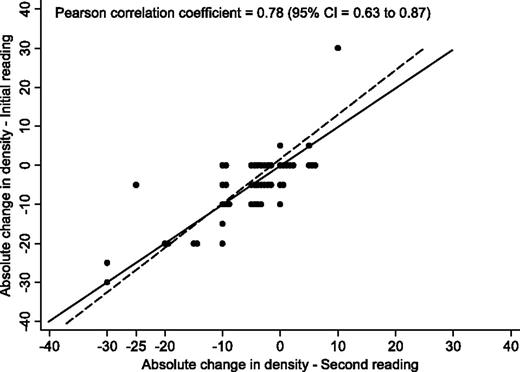
Reproducibility of visual film measurements of change in breast density when films were rescored 10 years later by the same reader (n = 48). Circles represent individual points, and identical values are separated on the x -axis. The solid line represents perfect concordance and the dashed line represents the best linear fit. CI = confidence interval.
Discussion
In this study, we found that, compared with all subjects in the placebo group, subjects in the tamoxifen arm who experienced a reduction in mammographic density of at least 10% had a 63% reduction in breast cancer risk, whereas subjects who took tamoxifen but experienced less than 10% reduction in mammographic density had no risk reduction. This finding suggests that the impact of tamoxifen on breast cancer risk reduction is largely predictable by the reduction it induces in breast density after 12–18 months of treatment, and that a reduction in mammographic breast density indicates a woman who will benefit from tamoxifen and, thus, should continue taking it. From the observed absolute 10-year risk of developing breast cancer in the placebo arm of the main study of 6.4% ( 15 ) and the observed 63% relative reduction in risk in women who had a 10% or greater reduction in breast density with tamoxifen, we estimate that for women with a 10% or greater reduction in breast density with tamoxifen, the10-year absolute risk of developing breast cancer is 2.4% (ie, the absolute reduction is 4%). These results also suggest that women who have little or no reduction in breast density while taking tamoxifen do not benefit from the treatment and may need to consider alternative risk-reducing strategies [eg, increased physical activity, weight control, or preventive therapy with an aromatase inhibitor, metformin, bisphosphonates, or low-dose aspirin when these have been fully evaluated ( 17 )]. However, this finding—that women who have little or no reduction in breast density after 12–18 months of taking tamoxifen do not benefit from taking it—needs confirmation in a separate study. Our results also suggest that the lesser reduction in breast cancer risk with tamoxifen seen in women taking HRT ( 15 ) is associated with lesser reductions in mammographic breast density. The association between reduction in mammographic breast density and reduction in breast cancer risk does not appear to be due to differential compliance among subjects in the tamoxifen arm because, on average, women who had a 10% or greater reduction in breast density with tamoxifen had a slightly lower compliance compared with those with lesser reductions. However, lower compliance could be a result of treatment-emergent endocrine symptoms, which we found were predictive of greater treatment efficacy in the adjuvant setting in another study ( 18 ) and which have been found to be associated with a reduced risk of breast cancer ( 19 ). Thus, endocrine symptoms and breast density reductions may be independent indicators of treatment efficacy for individual women taking tamoxifen. The interaction between these two factors in determining response to treatment requires further study. The lack of an association between breast density changes and breast cancer development in the placebo arm further supports the validity of our main findings.
Our findings also confirm the importance of mammographic breast density as a risk factor for breast cancer even among women who are at increased risk of breast cancer due to a family history or other known factors. Our findings also confirm the high risk of breast cancer associated with atypical hyperplasia or LCIS, and the particularly strong effect of tamoxifen on risk reduction in these women that was previously observed in the North American P-1 tamoxifen prevention study ( 13 ). However, no interaction between breast density change and other risk factors was seen in this study, suggesting that change in breast density as a marker of tamoxifen efficacy may be broadly applicable. The population attributable risk associated with breast density also emphasizes the need to incorporate it into risk models that contain other factors, as has been initiated by Tice et al. ( 4 , 5 ). However, details of family history and other factors will need to be collected in a large series before existing models can be developed further.
This study has several limitations. First, a major issue regarding the use of breast density in assessing individual breast cancer risk concerns the reproducibility of its measurement. The original reader (R. M. L. Warren) reread a subset of the original films, and there was strong correlation between the original and repeat readings of the baseline and follow-up mammograms and, albeit less strongly, for density change over 12–18 months. Similarly, Gao et al. ( 20 ) found that for visually assessed percent density the correlation coefficient between readers was 0.94 and that within readers (repeated assessments made at different time points) the correlation was 0.96.
Second, the original reader was blinded with regard to treatment allocation (tamoxifen or placebo) but not with regard to case–control status. However, the fully blinded rereading of the original films for 40 control subjects and eight case subjects indicated high reproducibility of the original breast density assessment.
Third, films were obtainable for only approximately 55% of IBIS-I subjects from the United Kingdom and Finland who developed breast cancer. Although the pool from which we were able to select case subjects for this case–control study was more limited than we would have liked, there was no difference between subjects whose films were and were not available in terms of age, body mass index, menopausal status, or HRT use. Thus, the case subjects selected for this study appear to be representative of all UK and Finnish cases. Control subjects were selected from eight major participating centers and were representative of the IBIS-I subjects who did not develop breast cancer.
Fourth, in this study, mammograms were assessed visually without computer aid. The baseline mammograms (left and right mediolateral-oblique views) were placed together on the light box and assessed as one entity. They were then removed and the corresponding follow-up films were read. Although this approach was adequate to detect the degree of change in breast density typically induced by tamoxifen, it remains to be seen if automated computer-based systems or further refinements of the visual method (eg, putting the baseline and follow-up films on the light box at the same time to assess density change directly) can further improve the reliability and reproducibility of density readings and allow the reliable detection of smaller changes.
More broadly, our results raise the possibility that accurate measures of change in breast density may be a useful marker for response to other preventive interventions, such as the use of aromatase inhibitors, increased physical activity, and weight loss. It is also possible that we may be able to predict response to endocrine treatment with both tamoxifen and aromatase inhibitors in the adjuvant setting by examining changes in density in the contralateral breast. However, given evidence that at least some of the effects of tamoxifen are mediated via stromal tissue ( 21 ) and given that breast density also is affected by the amount of stroma, the effects seen here could be specific to tamoxifen.
If breast density can be shown to be a surrogate marker for other preventive interventions, analogous to the role of LDL cholesterol for predicting baseline risk and effectiveness of treatment in cardiovascular disease, progress in breast cancer prevention could be accelerated. This would be particularly useful for breast cancer prevention trials of lifestyle modifications, where there are formidable challenges in terms of cost, complexity, and follow-up duration. The wider validation of mammographic breast density as a marker of breast cancer risk should be a high priority for the field of breast cancer prevention.
Funding
Cancer Research UK program grant (C569/A10404 to J.C.) for research on the prevention of hormonally related cancers.
References
We wish to thank the IBIS investigators and local staff at participating centers for their time and assistance in obtaining the mammograms for this study. J. Cuzick designed the study, interpreted results, and drafted the article; J. Warwick analyzed data, interpreted results, and drafted the article; E. Pinney acquired and recorded data, classified mammograms, interpreted results, and drafted the article; R. M. L. Warren designed the study, classified mammograms, interpreted results, and reviewed the article; S. W. Duffy interpreted results and drafted the article; S. Cawthorn conducted the study, interpreted results, and reviewed the article; A. Howell conducted the study, interpreted results, and reviewed the article; and J. F. Forbes interpreted results and reviewed the article. J. Cuzick and A. Howell have served as occasional consultants to and advisory board members for AstraZeneca, the maker of tamoxifen. J. F. Forbes received honorarium payments for educational lectures from Astra Zeneca. J. Cuzick is the principal investigator for trials for which his institution (Queen Mary University of London) receives funding from AstraZeneca. The study sponsor had no role in the study design, collection of the data, interpretation of the results, preparation of the manuscript, or the decision to submit the manuscript for publication.

