


Abstract
In considering the best possible solutions for answering phylogenetic questions from genomic sequences, we have chosen a strategy that we suggest is superior to others that have gone previously. We have ignored multigene families and instead have used single-gene families. This minimizes the inadvertent analysis of paralogs. We have employed strict data controls and have reasoned that if a protein is not capable of recovering the uncontroversial parts of a phylogenetic tree, then why should we use it for the more controversial parts? We have sliced and diced the data in as many ways as possible in order to uncover the signals in that data. Using this strategy, we have tested two controversial hypotheses concerning eukaryotic phylogenetic relationships: the placement of arthropoda and nematodes and the relationships of animals, plants, and fungi. We have constructed phylogenetic trees from 780 single-gene families from 10 completed genomes and amalgamated these into a single supertree. We have also carried out a total evidence analysis on the only universally distributed protein families that can accurately reconstruct the uncontroversial parts of the phylogenetic tree: a total of five families. In doing so, we ignore the majority of single-gene families that are universally distributed as they do not have the appropriate signals to recover the uncontroversial parts of the tree. We have also ignored every protein that has ever been used previously to address this issue, simply because none of them meet our strict criteria. Using these data controls, site stripping, and multiple analyses, 24 out of 26 analyses strongly support the grouping of vertebrates with arthropods (Coelomata hypothesis) and plants with animals. In the other two analyses, the data were ambivalent. The latter finding overturns an 11-year theory of Eukaryotic evolution; the first confirms what has already been said by others. In the light of this new tree, we reanalyze the evolution of intron gain and loss in the rpL14 gene and find that it is much more compatible with the hypothesis presented here than with the Opisthokonta hypothesis.
Introduction
The Coelomata hypothesis argues that vertebrates and arthropods are more closely related to each other than either is to nematodes because they have a true body cavity. However, (Aguinaldo et al. 1997) analyzed the nuclear 18S small subunit (SSU) rRNA sequences of various animals, including a slowly evolving nematode, Trichinella, and hypothesized that the true position of nematodes was as a sister group of arthropods and that previous studies artificially positioned the nematodes at the bottom of the tree due to the long-branch attraction artifact. They therefore suggested the presence of a molting clade, the Ecdysozoa, named after ecdysis, although curiously, the molting cuticles are chitin in arthropods and collagen in nematodes and are therefore not homologous (Adoutte et al. 2000). Additionally, studies using alternative molecular markers, including the large subunit rRNA gene (Mallatt and Winchell 2002), Hox genes (de Rosa et al. 1999), β-thymosins, (Manuel et al. 2000), combined SSU rRNA with morphological characters (Glenner et al. 2004), and studies using greater taxonomic sampling (Giribet and Ribera 1998; Giribet et al. 2000; Peterson and Eernisse 2001) have all supported the molting clade.
In contrast, phylogenetic analyses of 42 quartets of candidate orthologs found support for the Coelomata hypothesis (Mushegian et al. 1998). Wang et al. (Wang, Kumar, and Hedges 1999) concatenated 18 genes and found that Coelomata was significantly better than either alternative hypothesis, while Blair et al. (Blair et al. 2002) assembled and analyzed 100 nuclear proteins and concluded that Ecdysozoa may have been the result of a rate bias, compositional bias, or other artifact. Furthermore, analyses that only used Trichinella also failed to support the Ecdysozoa hypothesis. Most recently, Wolf, Rogozin, and Koonin (2004) analyzed 507 eukaryotic orthologous groups (KOGs) of proteins and again found support for the Coelomata hypothesis, while their gene content and multidomain protein composition data results were also more compatible with the same topology. In addition, a recent study based on presence and absence data for more than 3,000 genes also proclaimed the Ecdysozoa hypothesis to be “unequivocally rejected” (Dopazo, Santoyo, and Dopazo 2004). However, Copley et al. (Copley et al. 2004) found slightly higher support for the Ecdysozoa, following a procedure that corrected for the systematic high rate of character loss in the nematode.
Another major debate concerns the relationships of three eukaryotic Kingdoms (Animalia, Plantae, and Fungi) to each other. An analysis of both the large subunit (LSU) and SSU rRNAs, 10 isoacceptor transfer RNA families, and six highly conserved proteins supported this hypothesis and found that plants and animals are sibling kingdoms (Gouy and Li 1989). Analysis of gene content of KOGs, as well as analysis of domain architectures of multidomain proteins, also supported the animal-plant grouping (Wolf, Rogozin, and Koonin 2004). More recently, a study of the presence or absence of superfamily folds in the Structural Classification of Proteins (SCOP) database found strong bootstrap support for an animal-plant clade (Yang, Doolittle, and Bourne 2005). Baldauf and Palmer (1993), in contrast, found an insertion of 12 amino acids in an otherwise highly conserved region of the elongation factor 1-α (EF–1α) protein. This sequence was found in all animal and fungal EF–1α proteins at that time but not in any other organism. They argued that the simplest interpretation of this gap was a single-insertion event in a common ancestor shared solely by animals and fungi. Therefore, a clade, named the Opisthokonta, was constructed (Cavalier-Smith 1998) reflecting their shared mitochondrial and flagellar characters and this molecular synapomorphy. Subsequent work suggested that although this putative insertion is conserved in position and is strikingly conserved among fungi, it varies extensively in both length and sequence (Baldauf 1999). It has subsequently been shown that it varies so extensively in length that it is completely missing in some platyhelminths (Littlewood et al. 2001). In addition, this protein family is present in multiple copies in most genomes (at least five highly divergent copies in yeast and nine highly divergent copies in human, on chromosomes 5, 6, 9, 16, 20, and X) and in the case of the acoel flatworms, an analysis of putative EF-1α proteins is incapable of producing a monophyletic group (Littlewood et al. 2001), thereby calling into question the suitability of this protein for reconstructing phylogenetic relationships.
Additionally, trees constructed for four protein-encoding genes showed varying levels of support for the animal-fungal clade: 100% for α-tubulin, 85% for β-tubulin, 53% for EF–1α, and only 28% for actin (Baldauf and Palmer 1993). The deduced amino acid sequences of these four proteins were combined and were found to favor the Opisthokonta (Baldauf et al. 2000). According to the ENSEMBL database, there are at least 23 paralogous members of the α-tubulin family in the human genome alone with similarity levels ranging from 97% identity to 42% identity, making the identification of true orthologs in such a massively paralogous family difficult.
Independent reconstruction of the phylogenies of α- and β-tubulins, once again, lent support for an animal-fungal clade (Keeling and Doolittle 1996), as did the phylogeny of enolase, although this protein has a history of duplication, loss, and horizontal transfer (Hannaert et al. 2000). Also, nuclear SSU rRNA analyses supported the animal-fungal clade (Kumar and Rzhetsky 1996) as did an analysis of 23 protein families (Nikoh et al. 1994) and a separate analysis of 11 concatenated well-conserved mtDNA proteins (Lang et al. 2002).
Another approach has been to indirectly support the Opisthokonta by excluding the possibility that a root occurred between the animals and fungi, using a supposedly derived gene fusion between dihydrofolate (DHFR) and thymidylate synthase (TS). This was because animals and fungi have separately translated DHFR and TS genes, whereas plants and other protists have a bifunctional fusion gene with both enzyme activities contained within a single protein (Stechmann and Cavalier-Smith 2002). However, the TS gene is frequently replaced by a nonhomologous TS gene in a wide variety of bacteria (Myllykallio et al. 2002), and many bacteria (including Escherichia coli and Vibrio parahemolyticus) have DHFR and TS genes that are not found in operons but are transcribed and translated separately, just like in animals and fungi. Furthermore, when these two genes are found together in an operon (cf. the situation in Bradyrhizobium, for instance), they are in a different orientation to the fused protein in some eukaryotes. In the Methanosarcinales there is only a recognizable TS gene and no detectable DHFR gene. Protein fusion and fission are frequent events in evolution (Suhre and Claverie 2004), and within the carbamoyl phosphate synthase B gene, there have been multiple independent fusions and multiple independent fissions (Snel, Bork, and Huynen 2000). So the evolutionary history of this pair of proteins is that they are sometimes found together in the same operon, producing a single polycistronic mRNA and two separate proteins, they are sometimes found in separate locations in the genome, transcribed and translated separately, they are sometimes found fused together in a different order to that in which they are found in bacterial genomes, frequently the TS gene is replaced by a nonhomologous alternative, and sometimes the DHFR gene is not present. Therefore, if animals and fungi are monophyletic, then this is at least the fourth time during evolution when the DHFR and TS genes have been physically separated in a genome. If they are not monophyletic, then it is the fifth time. Therefore, we would caution that when rare genomic events are being used to infer evolutionary events, these events should indeed be rare and should be found in genes where fusion, fission, and rearrangement does not occur so frequently.
Support for the third alternative hypothesis has also been reported (Loytynoja and Milinkovitch 2001), where support for a plant-fungal clade was found from analyses of sequences from the adenosine 5′ diphosphate–adenosine triphosphate mitochondrial carrier.
All studies of the plant-animal-fungal relationships so far have depended on at most 23 proteins, and all three topologies have been recovered. We have collected individual phylogenetic trees from 780 different ortholog families and analyzed the data in both a taxonomic congruence and total evidence approach. We have employed phylogenetic controls for these data—in other words, we discriminate against proteins that are unlikely to be capable of providing sound evidence of relationships. We suppose that if a protein family is not capable of identifying uncontroversial monophyletic groups such as Mammalia, Vertebrata, Arthropoda, Animalia, or Fungi, then we do not consider that protein to be worthy of carrying forward for further analysis. This approach is in contrast with the approach of Baldauf (1999), where a combined data set was used to infer relationships between the major groups. Surprisingly, then Baldauf cautions against paying too much attention to the relationships within the animals and the angiosperms because “each has complex multigene families for all these proteins except, perhaps, EF-1α” (p. S184). We now know that EF-1α also is present in multiple copies in many genomes and that these copies can be functional and very divergent (Danforth and Ji 1998; Hedin and Maddison 2001). Also, the EF-1α protein can provide very strong support for relationships (Kamaishi et al. 1996a, 1996b) that have since been shown to be artifactual (Hirt et al. 1999). Therefore, all those observations are made with proteins that have a very complex history of duplication and loss and have been known to have produced artifactual phylogenies.
Even if ortholog selection among multigene families was perfect, data concatenation may not necessarily be the best way to proceed. As has been pointed out recently, while data concatenation has the effect of reducing sampling effects, they are still not capable of stating whether or not the trees are correct. In fact, there is a great danger in concatenating data together, as this results in higher bootstrap values generally, although these bootstrap values are only meaningful if the model used to analyze the data is the same as the model that generated the data (Phillips, Delsuc, and Penny 2004). Bootstrapping is only a method of assessing sampling effects and is a measure of the likelihood that we would find a particular internal branch if we had much longer sequences with the same signal and we analyzed them in the same way (this signal could be either phylogenetic or misleading).
In this study, because we have the luxury of being in the possession of completed genome sequences therefore, we have used only single-gene families where it is much more likely that gene duplication is unsuccessful and therefore, hidden paralogy is minimized. This has meant that all proteins that have been used in the past have been excluded from our analyses due to the fact that there are paralogs of these genes present in the data. We have used the largest ever data set for this purpose, and we have examined the behavior of data sets when the most rapidly evolving sites are removed. We have analyzed the data using supertree methods, consensus methods, and using a total evidence approach.
We prefer trees that are recovered using a variety of different data sets, using a variety of different methods of analysis, and a variety of different conceptual approaches and sampling strategies. We find the same tree being supported in 24 of our 26 analyses, with any alternatives being rarely recovered.
Methods
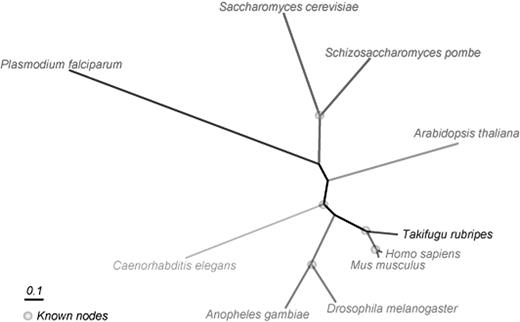
Ten protein-coding components of completed eukaryote genomes were obtained including Homo sapiens, Takifugu rubripes, Mus musculus, Anopheles gambiae, Drosophila melanogaster, Schizosaccharomyces pombe (all obtained from www.ensembl.org), Arabidopsis thaliana (www.genome.wustl.edu/projects/athaliana/), Caenorhabditis elegans (wormbase.org), Saccharomyces cerevisiae (www.yeastgenome.org) and Plasmodium falciparum (PlasmoDB.org).
Homologous sequences were identified using the BlastP algorithm (Altschul et al. 1997) with a cutoff E-value of 10−7 by randomly selecting a sequence from the database of complete genomes, finding its homologs, and removing the entire family from the database. Another randomly selected sequence from within the reduced database was then used as the new starting point for the next search. This procedure was iterated until all sequences had been removed from the database. Gene families with more than one representative from any genome were discarded, and those remaining families with a minimum of four sequences were selected for phylogenetic reconstruction. This conservative approach was used to minimize the inadvertent analysis of paralogs. The protein sequences of each of these families were then aligned using ClustalW 1.8 (Thompson, Higgins, and Gibson 1994) using the default settings.
The Bayesian inference and Markov Chain Monte Carlo (MCMC) method implemented in the software program MrBayes (Huelsenbeck and Ronquist 2001) was used to reconstruct the phylogenies of each of the single-gene families. The JTT (Jones, Taylor, and Thornton 1992) model of amino acid substitution was used with four Markov chains for 500,000 generations. In one instance, evolutionary rate variation across sites in the alignments was assumed to follow an invariable-gamma (InvG) model. This model assumes that a proportion of sites are invariable, that is, not free to change, while those that are free to change show a rate variation across the sites that approximately follows a gamma distribution (InvG data set). The resulting trees from both methods were sampled every 100 generations with trees sampled during the first 50,000 generations discarded as burn-in. The relationships among the remaining trees were summarized using a majority-rule consensus method. Pairwise distances were calculated for each alignment using the JTT matrix, implemented in the PROTDIST program of the PHYLIP package (Felsenstein 1993), and phylogenetic hypotheses based upon these distances were inferred using the Neighbor-Joining method (Saitou and Nei 1987).
In order to assess the possibility that the fastest-evolving sites (those most likely to be homoplastic) contributed most to the resulting topology, we systematically removed increasing numbers of amino acid positions according to their estimated rate of evolution. The maximum likelihood method implemented in the program Tree-Puzzle 5.1 (Schmidt et al. 2002) was used to place all sites into one of eight categories according to their estimated evolutionary rate. Five sets of alignments were constructed where the fastest-evolving classes of sites were progressively removed. A sixth set of alignments was constructed where the fastest and slowest classes of sites were removed. For each of these site-stripped data sets, the gene trees were reconstructed as described above.
In an effort to reduce sampling effects in individual alignments and to minimize the usage of genes where hidden paralogy is present, we used gene trees whose underlying alignment was greater than 300 amino acid positions in length and whose phylogeny did not conflict with the most uncontroversial relationships. This controlled data set included only trees that supported the monophyly of the mammals (human and mouse), vertebrates (mammals and Fugu), arthropods (Drosophila and Anopheles), animals (Arthropods, Vertebrates, and C. elegans) and fungi (S. cerevisiae and S. pombe).
The Most Similar Supertree analysis (Creevey and McInerney 2005; Creevey et al. 2004) as implemented in the software package CLANN (Creevey and McInerney 2005) (http://bioinf.nuim.ie/software/clann/) was used for this analysis. This supertree method takes as input a set of source (gene) trees (constructed from amino acid alignments in this case) and seeks to identify the most similar supertree to the entire set of source trees as described by Creevey and McInerney (2004). For all of the eight data sets in this study, either an exhaustive search of all possible tree topologies uniting 10 taxa (2,027,025 trees) or a heuristic search using the subtree pruning and regrafting algorithm with 10 random addition starting replicates was carried out.
In order to assess the support for internal branches on a supertree, a bootstrap analysis (Felsenstein 1985) was carried out. The individual input trees were resampled with replacement, until a new data set was created with the same number of input trees as the original. An exhaustive search of tree space was carried out for each pseudoreplicate, and the results of the bootstrap analysis were summarized using a majority-rule consensus tree of 100 replicates.
To test the null hypothesis that the phylogenetic signal in the gene trees was no better than random, the YAPTP test was performed (Creevey and McInerney 2004). For each gene tree, we removed the taxon names and randomly reassigned them to the leaves. This removed any congruent phylogenetic signal between gene trees, while leaving the numbers, sizes and shapes of gene trees, the frequency with which any particular taxon was found across the gene trees, and the frequency of co-occurrence of any group of taxa within gene trees unaltered. A search of tree space was then carried out, and the score of the best supertree was recorded. This was repeated 100 times. We reject the null hypothesis that the gene trees contain no more phylogenetic signal than expected by chance alone if the score for the real gene tree is not bettered by any of the 100 sets of randomly permutated gene trees.
In order to examine the behavior of perfect data, we generated fully compatible input trees (an ideal data set). For each input tree, the topology was changed if needed so that it fitted perfectly onto the supertree. The taxonomic composition, frequency of co-occurrence, and extent of overlap in the ideal trees replicated that of the original input trees. An exhaustive search of supertree space was carried out using the sets of ideal trees, and the score of all the supertrees were calculated. The distribution of tree scores obtained from the raw data and ideal data were compared.
The data sets that contained all 10 taxa and produced trees that did not conflict with any of the topological controls were used to construct concatenated alignments. A gamma distribution with eight rate categories was used to discretely approximate the rate heterogeneity among the aligned amino acid sites using Tree-Puzzle 5.1 (Schmidt et al. 2002). Six alignments were created from this data by systematically stripping the fastest-evolving sites (categories 8 to 4), and in one instance, not removing any sites. The InvG model in MrBayes (Huelsenbeck and Ronquist 2001) and the majority-rule consensus algorithm in PAUP* (Swofford 2003) were used to reconstruct the phylogenies of each concatenated protein alignment. The nucleotide alignments of each of the families containing all 10 taxa were aligned and concatenated also. A maximum likelihood tree was then created using PAUP* (Swofford 2003). The phylogeny with the best likelihood was derived using the six substitutions-type model, with the rate-heterogeneity, gamma-shape parameter and proportion of invariable sites estimated.
Software for all these analyses is available at http://bioinf.nuim.ie/software/clann/. Data for all these analyses is available at http://bioinf.nuim.ie/supplementary/eukaryotes.
Results
Seven hundred and eighty single-gene families were identified out of a total of 54,014 randomized BlastP searches (Altschul et al. 1997). The resulting aligned amino acid sequences had a total length of 436,450 positions. For both the unstripped alignments (using both the JTT and InvG model) and for each of the five stripped categories (using the JTT model), a phylogeny was constructed using MrBayes. This resulted in seven sets of phylogenetic trees constructed from genes that are in single copy in each genome, each set consisting of 780 trees. The control-derived data sets were created from each of these seven data sets by examining each topology by eye. The unstripped alignments were also used to construct Neighbor-Joining trees.
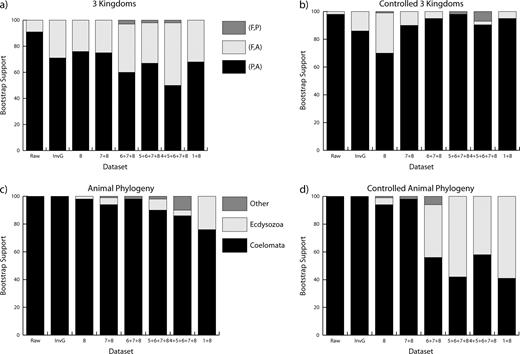
Following an exhaustive search of supertree space (2,027,025 trees), using the unstripped data as input, a range of supertree scores varying from 103 to 838 was found. The best supertree topology indicated that the Mammals, the Vertebrates, the Animals, the Arthropods, and the Fungi were each recovered as monophyletic groups (fig. 1). Unexpectedly, the animals and plants group together to the exclusion of the fungi. Although there are probably five plausible places in which this tree can be rooted, there is no rooting that puts the tree in agreement with the Opisthokonta hypothesis. To test the nature of the signals in the underlying data and to test the robustness of the phylogenetic hypotheses, a variety of tests were carried out. An exhaustive search of tree space was carried out using idealized gene trees that are completely compatible with the best supertree for the raw gene trees, 100 YAPTP tests and 100 bootstrap replicates were performed, and using the stripped data sets the contribution of different categories of sites was tested. As can be seen in supplementary fig. S1, the shape of the distribution from idealized gene trees is very similar to that of the supertree-score distribution for the raw gene trees. In addition, the YAPTP test demonstrates that congruence among individual gene trees is much greater than expected by chance alone, as the best supertree score does not lie in the distribution of the YAPTP test scores. In addition, a majority-rule consensus tree summarizing the trees from the bootstrap analysis gives strong support for the internal branches of our best tree topology (see fig. 2). In other words, this identical tree is recovered no fewer than 81% of the time, with most of the branches of the tree being recovered every singe time.
The phylogenetic tree that achieved the best score in 24 of the 26 analyses. This tree was obtained for 14 out of the 16 taxonomic congruence analyses and the remainder from total evidence approaches. The different data sets were created by stripping different categories of sites from the alignment according to their variability.
Relative support for competing hypotheses. Data set 8 indicates that category 8 has been removed, while data set 7 + 8 indicates that categories 7 and 8 have been removed, and so forth. (a) The bootstrap support values for the three possible topologies for the interrelationships of the three kingdoms: animals (A), plants (P), and fungi (F) where the data are not controlled. (b) The bootstrap support values for the three kingdoms using input data sets screened for sequence length and ability to recover “known” nodes. (c) Bootstrap proportions for the three possible relationships of the animal phylogeny using uncontrolled data. (d) Bootstrap support for the animal phylogeny using controlled data. The relationships in (a) and (b) are hypothesized to have diverged 950–1,259 MYA, while the relationships in (c) and (d) are hypothesized to have diverged 642–761 MYA (Douzery et al. 2004).
The contribution of different categories of sites can be summarized in table 1. The length of the alignment ranged from 304,759 aligned positions, down to 170,128 positions after the removal of the fastest and slowest categories of sites. Again, Bayesian trees were built for each single-gene family yielding 780 input trees for each data set, and an exhaustive search of supertree space was carried out for both real and idealized gene trees. In each data set, the best supertree from the real gene trees received a better score than any of the 100 YAPTP test scores, demonstrating that the agreement among real gene trees is greater than expected by chance alone. Again, the shape of the distribution of idealized gene trees is very similar to that of the supertree-score distribution for the raw gene trees. In addition, bootstrap analyses found our tree to be the best tree in all instances with strong support for the internal branches for the Coelomata clade across all the site-stripped data sets and decreasing support for the animal-plant clade as the fastest-evolving sites were removed (see fig. 2).
Statistics for the Data Sets Used in This Study
Taxonomic Congruence | |||||||||||||||
|---|---|---|---|---|---|---|---|---|---|---|---|---|---|---|---|
| Uncontrolled | Controlled | Total Evidence | |||||||||||||
| Category | Total Length | Coelomata | Animal-Plant | Number of Input Trees | Coelomata | Animal-Plant | Length (AA) | Coelomata | Animal-Plant | ||||||
| — | 436,450 | 100 | 91 | 480 | 100 | 98 | — | NA | NA | ||||||
| InvG | 436,450 | 100 | 71 | 477 | 100 | 86 | 1,452 | 97 | 91 | ||||||
| 8 | 304,759 | 98 | 76 | 350 | 94 | 70 | 1,001 | 99 | 84 | ||||||
| 7 + 8 | 270,733 | 94 | 75 | 299 | 98 | 90 | 870 | 100 | 92 | ||||||
| 6 + 7 + 8 | 241,555 | 98 | 60 | 255 | 56 | 95 | 747 | 99 | 99 | ||||||
| 5 + 6 + 7 + 8 | 211,929 | 90 | 67 | 203 | 42 | 98 | 620 | 100 | 100 | ||||||
| 4 + 5 + 6 + 7 + 8 | 180,869 | 86 | 50 | 153 | 58 | 90 | 516 | 98 | 100 | ||||||
| 1 + 8 | 170,128 | 76 | 68 | 145 | 41 | 95 | 725 | 96 | 75 | ||||||
NOTE.—The rows refer to the particular treatment of the data, whether the data were analyzed using a method that deals effectively with rate variation across sites or whether the data were stripped of different categories of the fastest-evolving sites. The numbers in the various columns refer to support values for the uncontrolled or the controlled single-gene trees or the concatenated alignment. NA means not applicable.
The preceding analyses used data that was not controlled for sequence length and ability to recover uncontroversial parts of the tree. Using the control-derived data sets, the results agree with the first analysis on the shape of the optimal tree (fig. 1). As sites are stripped, however, support for the Coelomata clade diminishes, while support for the animal-plant clade remains strong. The best topology from 14 of the 16 taxanomic congruence analyses resulted in the topology seen in figure 1.
A total of 14 genes were identified as being in single copy across all taxa; however, when the topology of the resulting phylogenetic trees was examined, it was noticed that the majority of these genes were unable to reconstruct the uncontroversial phylogenies in at least one case (see table 2). In fairness, most of these 14 genes were able to recover most of the uncontroversial splits, however, only five genes were capable of recovering all the uncontroversial parts of the tree. There was almost a fourfold variation in these proteins sizes. These genes are all central eukaryote metabolism genes and include the probable prefoldin subunit, which is a chaperone, a mitochondrial import protein and the MAK16 protein that is also involved in the cell cycle, a small nuclear ribonuclear protein and a protein (autophagocytosis protein) that is annotated in yeast as being responsible for the transport of proteins to the vacuole during starvation. Individually, only one protein supported the Opisthokonta hypothesis, while all the others supported the animal-plant split and all proteins supported the Coelomata hypothesis. These five genes (containing all 10 taxa and not conflicting with the topological controls) were concatenated and aligned resulting in 1,452 aligned positions. A chi-square test of amino acid compositional homogeneity indicated no biases (P value > 0.05). A phylogenetic tree was then constructed for this alignment using the JTT model implemented in Tree-Puzzle. Once again, the resulting tree topology was the same as in figure 1. A Neighbor-Joining tree based upon pairwise distances that were inferred using the JTT matrix also produced the same tree, and following 100 bootstrap resampling replicates, the split uniting the plants and animals was recovered 75% of the time with the animal-fungal split recovered 15% of the time and the plant-fungal split recovered 10% of the time. The contribution of fastest-evolving sites was then tested through the systematic removal of the five fastest-evolving categories of sites and the simultaneous removal of the fastest- and slowest-evolving sites (see table 1 for details). Each of the seven analyses resulted in the exact same tree best tree (fig. 1) being strongly supported. The Coelomata hypothesis received 100% bootstrap support in every one of these analyses. At this point an additional analysis was carried out involving the recoding of the datamatrix into the six Dayhoff categories in the same way as Embley et al. (2003). The data were then analyzed so that the process of substitution from one category to another (general time-reversible) was optimized, as well as the tree topology using an MCMC approach with the p4 software (http://www.nhm.ac.uk/zoology/external/p4.htm). The resulting support values for every internal node in figure 1 was unity (analysis kindly carried out by Peter Foster). This analysis effectively only analyses substitutions across, not within, Dayhoff categories and is similar to a transversion analysis of DNA sequences.
Five Single-Copy Genes That Can Successfully Recover All Five Uncontroversial Nodes
Protein Name | Length |
|---|---|
| Probable prefoldin subunit 2 | 206 |
| Mitochondrial import inner membrane translocase | 285 |
| Small nuclear ribonuclear protein | 113 |
| MAK16-like protein | 445 |
| Autophagocytosis protein | 403 |
Protein Name | Length |
|---|---|
| Probable prefoldin subunit 2 | 206 |
| Mitochondrial import inner membrane translocase | 285 |
| Small nuclear ribonuclear protein | 113 |
| MAK16-like protein | 445 |
| Autophagocytosis protein | 403 |
NOTE.—The functions of the genes are in the first column, the length in aligned amino acid positions in the second column.
Finally, we carried out a variety of tests of alternative hypotheses using the most conservative alignment (the alignment with site categories 4, 5, 6, 7, and 8 removed). The results are to be found in table 3. All alternatives were rejected at least once at the 5% level by one test, and most alternatives were rejected at least twice. In other words, changing the topology is a significantly worse interpretation of the evolution of these sequences.
Tests of Nine Alternative Trees Using Four Methods of Analysis
Tree | Log L | Difference | SE | p-1sKH | p-SH | c-ELW | 2sKH | ||
|---|---|---|---|---|---|---|---|---|---|
| Plant-animal | 1 | −4,505.55 | 0.00 | Best | 1.000+ | 1.000+ | 0.9313+ | Best | Coelomata |
| 2 | −4,521.64 | 16.09 | 8.46 | 0.032− | 0.094+ | 0.0107− | + | Ecdysozoa | |
| 3 | −4,520.86 | 15.31 | 8.65 | 0.048− | 0.114+ | 0.0258− | + | Other | |
| Fungi-animal | 4 | −4,520.01 | 14.47 | 7.19 | 0.029− | 0.135+ | 0.0053− | − | Coelomata |
| 5 | −4,534.84 | 29.29 | 10.94 | 0.011− | 0.008− | 0.000− | − | Ecdysozoa | |
| 6 | −4,534.08 | 28.53 | 11.10 | 0.009− | 0.011− | 0.0002− | − | Other | |
| Fungi-plant | 7 | −4,518.91 | 13.36 | 7.63 | 0.042− | 0.163+ | 0.0261− | + | Coelomata |
| 8 | −4,534.03 | 28.49 | 11.30 | 0.008− | 0.012− | 0.0001− | − | Ecdysozoa | |
| 9 | −4,533.37 | 27.83 | 11.42 | 0.017− | 0.014− | 0.0004− | − | Other |
NOTE.—Each row labeled 1–9 represents a tree. Trees 1, 2, and 3 have the plants and animals as each others closest relatives; Trees 4, 5, and 6 have the fungi and animals as each others closest relatives; and Trees 7, 8, and 9 have the plants and fungi as each others closest relatives. On the extreme right of the table is the within-animal topology as outlined in the Introduction. Log L, log-likelihood score; difference, difference in log-likelihood score between the best tree and the alternative; SE, standard error of the estimate; p-1sKH, P Value for the one-sided Kishino-Hasegawa test; p-SH, P value for the Shimodaira-Haswgawa Test; c-ELW, Equal Likelihood Weight; 2sKH, two-sided Kishino-Hasegawa test.
Discussion
We have addressed a phylogenetic analysis problem where there are five known nodes and only two unknown nodes. We have only used provably single-copy genes from completed genomes, and therefore this analysis is different to most other analyses in this respect. In the results presented here, support for the Coelomata hypothesis was obtained in 24 out of the 26 analyses, while unexpectedly all 26 analyses supported an animal-plant clade.
For our supertree analysis, the score distribution for the gene trees was found to be remarkably similar to the distribution of the idealized gene trees and very dissimilar to the randomized gene trees (the YAPTP test), indicating that the gene trees show a high level of congruence and extremely consistent signals. We tested for systematic methodological biases by constructing the input trees using a distance matrix and Neighbor-Joining approach and using the Bayesian approach. The supertree result was not influenced by these different treatments of the underlying data. Removal of those categories of aligned positions that were potentially the most misleading produced differing levels of support for the Coelomata and the animal-plant clade. When the data are uncontrolled (fig. 2a), there is moderate support for the animal-plant clade. However, when the data are controlled (fig. 2b), support for the animal-plant clade increases and remains strong across all data sets whereas support for the animal-fungal clade diminishes. This demonstrates that controlling the data has a measurable effect. The gene families that violated the controls were short in length (this is the main difference in the underlying data when comparing fig. 2a and b) and seem to reduce the support for the animal-plant relationship. Removing these problematic data sets (300 alignments) results in very clear support for the animal-plant clade.
For the more recent relationships concerning the Ecdysozoa-Coelomata hypotheses, the data behave differently. In the uncontrolled data (fig. 2c), there is strong support for the Coelomata hypothesis, but the signal begins to deteriorate as sites are removed (support dropping from 100% to 76%). For the controlled data, stripping the two fastest-evolving categories of sites (category 8 on its own or categories 7 + 8 combined) does not dramatically affect the support values for the Coelomata hypothesis. However, stripping sites past categories 7 + 8 has a very definite effect. Unlike the situation in figure 2b, where support for the animal-fungal clade is strengthened, there is a marked ambivalence in the preference for either the Ecdysozoa or the Coelomata hypothesis. In other words, at this point, there is very little signal in either direction; the stripping process has removed the sites whose variability is probably most relevant to the within-animal relationships, and support drops to about 50% for each of the competing hypotheses. We would expect the Ecdysozoa to dominate if the Coelomata topology was simply an artifact of fast-evolving sites (Aguinaldo et al. 1997), but instead this sudden ambiguity exists where neither hypothesis wins. Overall, because we cannot produce any data set that strongly prefers the Ecdysozoa hypothesis, we suggest that the Coelomata hypothesis has the most support.
Additionally, the results of the taxonomic congruence analyses are strengthened by the results of the total evidence analyses where the same tree is found in all instances, even though the concatenated alignments are based on only five genes. We have not used the EF-1α or the tubulin proteins as they are massively paralogous, and trying to establish orthology is not possible and we have not used the DHFR-TS genes for the same reason. We have been guided by the data, where the only proteins that were carried through to this part of the analysis were those that were universally distributed, in single copy in all sampled genomes, and with a demonstrated ability to recover the uncontroversial parts of the phylogenetic tree under consideration. Therefore, these are most likely to be the best genes to use to recover a eukaryotic tree of life. It was surprising to discover that so many single-copy genes were unable to recover all of the uncontroversial nodes on the tree.
There has been an argument that data concatenation is superior to other methods of analysis as it will remove sampling problems (Rokas et al. 2003). It has recently been shown that although this may be the case, unless an appropriate model is used to examine the data, concatenation can exacerbate the situation (Phillips, Delsuc, and Penny 2004). Bootstrap support values are a measure of the sampling problem. They answer the question: “What is the probability that if I had infinitely long sequences with the same collection of signals (either phylogenetic or otherwise) I would recover this particular internal branch using this method of analysis?” Naturally, as the sequences get longer, then this value will tend towards unity in many cases, providing seemingly unimpeachable support for the relationship with the strongest signal (either phylogenetic or otherwise) (Phillips, Delsuc, and Penny 2004). Therefore, we have used this kind of analysis in a corroborative context.
In an effort to investigate whether long-branch attraction (say between Plasmodium and the fungi) might have served to bolster the result that increased support for the animal-plant association when the sites were stripped, we analyzed the effect of site stripping on the relative distance from any one taxon to the other taxa. The results (demonstrated in supplementary fig. S2) show that when the sites are stripped, there is very little change in the relative distances from any one organism to the others. If exacerbation of a long-branch attraction artifact was the reason for the stronger support values for the animal-plant grouping, then it should manifest itself as a disproportionate increase in distance for these taxa, but it does not.
First of all, in the absence of any idea of the relative frequency of duplication and deletion of the genes being used, any analysis must be treated with caution. In this manuscript, we have had the luxury of being able to identify single-gene families that apparently are not so successful as multigene families (as evidenced by the fact that they have no paralogs in any of the phylogenetically distant genomes in our analysis). Having complete genome sequences has clearly helped enormously in this regard. To our knowledge, no analysis of any of the eukaryotic phylogenetic relationships has been carried out using these particular genes.
Our first examination of universally distributed single-copy genes produced a data set of 14 individual proteins. Upon examination of the individual gene trees from these proteins, it was noticed that nine of them did not successfully recover all the uncontroversial parts of the phylogenetic tree. This large proportion of proteins that fail our test has some serious implications for selection of appropriate markers for phylogenetic reconstruction and also some serious implications for past studies where markers have been used that are known to have complex histories of duplication and loss (Baldauf and Palmer 1993). However, for the remaining five genes that were capable of recovering the five uncontroversial splits, there was a clear result. According to these genes, irrespective of the way in which we analyzed the data, we recovered the phylogenetic tree in figure 1. When the data were concatenated there was strong support for the Coelomata and the animal-plant relationships, and individually, this topology was found for four of the five genes. Perhaps the most convincing evidence comes from the tests of the alternative hypotheses using the one-sided and two-sided Kishino-Hasegawa tests, the Shimodaira-Haswgawa test, and the Equal Likelihood Weights test as shown in table 3 when analyzing the most conservative alignment. The alternative hypotheses were generally rejected with significance. The differences in likelihood scores are outside the expectation of random chance. The alternative tree topologies represent significantly worse explanations of the data.
The consequence of the Opisthokonta hypothesis is that evolutionary scenarios are constructed based upon the supposition that it is true (for example Arisue, Hasegawa, and Hashimoto 2005). Consider the case of the intron positions found in the rpL14 gene (Enerly et al. 2003). In an analysis of the evolution of this gene, it was found that eight distinct introns could be identified among the eukaryotes (Enerly et al. 2003). The evolution of intron gain and loss was evaluated in the light of the Opisthokonta hypothesis. However, there are two introns shared solely by plants and at least some animals (introns 1 and 8), whereas there were no introns that were shared by fungi and animals to the exclusion of all other organisms. One intron is common to all three groups. Unfortunately, the interpretation of this situation was to hypothesize two independent losses of intron 1 (in yeast and C. elegans) and two independent gains of intron 8 (in the vertebrates and the plant). In the evolutionary scenario we have put forward here, it is possible to conceive a much more parsimonious solution. We hypothesize a single invention of intron 8 and two subsequent losses in C. elegans and D. melanogaster. It is extremely unlikely that intron 8 has arisen in precisely the same place, inserted at the exact same location, twice. Additionally, given the tree we present here, intron 1 needs to have disappeared only in C. elegans as it would not have existed in yeast. Therefore, the intron-exon patterning exhibited by the rpL14 gene is much more compatible with the sister group relationship between animals and plants than with the Opisthokonta hypothesis. This is in no way convincing evidence on its own, but it does point out some rare genomic events that are more compatible with an animal-plant grouping than an animal-fungal grouping.
In our analyses we have been careful to break up the data sets in as many ways as possible in order to investigate the relationships across these 10 taxa. The potential problems that remain include such issues as sparseness of sampling. However in the next decade, more genomic information will become available and this particular issue can be more fully resolved. According to the currently available methods, using gene sequences that are appropriate, rather than genes that are convenient, we find that the Opisthokonta hypothesis is not as good as the hypothesis supporting a clade that unites the animals and plants. This statement is true for all 26 different analyses that we have carried out. In addition, these genomic data indicate that there is stronger support for the Coelomata than the Ecdysozoa.
The last remaining issue to resolve is whether increased taxon sampling will change all these analyses. A total sampling of 10 taxa is embarrassingly small. Perhaps for such a difficult problem a total sampling of 100 diverse taxa might begin to approach the desirable level. This might be some way into the distant future. However, we have identified a number of markers that seem to have desirable properties, and in the absence of completed genomes, we might consider using this subset for polymerase chain reaction analysis.
Both authors contributed equally to this work and should be considered joint first authors.
William Martin, Associate Editor
We would like to acknowledge the financial assistance of the Irish Research Council for Science, Engineering and Technology and the Programme for Research in Third Level Institutes, Cycle III. Thanks to the commentary provided by three anonymous reviewers.
References
Adoutte, A., G. Balavoine, N. Lartillot, O. Lespinet, B. Prud'homme, and R. de Rosa.
Aguinaldo, A. M., J. M. Turbeville, L. S. Linford, M. C. Rivera, J. R. Garey, R. A. Raff, and J. A. Lake.
Altschul, S. F., T. L. Madden, A. A. Schaffer, J. Zhang, Z. Zhang, W. Miller, and D. J. Lipman.
Arisue, N., M. Hasegawa, and T. Hashimoto.
Baldauf, S. L.
Baldauf, S. L., and J. D. Palmer.
Baldauf, S. L., A. J. Roger, I. Wenk-Siefert, and W. F. Doolittle.
Blair, J. E., K. Ikeo, T. Gojobori, and S. B. Hedges.
Cavalier-Smith, T.
Copley, R. R., P. Aloy, R. B. Russell, and M. J. Telford.
Creevey, C. J., D. A. Fitzpatrick, G. K. Philip, R. J. Kinsella, M. J. O'Connell, M. M. Pentony, S. A. Travers, M. Wilkinson, and J. O. McInerney.
Creevey, C. J., and J. O. McInerney.
Danforth, B. N., and S. Ji.
de Rosa, R., J. K. Grenier, T. Andreeva, C. E. Cook, A. Adoutte, M. Akam, S. B. Carroll, and G. Balavoine.
Dopazo, H., J. Santoyo, and J. Dopazo.
Douzery, E. J., E. A. Snell, E. Bapteste, F. Delsuc, and H. Philippe.
Embley, T. M., M. van der Giezen, D. S. Horner, P. L. Dyal, and P. Foster.
Enerly, E., H. Ahmadi, K. Shalchian-Tabrizi, and A. Lambertsson.
Felsenstein, J.
———.
Giribet, G., D. L. Distel, M. Polz, W. Sterrer, and W. C. Wheeler.
Giribet, G., and C. Ribera.
Glenner, H., A. J. Hansen, M. V. Sorensen, F. Ronquist, J. P. Huelsenbeck, and E. Willerslev.
Gouy, M., and W. H. Li.
Hannaert, V., H. Brinkmann, U. Nowitzki, J. A. Lee, M. A. Albert, C. W. Sensen, T. Gaasterland, M. Muller, P. Michels, and W. Martin.
Hedin, M. C., and W. P. Maddison.
Hirt, R. P., J. M. Logsdon, Jr., B. Healy, M. W. Dorey, W. F. Doolittle, and T. M. Embley.
Huelsenbeck, J. P., and F. Ronquist.
Jones, D. T., W. R. Taylor, and J. M. Thornton.
Kamaishi, T., T. Hashimoto, Y. Nakamura, Y. Masuda, F. Nakamura, K. Okamoto, M. Shimizu, and M. Hasegawa.
Kamaishi, T., T. Hashimoto, Y. Nakamura, F. Nakamura, S. Murata, N. Okada, K. Okamoto, M. Shimizu, and M. Hasegawa.
Keeling, P. J., and W. F. Doolittle.
Kumar, S., and A. Rzhetsky.
Lang, B. F., C. O'Kelly, T. Nerad, M. W. Gray, and G. Burger.
Littlewood, D. T. J., P. D. Olson, M. J. Telford, E. A. Herniou, and M. Riutort.
Loytynoja, A., and M. C. Milinkovitch.
Mallatt, J., and C. J. Winchell.
Manuel, M., M. Kruse, W. E. G. Muller, and Y. Le Parco.
Mushegian, A. R., J. R. Garey, J. Martin, and L. X. Liu.
Myllykallio, H., G. Lipowski, D. Leduc, J. Filee, P. Forterre, and U. Liebl.
Nikoh, N., N. Hayase, N. Iwabe, K. Kuma, and T. Miyata.
Peterson, K. J., and D. J. Eernisse.
Phillips, M. J., F. Delsuc, and D. Penny.
Rokas, A., B. L. Williams, N. King, and S. B. Carroll.
Saitou, N., and M. Nei.
Schmidt, H. A., K. Strimmer, M. Vingron, and A. von Haeseler.
Snel, B., P. Bork, and M. Huynen.
Stechmann, A., and T. Cavalier-Smith.
Suhre, K., and J. M. Claverie.
Swofford, D. L.
Thompson, J. D., D. G. Higgins, and T. J. Gibson.
Wang, D. Y., S. Kumar, and S. B. Hedges.
Wolf, Y. I., I. B. Rogozin, and E. V. Koonin.
