


Abstract
Mitochondrial DNA (mtDNA) of multicellular animals (Metazoa) is typically a small (∼16 kbp), circular-mapping molecule that encodes 37 tightly packed genes. The structures of mtDNA-encoded transfer RNAs (tRNAs) and ribosomal RNAs (rRNAs) are usually highly unorthodox, and proteins are translated with multiple deviations from the standard genetic code. In contrast, mtDNA of the choanoflagellate Monosiga brevicollis, the closest unicellular relative of animals, is four times larger, contains 1.5 times as many genes, and lacks mentioned peculiarities of animal mtDNA. To investigate the evolutionary transition that led to the specific organization of metazoan mtDNA, we determined complete mitochondrial sequences from the demosponges Geodia neptuni and Tethya actinia, two representatives of the most basal animal phylum, the Porifera. We found that poriferan mtDNAs resemble those of other animals in their compact organization, lack of introns, and a well-conserved animal-like gene order. Yet, they contain several extra genes, encode bacterial-like rRNAs and tRNAs, and use a minimally derived genetic code. Our findings suggest that the evolution of the typical metazoan mtDNA has been a multistep process in which the compact genome organization and the reduced gene content were established prior to the reduction of tRNA and rRNA structures and the introduction of multiple changes of the translation code.
Introduction
Mitochondrial genomes vary extensively in size, structure, and gene content across diverse eukaryotic groups; those of multicellular animals (Metazoa), however, are remarkably uniform (Lang, Gray, and Burger 1999). A typical metazoan mitochondrial DNA (mtDNA) is a small (∼16 kpb), circular-mapping molecule that carries a conserved set of 37 genes coding for 13 proteins, two ribosomal RNAs (rRNAs), and 22 transfer RNAs (tRNAs) (Boore 1999). These genes are usually compactly arrayed, separated by no or only a few nucleotides, contain no introns, and with a few exceptions, their order remains stable over long evolutionary time. Most animal mtDNAs are further distinguished by multiple deviations in the genetic code, unusual and/or highly reduced rRNA and tRNA primary and secondary structures, and the presence of a single large noncoding region that, in some cases, is known to contain elements essential for the initiation of mitochondrial transcription and replication (reviewed in Wolstenholme 1992).
The distinct characteristics of animal mtDNA have clearly emerged after the divergence of the metazoan ancestors from their close unicellular relatives, the choanoflagellates, which have several-fold larger mitochondrial genomes with 1.5 times more genes, encode bacterial-like tRNAs and rRNAs, and use a minimally derived genetic code with TGA(Trp) as the only deviation (Burger et al. 2003). Comparative analyses can provide valuable insights into this remarkable transition in mtDNA evolution, but the scarcity of data from nonbilaterian animals (phyla Placozoa, Porifera, Ctenophora, and Cnidaria) severely limits such studies. To amend this situation we determined complete mitochondrial sequences from the demosponges Geodia neptuni (Sollas, 1886) (Demospongiae: Astrophorida: Geodiidae) and Tethya actinia (de Laubenfels, 1950) (Demospongiae: Hadromerida: Tethyidae), two representatives of the phylum Porifera, which we describe here. Recently, we have determined the complete sequence of another demosponge mtDNA (Axinella corrugata) (Lavrov and Lang 2005). This genome displays the distinctive features of sponge mtDNAs but also contains multiple GC-rich elements both in coding and noncoding regions and will be described elsewhere.
Sponges (phylum Porifera) are an exclusively aquatic group of organisms consisting of estimated 15,000 extant species in three distinct groups, the Hexactinellida (glass sponges), the Calcarea (calcareous sponges), and the Demospongiae (demosponges) (Hooper and van Soest 2002). The 19th century discovery of remarkable similarity between porifera-specific flagellated cells (choanocytes or collar cells) and free-living choanoflagellates led to a proposition that sponges are the most primitive metazoans evolved from choanoflagellate-like protist ancestors (Clark 1866, 1868). The basal position of sponges is corroborated by the existence of poriferan fossil record going back to the Early Vendian (∼580 MYA) (Li, Chen, and Hua 1998) and the retention of colony-like features in sponge morphological organization (such as the capacity for cell dissociation and reaggregation and the digestion of food within individual cells rather than in cavities) (Maldonado 2004). Furthermore, sponges are placed at the base of metazoan radiation by phylogenetic studies based on morphological characters (Jenner and Schram 1999) and molecular sequences (Borchiellini et al. 2001; Medina et al. 2001), although the latter studies usually recover them as a paraphyletic group.
Materials and Methods
Specimen Collection, DNA Extraction, Amplification, and Cloning
A specimen of G. neptuni (Sollas, 1886) (Class Demospongiae: Order Astrophorida: Family Geodiidae) was collected from Tennessee Reef, Florida Keys, Florida, at a depth of 15 m and that of T. actinia (de Laubenfels, 1950) (Class Demospongiae: Order Hadromerida: Family Tethyidae) was collected from mangrove roots in Zane Grey Creek, Long Key, Florida. Vouchers of the sponges were preserved in 70% ethanol for histological processing and taxonomic identification. Portions of each sponge were stored frozen after addition of an 8M guanidinium chloride solution in TE buffer (10 mM Tris, 1 mM EDTA, pH 8). Total DNA was prepared from ∼1 cm3 piece of each specimen by phenol-chloroform extraction following proteinase K digestion. Regions of cox1 and rnl were amplified using primers HCO, LCO, 16S-ARL, and 16S-BRH (Folmer et al. 1994; Hillis, Moritz, and Mable 1996), checked against the GenBank database to exclude the possibility of contamination, and used to design specific primers for these regions. Complete mtDNA from both species was amplified in two overlapping fragments using the TaKaRa LA-PCR kit under recommended conditions. Random clone libraries were constructed from the purified polymerase chain reaction (PCR) products by nebulizing them into fragments 1–3 kbp in size (Okpodu et al. 1994) and by cloning them into a modified pBluescript II KS+ vector with a shortened multicloning site (pBFL). Modified versions of the universal eukaryotic primers A and B (Medlin et al. 1988) were used for amplifications of the nuclear small subunit rRNA (SSU-rRNA) genes from the two species.
Sequencing, Assembly, and Gene Identification
Clones were sequenced on a Li-Cor automated sequencer (Lincoln, Nebr.) and assembled using the STADEN software suite (Staden 1996). Problematic and underrepresented regions in the assembled mtDNA sequence as well as the nuclear SSU-rRNA genes were sequenced directly from PCR products by primer walking. tRNA genes were identified by the tRNAscan-SE program (Lowe and Eddy 1997); other genes were identified by similarity searches in local databases using the FASTA program (Pearson 1994) and in GenBank at the NCBI using Blast network service (Benson et al. 2003). The secondary structures of rRNA genes were derived by analogy to other published rRNA gene structures and drawn using the RnaViz 2 program (De Rijk, Wuyts, and De Wachter 2003). Complete mitochondrial and partial nuclear SSU-rRNA sequences are available via GenBank accession numbers AY_320032, AY_320033, and AY878078, AY878079, respectively.
Sequence Analysis
For the analysis of sequence divergence, individual genes were aligned with ClustalW 1.82 (Thompson, Higgins, and Gibson 1994) using default parameters; alignments were manually adjusted based on (1) amino acid alignments (for protein-coding genes) or (2) inferred rRNA or tRNA secondary structures (for RNA-coding genes). Observed sequence divergences were calculated as percentages of mismatched nucleotides in the alignments. Pairwise Tamura-Nei distances were determined using PAUP*4.0b10 (Swofford 2002).
Phylogenetic Analyses of Protein Data
Amino acid sequences of individual proteins were aligned three times using the ClustalW 1.82 (Thompson, Higgins, and Gibson 1994) with different combinations of opening-extension gap penalties: 10/0.2 (default), 12/4, and 5/1. For the last alignment, no increased gap penalties near existing gaps, no reduced gap penalties in hydrophilic stretches, and no residue-specific penalties were applied. The three alignments were compared using SOAP (Löytynoja and Milinkovitch 2001), and the positions which were identical among them were included in phylogenetic analyses. The final concatenated data set was 2,865 amino acids in length.
We performed a maximum likelihood search for the best tree as implemented in the PHYML program (Guindon and Gascuel 2003) using a gamma + invariant model with eight categories, estimated the α-parameter, the mtREV matrix of amino acid substitutions, and estimated the frequencies of amino acids. Hundred bootstrap replicates were generated by the SEQBOOT program within the PHYLIP package (Felsenstein 2002) and analyzed as above. Bayesian inferences (MB) used MrBayes 3.0b4 (Ronquist and Huelsenbeck 2003). We ran four Markov Chain Monte Carlo chains for 110,000 generations, using the mtREV model of amino acid substitutions with gamma + invariant distributed rates. Trees were sampled every 10th cycle after the first 4,000 burn-in cycles.
Results and Discussion
Genome Organization: Expanded Gene Content, Conserved Gene Order, and Multiple Noncoding Regions
The mitochondrial genomes of G. neptuni and T. actinia (fig. 1) are circular-mapping molecules 18.0 and 19.6 kbp in size, and contain the largest collections of genes (40 and 41, respectively) so far identified in any metazoan mtDNA. In addition to the 37 genes typical for animal mitochondria, genes for subunit 9 (subunit c) of adenosine triphosphate (ATP) synthase, and for two (G. neptuni) or three (T. actinia) extra tRNAs are present in demosponge genomes. In both mtDNAs, all genes have the same transcriptional orientation. The relative arrangement of protein and rRNA genes is identical in the two genomes, except for the position of nad6, while the locations of 13 out of 24 tRNA genes differ between them (fig. 1). Several gene clusters have been conserved between sponges and other animal groups and are informative for the phylogenetic reconstruction of animal relationships based on mitochondrial gene order data (Lavrov and Lang, unpublished data).
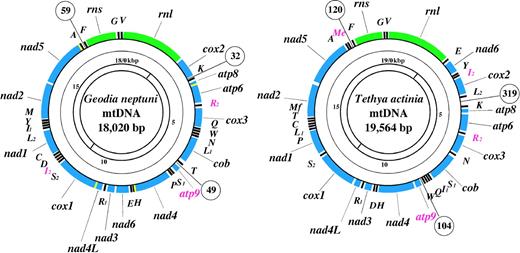
Genetic maps of demosponge mtDNAs. Protein (blue) and ribosomal (green) genes are atp6, atp8-atp9—subunits 6, 8, and 9 of F0 adenosine triphosphatase (ATP) synthase, cox1-3—cytochrome c oxidase subunits 1-3, cob—apocytochrome b (cob), nad1-nad6 and nad4L—NADH dehydrogenase subunits 1-6 and 4L, rns and rnl—small and large subunit rRNAs. tRNA genes (black) are identified by the one-letter code for their corresponding amino acid; subscripts denote different genes for isoacceptor tRNAs. Genes that have not been previously reported for animal mtDNA are shown in red and overlaps between adjacent genes in yellow. All genes are transcribed clockwise. The three largest intergenic regions are indicated for each genome. The innermost circle shows the locations of PCR amplification products.
Both poriferan mitochondrial genomes have a high coding density typical for animals. Intergenic regions constitute only 2.1% and 7.6% of the G. neptuni and T. actinia genomes, respectively, and no introns are found. Compactness of G. neptuni mtDNA is further emphasized by the presence of four pairs of overlapping genes: atp8/atp6 (1 nt), nad4L/cox1 (13 nt), nad4/trnH(gug) (21 nt), and nad5/trnA(ugc) (10 nt). However, in contrast to most other Metazoa, the distribution of noncoding nucleotides is more even in poriferan mtDNA (i.e., none of the noncoding regions contains more than a quarter of the total number of noncoding nucleotides). In G. neptuni mtDNA, a total of 375 bp are scattered among 30 segments with the largest of them, downstream of trnA(ugc), only 59 bp long. In T. actinia mtDNA, 1,486 noncoding base pairs are distributed among 38 intergenic regions 1–319 bp in size. The locations of the three largest intergenic regions are conserved between the two genomes (upstream of trnF(gaa), trnK(uuu), and atp9; fig. 1), but these regions do not share conserved sequence patterns or secondary structures that might indicate the presence of genetic control elements.
Nucleotide Composition and Sequence Divergence
The A + T content of G. neptuni and T. actinia mtDNA is 66.5% and 70.7%, respectively, within the range of other animals. The two DNA strands have significantly different nucleotide composition in both species: the coding strands have a positive GC skew and a negative AT skew (where GC skew = (G − C)/(G + C) and AT skew = (A − T)/(A + T) [Perna and Kocher 1995]). The difference between the number of Gs and Cs is especially pronounced in T. actinia (GC skew = 0.35). Within each genome, the GC skew is similar across different gene types, whereas the AT skew is negative in protein-coding and tRNA genes but positive in rRNA genes and intergenic regions (table 1). The biased nucleotide composition of the coding strand has a strong influence on the synonymous codon usage in poriferan mtDNAs. Out of 62 codons expected to specify an amino acid, one (CGC) is not found in mitochondrial protein-coding genes in either species, and four others (CTC, CTG, AAC, and GTC) are not found in T. actinia. Furthermore, among the existing codons, those ending with A or T are preferred (except in the glycine family, where the GGG is most abundant), while those ending with C are usually the least frequent (6.5% and 0.9% of the total number of codons in G. neptuni and T. actinia, respectively) (supplementary table 1).
Nucleotide Composition Data for the Coding Strand of Geodia neptuni (GN) and Tethya actinia (TA) mtDNA
Coding Sequences | |||||||||||||||
|---|---|---|---|---|---|---|---|---|---|---|---|---|---|---|---|
| Total | Third Positions | rRNA Genes | tRNA Genes | Intergenic | |||||||||||
| GN | TA | GN | TA | GN | TA | GN | TA | GN | TA | ||||||
| % G | 19.4 | 19.0 | 14.7 | 14.2 | 22.9 | 21.2 | 24.2 | 23.6 | 14.5 | 17.5 | |||||
| % A | 28.7 | 30.8 | 38.0 | 43.9 | 35.3 | 37.7 | 28.5 | 29.5 | 43.9 | 44.8 | |||||
| % T | 39.4 | 40.6 | 40.9 | 42.6 | 27.1 | 30.0 | 32.0 | 33.1 | 34.3 | 36.0 | |||||
| % C | 12.4 | 9.5 | 6.5 | 0.9 | 14.5 | 11.0 | 15.1 | 13.7 | 7.3 | 1.1 | |||||
| % A + T | 68.1 | 71.5 | 78.8 | 85.2 | 62.5 | 67.8 | 60.6 | 62.7 | 78.2 | 81.3 | |||||
| AT skew | −0.16 | −0.14 | −0.04 | 0.02 | 0.13 | 0.11 | −0.06 | −0.06 | 0.12 | 0.11 | |||||
| GC skew | 0.22 | 0.33 | 0.39 | 0.86 | 0.23 | 0.32 | 0.23 | 0.27 | 0.33 | 0.88 | |||||
| Total (bp) | 12,282 | 12,453 | 4,080 | 4,141 | 3,633 | 3,783 | 1,765 | 1,844 | 385 | 1,485 | |||||
Observed nucleotide sequence divergences between homologous genes from the two species range from 19% (cox3) to 56% (atp8) (average 26%) for protein-coding genes, from 9% (trnW(uca)) to 44% (trnS(uga)) (average 21%) for tRNA-coding genes, and are around 28% for the two rRNA genes. Observed amino acid sequence divergences between encoded proteins range from 13% (cox1) to 69% (atp8) (average 26%). We evaluated the relative rate of molecular evolution in poriferan mtDNA, by determining partial sequences of G. neptuni and T. actinia nuclear SSU-rRNA genes and by comparing divergences in mitochondrial and nuclear SSU-rRNA genes between these species. Furthermore, we performed the same comparisons for placental and marsupial-monotreme mammals, two groups separated by similar evolutionary distances in mitochondrial genes (Lopez et al. 1997). We find that the extent of sequence divergence in poriferan mitochondrial SSU-rRNA genes is 4.3 times greater than that in nuclear SSU-RNA genes, and that in mammals this difference is 10.7 times on average (fig. 2A). The smaller discrepancy between mitochondrial and nuclear genetic distances in sponges is clearly the result of a lower rate of mitochondrial evolution (rather than a higher rate of 18S evolution) because in absolute terms both the nuclear and the mitochondrial SSU-rRNA genes evolve slower in sponges (fig. 2B and C) (Watkins and Beckenbach 1999; Shearer et al. 2002). Furthermore, a combination of higher divergence of demosponge mitochondrial versus nuclear genes, and the extremely low level of intraspecific polymorphism in their mitochondrial genes (Shearer et al. 2002; Duran, Pascual, and Turon 2004), indicates that relaxed selection pressure (rather than increased mutational pressure) is responsible for the observed discrepancy in the rates of mitochondrial versus nuclear evolution (Hudson, Kreitman, and Aguade 1987).
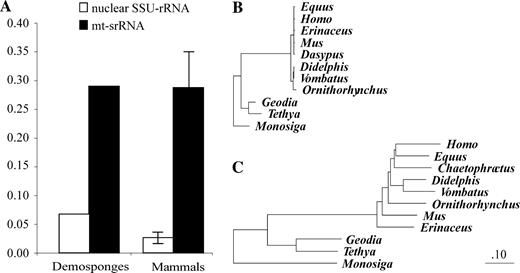
Nucleic acid sequence divergence of poriferan and mammalian SSU-RNA genes. (A) Comparison of genetic distances between two species of demosponges and between two groups of mammals. For mammals, the average genetic distance calculated from 15 possible pairs of placental + marsupial-monotreme mammals is presented, with error bars indicating the range of observed values. (B) and (C) Neighbor-Joining trees based on nuclear (B) and mitochondrial (C) SSU-RNA distances using Monosiga brevicollis as an out-group. The branch lengths are adjusted to the same scale. The following species of mammals were used for the analysis: mouse (Mus musculus), human (Homo sapiens), domestic horse (Equus caballus), hairy (mt SSU-rRNA) or nine-banded (nuclear SSU-rRNA) armadillo (Chaetophractus villosus or Dasypus novemcinctus), hedgehog (Erinaceus europeus), Virginian opossum (Didelphis virginiana), common wombat (Vombatus ursinus), and duckbill platypus (Ornithorhynchus anatinus). Nuclear SSU-rRNA sequences and poriferan mitochondrial rns sequences were aligned manually, following both primary sequence and secondary structure conservation. Alignments of mammalian mt SSU-rRNA genes were downloaded from the Ribosomal Database Project (RDP-II) site (Cole et al. 2003).
Protein-Coding Genes: Retention of atp9 and the Presence of Metazoa-Specific Indels
Fourteen protein-coding genes have been identified in both sponge mtDNAs, including atp9, a gene for subunit 9 (subunit c) of mitochondrial F0-ATP synthase. Atp9 is also present in mtDNAs of most fungi, plants, and protists (Lang, Gray, and Burger 1999), but is located in the nuclear genomes of all other animals studied to date. The size of atp9 is identical in the two poriferan mtDNAs, and its sequence is the second best conserved among protein-coding genes, both in comparisons among sponges and between sponges and the choanoflagellate Monosiga brevicollis, a clear indication of its functionality. Other pairs of poriferan mitochondrial (mt)-protein genes are also well conserved in size, with the exception of atp8, which is 27% larger, and nad4L, which is 7% smaller in T. actinia compared to G. neptuni (table 2).
Protein-Coding Genes of Demosponges Geodia neptuni and Tethya actinia
Number of Encoded Amino Acids | % Sequence Identity | Predicted Initiation and Termination Codons | |||||||
|---|---|---|---|---|---|---|---|---|---|
| Gene | Geodia neptuni/Tethya actinia | Nucleotide | Amino acid | Geodia neptuni/Tethya actinia | |||||
| atp6 | 244 | 244 | 75.1 | 70.9 | ATG/ATG | TAA/TAA | |||
| atp8 | 63 | 80 | 43.6a | 31.2 | ATG/ATG | TAA/TAA | |||
| atp9 | 78 | 78 | 79.3 | 84.6 | ATG/ATG | TAA/TAA | |||
| cob | 381 | 381 | 79.2 | 80.6 | GTGb/ATG | TAA/TAA | |||
| cox1 | 520 | 522 | 78.8 | 87.2 | GTGb/ATG | TAG/TAA | |||
| cox2 | 247 | 243 | 77.6 | 80.6 | ATG/ATG | TAA/TAA | |||
| cox3 | 262 | 262 | 80.5 | 85.1 | ATG/ATG | TAG/TAG | |||
| nad1 | 327 | 338 | 75.4 | 77.2 | ATG/ATG | TAG/TAG | |||
| nad2 | 465 | 481 | 69.4 | 65.2 | ATG/ATG | TAA/TAG | |||
| nad3 | 118 | 118 | 78.4 | 81.4 | ATG/ATG | TAA/TAA | |||
| nad4 | 481 | 482 | 76.7 | 77.8 | ATG/ATG | TAG/TAA | |||
| nad4L | 106 | 99 | 74.1 | 72.6 | ATG/GTGb | TAA/TAA | |||
| nad5 | 603 | 622 | 75.5 | 76.2 | ATG/ATG | TAG/TAA | |||
| nad6 | 185 | 187 | 69.6 | 65.8 | GTG/TTGb | TAA/TAA | |||
The alignment of atp8 is problematic due low conservation and size variation.
Non-ATG start codons are shown in bold.
Most poriferan mt-protein genes are larger than their counterparts in bilaterian animals but smaller than those in choanoflagellate M. brevicollis. For several genes the reduction in length is due to internal deletions that are well conserved across the Metazoa but absent in M. brevicollis and most other nonanimal species (fig. 3), rejecting the idea that choanoflagellates may be derived from sponges or other basal metazoans (King and Carroll 2001; Maldonado 2004). However, a single deletion in cox1 is shared between animals and the ichthyosporean Amoebidium parasiticum, which we interpret as an isolated case of convergent evolution (for a discussion of the restricted value of indels in phylogenetic inference, see Gribaldo and Philippe [2002]).
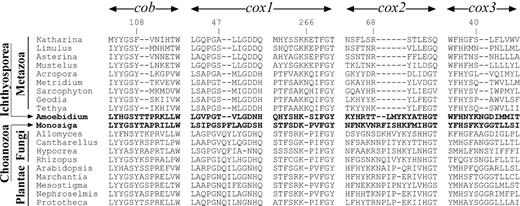
Conserved indel events shared among multicellular animals. The four best-conserved genes (cob, cox1–cox3) were analyzed. The protein sequences for Cantharellus cibarius, Hypocrea jecorina, and Rhizopus oryzae were downloaded from http://megasun.bch.umontreal.ca/People/lang/FMGP/proteins.html. Other protein sequences were inferred from GenBank files: Katharina tunicataU09810, Limulus polyphemusAF216203, Asterina pectiniferaD16387, Mustelus manazoAF347015, Acropora tenuisAF338425, Metridium senileAF000023, Sarcophyton glaucumAF064823, AF063191, Amoebidium parasiticumAF538042–AF538052, Monosiga brevicollisAF538053, Allomyces macrogynusU41288, Allomyces macrogynusU41288, Arabidopsis thalianaNC_001284, Marchantia polymorphaNC_001660, Mesostigma virideAF353999AF323369, Nephroselmis olivaceaAF110138, and Prototheca wickerhamiiNC_001613.
Complete Set of tRNAs for A Minimally Derived Genetic Code
MtDNAs of almost all animals examined so far contain 22 tRNA genes. Although this number is smaller than the lowest theoretical number of tRNAs an organism can live with, it is considered to be sufficient for mitochondrial protein synthesis in animals not only due to the application of mitochondrial “super wobble” rules of anticodon-codon decoding (reducing the set of required tRNAs to ∼24–26) but also due to additional changes in animal mitochondrial genetic codes (the reassignments of the AGA/AGG and the ATA codons) and use of the same mt-
The presence of a mitochondrial gene for
Canonical mt-tRNA Structures
Not only do poriferan mtDNAs contain the largest number of tRNA genes among animals, but they also encode tRNAs that are little derived in terms of size, primary sequence, and inferred secondary structure (supplementary figs. 5 and 6). In contrast to other animals, Porifera have mt-tRNAs with well-conserved D- and T-loops (7–9 and 7 nucleotides in length, respectively), which are able to form the standard tertiary interactions G18-U55 and G19-C56. Variable or semi-invariable nucleotide positions, and secondary and tertiary interactions of prokaryotic and nuclear tRNAs are well conserved in poriferan mt-tRNAs (fig. 4). In the most extreme case of mt-
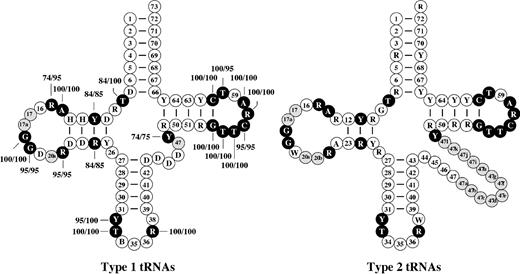
Consensus secondary structures for type 1 (with short variable arm) and type 2 (with long variable arm) poriferan mt-tRNAs. Numbering of nucleotides is based on the convention used for yeast tRNA phenylalanine (Robertus et al. 1974). Open circles with numbers, nucleotides are present in all tRNAs group; open circles with letters, nucleotide combinations present in all tRNAs; filled black circle, nucleotides or nucleotide combinations that are described as invariant or semi-invariant in prokaryotic and eukaryotic nuclear-encoded tRNAs with frequencies (percentages) for poriferan type1 mt-tRNAs shown by accompanying numbers (all these nucleotides are 100% conserved in type 2 tRNAs); filled gray circles, nucleotides present in some but not all tRNAs.
Among the structural deviations in demosponge mtDNAs are atypical R11-Y24 pairs in
Bacteria-like Mitochondrial rRNA Structures in Sponges
Genes for small and large subunit mitochondrial rRNAs (rns and rnl, respectively), but not for 5S rRNA, have been found in poriferan mtDNA—a common feature of all opisthokonts (animals, fungi, plus choanoflagellates). In demosponge mtDNAs, rns and rnl are separated by two tRNA genes (rns-trnG-trnV-rnl), similar to their arrangement in mtDNA of the choanoflagellate M. brevicollis (rns-trnG-rnl) and many bilaterian animals (rns-trnV-rnl). Based on secondary structure modeling (supplementary figs. 1–4), we deduced the lengths of the rns genes as 1,244 bp and 1,242 bp, and of rnl genes as 2,395 bp and 2,541 bp, in G. neptuni and T. actinia, respectively. This makes them the largest mitochondrial ribosomal genes described for animals. By comparison, mt-rRNA genes in other animals vary between ∼690 and 1,135 bp for rns, and between ∼950 and 2,259 bp for rnl (Wolstenholme 1992). Consistent with the larger sizes of poriferan mitochondrial ribosomal genes, the deduced secondary structures of encoded rRNAs are the least derived among all Metazoa. However, in comparisons to Escherichia coli 16S and 23S rRNAs, several secondary structure elements are either missing or reduced. The extent of this reduction is intermediate between those reported for mt-rRNAs of the choanoflagellate M. brevicollis and the sea anemone Metridium senile (supplementary table 2).
Diploblastica or Long-Branch Attraction Artifact?
Phylogenetic analyses based on concatenated amino acid sequences from twelve mitochondrial protein genes reveals an overall conventional tree of eukaryotic relationships, with strong support for most of the inferred clades, including the monophyletic Metazoa and its sister group association with the choanoflagellate M. brevicollis (fig. 5A). In our analyses, animals are divided into two well-supported groups, the Bilateria and the Diploblastica (Porifera + Cnidaria). Alternative relationships among the Bilateria, Porifera, and Cnidaria are strongly rejected by statistical tests (fig. 5B). Note however that the support for a division into Bilateria and Diploblastica might be misleading, given the very different rates of molecular evolution (i.e., branch lengths). The highly elevated evolutionary rates in Bilateria cause long-branch attraction (LBA) (Felsenstein 1978) towards the base of the Metazoa and a potential artificial regrouping of the slow-evolving cnidarians and demosponges.
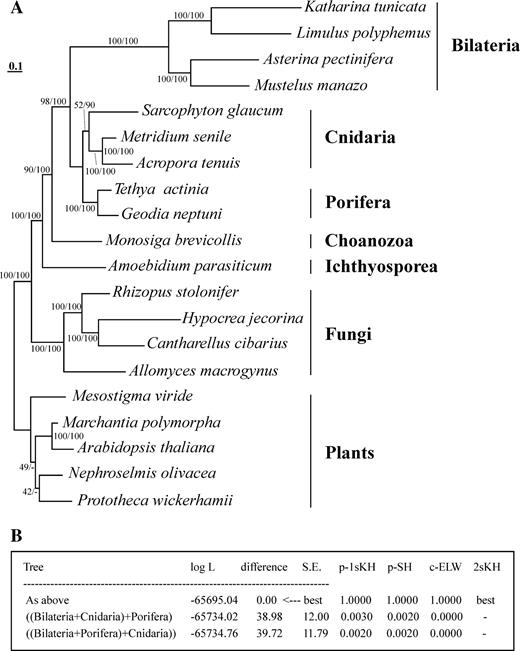
Phylogenetic position of the Porifera based on maximum likelihood (ML) and Bayesian (MB) analyses of derived protein sequences. (A) ML tree. The first number at each node indicates the percentage of ML bootstrap support; the second number shows the posterior probability in percent. Phylogenetic relationships not supported by the MB consensus tree are marked with minus signs. For sources of protein sequences see figure 3. (B) P values of likelihood tests: 1sKH, one-sided KH test based on pairwise SH tests; SH, Shimodaira-Hasegawa test; ELW, expected likelihood weight; 2sKH, two-sided Kishino-Hasegawa test, as implemented in Tree-Puzzle 5.1. Minus signs denote significant exclusion. All tests use a 5% significance level.
LBA has been a major problem in metazoan molecular phylogeny, often dividing bilaterian and nonbilaterian animals into two monophyletic assemblages (Christen et al. 1991; Kobayashi, Wada, and Satoh 1996) or even questioning their sister group relationship (Field et al. 1988). More recent analyses of nuclear rDNA data no longer support the monophyly of non bilaterian animals but instead place the paraphyletic sponges at the base of the Metazoa and associate Cnidaria as the sister group of Bilateria (Borchiellini et al. 2001; Medina et al. 2001). The inability of our study to overcome the suspected LBA effect can in part be explained by poor species sampling of mtDNAs from nonbilaterian animals and in part by a more pronounced acceleration of evolutionary rates in mitochondrial versus nuclear genes during the transition to bilaterian animals.
Concluding Remarks
The results presented in this study show that demosponges, part of the earliest divergence within the Metazoa, have retained several ancestral mitochondrial features that have been lost in other animal groups. These ancestral features include the presence of extra genes, multiple noncoding regions, the use of a minimally modified genetic code, and bacteria-like rRNA and tRNA structures. At the same time, poriferan mtDNAs also display features characteristic of other, more derived animal mtDNAs, including compact genome organization, reduced gene content, a significant degree of conserved gene order, absence of introns, and an unusual R11-Y23 pair in
Present address: Department of Ecology, Evolution and Organismal Biology, Iowa State University
Geoffrey McFadden, Associate Editor
We thank Zhang Wang for assistance in cloning and sequencing, and Henner Brinkman, Kevin Helfenbein, and Nicole King for valuable comments on an earlier version of this manuscript. Salary and interaction support from the Canadian Institutes of Health Research (D.V.L., B.F.L.) and the Canadian Institute for Advanced Research (B.F.L.), and supply of laboratory equipment and informatics infrastructure by Genome Quebec/Canada is gratefully acknowledged.
References
Beagley, C. T., J. L. Macfarlane, G. A. Pont-Kingdon, R. Okimoto, N. Okada, and D. R. Wolstenholme.
Benson, D. A., I. Karsch-Mizrachi, D. J. Lipman, J. Ostell, and D. L. Wheeler.
Borchiellini, C., M. Manuel, E. Alivon, N. Boury-Esnault, J. Vacelet, and Y. Le Parco.
Burger, G., L. Forget, Y. Zhu, M. W. Gray, and B. F. Lang.
Castresana, J., G. Feldmaier-Fuchs, and S. Pääbo.
Christen, R., A. Ratto, A. Baroin, R. Perasso, K. G. Grell, and A. Adoutte.
———.
Cole, J. R., B. Chai, T. L. Marsh et al. (11 co-authors).
De Rijk, P., J. Wuyts, and R. De Wachter.
Duran, S., M. Pascual, and X. Turon.
Felsenstein, J.
Field, K. G., G. J. Olsen, D. J. Lane, S. J. Giovannoni, M. T. Ghiselin, E. C. Raff, N. R. Pace, and R. A. Raff.
Folmer, O., M. Black, W. Hoeh, R. Lutz, and R. Vrijenhoek.
Garey, J. R., and D. R. Wolstenholme.
Gribaldo, S., and H. Philippe.
Guindon, S., and O. Gascuel.
Hillis, D. M., C. Moritz, and B. K. Mable.
Hooper, J., and R. van Soest.
Hudson, R. R., M. Kreitman, and M. Aguade.
Jenner, R. A., and F. R. Schram.
King, N., and S. B. Carroll.
Kobayashi, M., H. Wada, and N. Satoh.
Lang, B. F., M. W. Gray, and G. Burger.
Lavrov, D. V., and B. F. Lang.
Li, C. W., J. Y. Chen, and T. E. Hua.
Lopez, J. V., M. Culver, J. C. Stephens, W. E. Johnson, and S. J. O'Brien.
Lowe, T. M., and S. R. Eddy.
Löytynoja, A., and M. C. Milinkovitch.
Maldonado, M.
Marck, C., and H. Grosjean.
Medina, M., A. G. Collins, J. D. Silberman, and M. L. Sogin.
Medlin, L., H. J. Elwood, S. Stickel, and M. L. Sogin.
Muramatsu, T., K. Nishikawa, F. Nemoto, Y. Kuchino, S. Nishimura, T. Miyazawa, and S. Yokoyama.
Okpodu, C. M., D. Robertson, W. F. Boss, R. K. Togasaki, and S. J. Surzycki.
Pearson, W. R.
Perna, N. T., and T. D. Kocher.
Robertus, J. D., J. E. Ladner, J. T. Finch, D. Rhodes, R. S. Brown, B. F. Clark, and A. Klug.
Ronquist, F., and J. P. Huelsenbeck.
Shearer, T. L., M. J. Van Oppen, S. L. Romano, and G. Worheide.
Soma, A., Y. Ikeuchi, S. Kanemasa, K. Kobayashi, N. Ogasawara, T. Ote, J. Kato, K. Watanabe, Y. Sekine, and T. Suzuki.
Swofford, D. L.
Thompson, J. D., D. G. Higgins, and T. J. Gibson.
Tomita, K., T. Ueda, and K. Watanabe.
Watkins, R. F., and A. T. Beckenbach.
Weber, F., A. Dietrich, J. H. Weil, and L. Marechal-Drouard.
Author notes
*Département de Biochimie, Université de Montréal, Montréal, Québec, Canada; †National Institute of Water & Atmospheric Research (NIWA) Ltd., Newmarket, Auckland, New Zealand; and ‡Canadian Institute for Advanced Research, Centre Robert Cedergren
