


Abstract
The sense of bitter taste plays a critical role in how organisms avoid generally bitter toxic and harmful substances. Previous studies revealed that there were 25 intact bitter taste receptor (T2R) genes in humans and 34 in mice. However, because the recent chicken genome project reported only three T2R genes, it appears that extensive gene expansions occurred in the lineage leading to mammals or extensive gene contractions occurred in the lineage leading to birds. Here, I examined the T2R gene repertoire in placental mammals (dogs, Canis familiaris; and cows, Bos taurus), marsupials (opossums, Monodelphis domestica), amphibians (frogs, Xenopus tropicalis), and fishes (zebrafishes, Danio rerio; and pufferfishes, Takifugu rubripes) to investigate the birth-and-death process of T2R genes throughout vertebrate evolution. I show that (1) the first extensive gene expansions occurred before the divergence of mammals from reptiles/birds but after the divergence of amniotes (reptiles/birds/mammals) from amphibians, (2) subsequent gene expansions continuously took place in the ancestral mammalian lineage and the lineage leading to amphibians, as evidenced by the presence of 15, 18, 26, and 49 intact T2R genes in the dog, cow, opossum, and frog genome, respectively, and (3) contractions of the gene repertoire happened in the lineage leading to chickens. Thus, continuous gene expansions have shaped the T2R repertoire in mammals, but the contractions subsequent to the first round of expansions have made the chicken T2R repertoire narrow. These dramatic changes in the repertoire size might reflect the daily intake of foods from an external environment as a driving force of evolution.
Introduction
Senses of taste, vision, hearing, touch, and olfaction play critical roles in recognizing conditions of the external world and providing organisms with indispensable information for guiding behavior. It is thought that the repertoire of sensory receptors is intimately related to external environments in which organisms have lived and it must have been continuously remolded under ever-changing environments. Sense of taste itself is empirically classified into five basic modalities: sweet, sour, bitterness, salt, and umami (the taste of monosodium glutamate). Out of these, the tastes of sour and salt are perceived by ion channels, mainly proton-gated ion channels in sour (Ugawa et al. 1998; Stevens et al. 2001) and sodium-gated ion channels in salt perception (Kretz et al. 1999; Lin et al. 1999). On the other hand, the remaining three modalities of sweet, bitter, and umami are perceived by G protein–coupled receptor (GPCR) signaling pathways (Wong, Gannon, and Margolskee 1996). Two types of GPCR families are involved in these pathways: one is T1R which is associated with sweet and umami substances (Nelson et al. 2001; Li et al. 2002) and the other is T2R which is associated with bitter substances and is encoded by an intronless gene (Adler et al. 2000; Chandrashekar et al. 2000; Matsunami, Montmayeur, and Buck 2000). Like other sensory multigene families, such as olfactory and pheromone receptor genes, the bitter taste receptor (T2R) genes form a multigene family, but T2R genes are organized in tandem in a few chromosomal regions. From previous studies, it was shown that humans and mice have 36 and 41 T2R genes including 11 and 7 pseudogenes, respectively (Go et al. 2005), whereas chickens have only three functional genes (Hillier et al. 2004). These observations imply that extensive T2R gene expansions occurred in mammalian lineages or gene contractions took place somewhere in the lineage leading to chickens. Such dramatic repertoire changes that have resulted from gene expansions and contractions are conspicuous in the genes involved in immune functions such as Mhc and Ig (Nei, Gu, and Sitnikova 1997 and references therein) and sensory functions such as olfactory receptor genes (Young et al. 2002; Zhang and Firestein 2002; Gilad et al. 2004; Niimura and Nei 2005) and pheromone receptor genes (Zhang and Webb 2003; Grus and Zhang 2004; Grus et al. 2005; Young et al. 2005). Even in T2R genes, many gene expansions and contractions are found during primate evolution as a result of adaptation to rapidly changing environments (Wang, Thomas, and Zhang 2004; Fischer et al. 2005; Go et al. 2005). Here, I examine the repertoire of T2R genes in mammals (dogs, cows, and opossums), birds (chickens), amphibians (frogs), and fishes (zebrafishes and pufferfishes) by using available genome databases to understand the birth-and-death process of this gene family during vertebrate evolution.
Materials and Methods
Samples
The subjects of this study are the dog (C. familiaris), cow (B. Taurus), opossum (M. domestica), chicken (Gallus gallus), frog (X. tropicalis), zebrafish (D. rerio), and pufferfish (T. rubripes). Sequences from each species were retrieved from the Ensembl database (Species-Ensembl version 31): dog (Build 1; 7.6 × genome coverage), cow (Btau_1.0; 3 × coverage), opossum (BROAD0.5; 7.2 × coverage), chicken (Build 1d; 6.6 × coverage), frog (Build 1; 7 × coverage), zebrafish (Build 4b; 5.7 × coverage), and pufferfish (Built 2d; 5.7 × coverage).
Procedure of Gene Identification
To identify the repertoire of T2R genes in each animal, TBlastN searches were conducted on the dog, cow, opossum, and chicken genome databases by using 25 human and 34 mouse intact genes (Conte et al. 2002, 2003; Shi et al. 2003; Go et al. 2005) as queries with a cutoff E value of 10−10. Second, TBlastN searches were carried out to the amphibian and fish by using both 59 mammalian and three chicken intact T2R genes (Hillier et al. 2004) as queries with a cutoff E value of 10−5. Among hits obtained from TBlastN searches, those that have more than 270 amino acid sequences with a presumed start and stop codon (average intact T2R genes are ∼300 amino acids) were selected as candidates for intact T2R genes. The candidate sequences were then used for TBlastN searches on the human genome database (Build 35) and those which showed best hits to the human T2R genes were chosen as intact T2R genes. Subsequently, a third round of TBlastN searches was performed by using the newly identified intact T2R genes from the seven vertebrate species (dogs, cows, opossums, chickens, frogs, zebrafishes, and pufferfishes) as queries to obtain unidentified T2R genes. The procedures for identifying partial T2R genes and T2R pseudogenes are described in the legend of supplementary figure 1 (see Supplementary Material online). In this study, partial T2R genes, which lack either a presumed start codon, a stop codon, or both in the amino acid sequence, were assumed to be intact. All nucleotide T2R sequences used in this study are presented in supplementary figure 2 (see Supplementary Material online).
Data Analyses
The T2R sequences were aligned by ClustalX (Thompson et al. 1997) and the resulting alignment was manually adjusted. Phylogenetic trees were reconstructed by the Neighbor-Joining (NJ) (Saitou and Nei 1987) methods implemented in MEGA3 (Kumar, Tamura, and Nei 2004) with protein-Poisson distances (Nei and Kumar 2000). Each node of the phylogenetic trees was evaluated by 500 bootstrap replications (Felsenstein 1985). To date the pseudogenization events, all pseudogenes were also subjected to phylogenetic analysis by inferring the codon frames in the pseudogenes from those of closely related functional genes and conceptually translating to the amino acid sequence. To clarify the origin of each T2R genes under the assumption of molecular clock, a linearized tree was reconstructed after eliminating the T2R genes that evolve significantly faster or slower than the average rate (Takezaki, Rzhetsky, and Nei 1995).
Results and Discussion
T2R Genes in Mammals and Chickens
TBlastN searches were performed on the dog, cow, and opossum genome databases using 25 human and 34 mouse intact T2R genes as queries with a cutoff E value 10−10 (see also Materials and Methods and supplementary fig. 1). The results indicate 15 intact genes and four pseudogenes in dogs, 16 and 13 in cows, and 26 and 8 in opossums (table 1). The nucleotide length of intact mammalian T2R genes is from 876 to 1050 bp with the average being 933 bp and the amino acid sequence identity ranging from 19.1% to 89.1%. Due to incompleteness of the cow genome sequences, the total number of T2R genes in cows must be regarded as tentative. However, based on a comparison of syntenic regions among humans, mice, and dogs, the small number of dog T2R genes suggested that there must have been few lineage-specific expansions in this species (data not shown). Although gene conversion is a well-known phenomenon and plays an important role in homogenizing sequences in the genes from multigene families, no identifiable evidence was found for gene conversion, at least in mammalian T2R genes. After publication of the chicken draft genome sequence, TBlastN searches were again performed on those chicken sequences using 59 T2R genes in humans and mice and three in chickens as queries. The results showed that there are three intact T2R genes in chickens, which is consistent with the report from the previous chicken genome project (Hillier et al. 2004). The amino acid sequence identity in the three chicken T2R genes ranges from 24.1% to 35.2%. In addition, it is to be noted that there are no identifiable pseudogenes in the chicken genome.
Number of T2R Genes in Vertebrates
Species | Total | Full-Length | Partial | Pseudo | Reference |
|---|---|---|---|---|---|
| Homo sapiens (human) | 36 | 25 | 0 | 11 | Go et al. (2005) |
| Mus musulus (mouse) | 41 | 34 | 0 | 7 | Go et al. (2005) |
| Canis familiaris (dog) | 19 | 14 | 1 | 4 | This study |
| Bos Taurus (cow) | 29 | 11 | 5 | 13 | This study |
| Monodelphis domestica (opossum) | 34 | 25 | 1 | 8 | This study |
| Gallus gallus (chicken) | 3 | 3 | 0 | 0 | This study |
| Xenopus tropicalis (frog) | 54 | 48 | 1 | 5 | This study |
| Danio rerio (zebrafish) | 4 | 4 | 0 | 0 | This study |
| Takifugu rubripes (fugu) | 3 | 3 | 0 | 0 | This study |
Phylogeny of T2R Genes in Mammals and Chickens
To clarify the evolutionary history and relationships among mammalian and chicken T2R genes, the NJ tree was reconstructed on the basis of amino acid sequences of all T2R genes (36, human; 41, mouse; 19, dog; 27, cow; 33, opossum; 3, chicken) (fig. 1). The codon frame of two T2R pseudogenes in cows (Bota-T2R71p and -T2R72p) and one pseudogene in opossums (Modo-T2R32p) could not be determined due to their high sequence divergence; these three sequences were therefore excluded from the phylogenetic analysis. The evolutionary relationships are divided into two categories with respect to orthology. Category A (black lines in fig. 1) is defined as the orthologous gene set that has no extra copies in any species examined in this study. On the other hand, category B (gray lines in fig. 1) is defined such that at least one mammalian species has multiple copies that have resulted from lineage-specific gene duplications. The orthologous relationships of each T2R gene are summarized in table 2. Most of the genes (11/13) that are classified into the category of holding one-to-one orthologous relationships in the previous human and mouse comparison (category C in Go et al. 2005) are also classified into the category A in this study. This indicates that duplicability (the ability of loci to be duplicated) appears to be unchanged throughout vertebrate evolution. Two exceptional cases are T2R3 and T2R7 gene groups in which multiple duplication events occurred in the opossum lineage and led to 10 T2R3 and 3 T2R7 human orthologous genes (fig.1 and table 2). In contrast for category B, the top clade in figure 1, which was referred to as the “T2R43 group” in the previous study (Go et al. 2005), shows extensive gene expansions in all placental mammals (14 T2R genes in humans, 22 in mice, 2 in dogs, and 5 in cows). In addition, there are three clades that exhibit a lineage-specific expansion in opossum lineages; two of them are Hosa-T2R3 and -T2R7 orthologous genes as mentioned earlier and the third one consists of 11 T2R genes with no orthologous gene in other mammals (table 2). These observations suggest that all mammals have both conserved orthologous gene groups (category A), which might be important for detecting common bitter substances, and specialized ones (category B), which could play a role for detecting species-specific bitter substances.
Phylogenetic tree of the bitter taste receptor (T2R) amino acid sequences in humans (Hosa; blue), mice (Mumu; red), dogs (Cafa; green), cows (Bota; pink), opossums (Modo; light blue), and chickens (Gaga; black). The NJ tree was constructed by using the protein-Poisson distances, and only more than 50% bootstrap values are shown at each node (500 replications). Pseudogenes are indicated with the letter ‘p’ after the gene name. The codon frames in the pseudogenes were inferred from those of closely related functional genes. Category A is defined to be the single gene orthologous groups without lineage-specific duplication and the definition of category B is any gene group which has multiple copies resulted from lineage-specific duplications. The mouse V1Ra1 gene was used as an outgroup but was excluded from the figures.
Orthologous Relationships of Each T2R Genes and Their Origin
Category | Human | Mouse | Dog | Cow | Opposum | Chicken | Origin |
|---|---|---|---|---|---|---|---|
| A | Hosa-T2R1 | Mumu-T2R41 | Cafa-T2R1 | Bota-T2R1 | Modo-T2R1 | >310 MYA | |
| A | Hosa-T2R2p | Mumu-T2R1 | Cafa-T2R2 | Bota-T2R2p | Modo-T2R2 | >310 MYA | |
| B | Hosa-T2R3 | Mumu T2R3 | Cafa-T2R3 | Bota-T2R3 | Modo-T2R3A | 160–310 MYA | |
| Modo-T2R3Bp | |||||||
| Modo-T2R3Cp | |||||||
| Modo-T2R3D | |||||||
| Modo-T2R3Ep | |||||||
| Modo-T2R3F | |||||||
| Modo-T2R3G | |||||||
| Modo-T2R3H | |||||||
| Modo-T2R3Ip | |||||||
| Modo-T2R3J | |||||||
| A | Hosa-T2R4 | Mumu-T2R4 | Cafa-T2R4 | Bota-T2R4 | Modo-T2R4 | >310 MYA | |
| B | Hosa-T2R5 | Cafa-T2R5 | Bota-T2R5p | >310 MYA | |||
| Hosa-T2R66p | |||||||
| B | Hosa-T2R7 | Mumu-T2R11 | Cafa-T2R7 | Modo-T2R7A | 160–310 MYA | ||
| Modo-T2R7B | |||||||
| Modo-T2R7Cp | |||||||
| A | Hosa-T2R8 | Cafa-T2R8p | Bota-T2R8p | 160–310 MYA | |||
| A | Hosa-T2R9 | Cafa-T2R9p | 160–310 MYA | ||||
| B | Hosa-T2R10 | Mumu-T2R12 | Cafa-T2R10 | Bota-T2R10A | 160– MYA | ||
| Mumu-T2R13 | Bota-T2R10B | ||||||
| Mumu-T2R14 | Bota-T2R10C | ||||||
| Mumu-T2R15 | Bota-T2R10Dp | ||||||
| Mumu-T2R16 | |||||||
| A | Hosa-T2R11p | Bota-T2R11p | 160–310 MYA | ||||
| A | Hosa-T2R12p | Mumu-T2R19 | Cafa-T2R12 | Bota-T2R12 | 160–310 MYA | ||
| B | Hosa-T2R13 | Mumu-T2R18 | Bota-T2R13 | 80–160 MYA | |||
| Mumu-T2R21 | |||||||
| Mumu-T2R22 | |||||||
| B | Hosa-T2R14 | Mumu-T2R20 | 80–160 MYA | ||||
| Mumu-T2R24p | |||||||
| Mumu-T2R25p | |||||||
| Mumu-T2R26 | |||||||
| Mumu-T2R27 | |||||||
| Mumu-T2R28 | |||||||
| Mumu-T2R29 | |||||||
| Mumu-T2R30p | |||||||
| Mumu-T2R31 | |||||||
| Mumu-T2R32p | |||||||
| Mumu-T2R33 | |||||||
| Mumu-T2R35 | |||||||
| Mumu-T2R36p | |||||||
| Mumu-T2R37p | |||||||
| Mumu-T2R38 | |||||||
| Mumu-T2R39 | |||||||
| Mumu-T2R40p | |||||||
| B | Hosa-T2R15p | Mumu-T2R17 | Cafa-T2R43 | Bota-T2R43p | 80–160 MYA | ||
| Hosa-T2R43 | Mumu-T2R23 | Cafa-T2R44p | Bota-T2R44 | ||||
| Hosa-T2R44 | Bota-T2R45p | ||||||
| Hosa-T2R45 | Bota-T2R46 | ||||||
| Hosa-T2R46 | Bota-T2R47p | ||||||
| Hosa-T2R47 | |||||||
| Hosa-T2R48 | |||||||
| Hosa-T2R49 | |||||||
| Hosa-T2R50 | |||||||
| Hosa-T2R63p | |||||||
| Hosa-T2R64p | |||||||
| Hosa-T2R68p | |||||||
| A | Hosa-T2R16 | Mumu-T2R2 | Bota-T2R16 | 160–310 MYA | |||
| A | Hosa-T2R38 | Mumu-T2R5 | Cafa-T2R5 | Modo-T2R5 | >310 MYA | ||
| A | Hosa-T2R39 | Mumu-T2R6 | Cafa-T2R39 | Bota-T2R39 | Modo-T2R39 | 160–310 MYA | |
| A | Hosa-T2R40 | Mumu-T2R7 | Cafa-T2R40 | Bota-T2R40p | Modo-T2R40 | Gaga-T2R1 | 160–310 MYA |
| A | Hosa-T2R41 | Mumu-T2R10 | Cafa-T2R41 | Bota-T2R41 | Modo-T2R41 | 160–310 MYA | |
| A or B | Hosa-T2R55 | Mumu-T2R34 | Cafa-T2R55 | 80–310 MYA | |||
| A | Hosa-T2R56 | Mumu-T2R9 | Bota-T2R56 | Modo-T2R56 | 160–310 MYA | ||
| A | Hosa-T2R62p | Mumu-T2R8 | Cafa-T2R62p | Bota-T2R62p | Modo-T2R62 | 160–310 MYA | |
| B | Hosa-T2R65p | Bota-T2R65A | 80–160 MYA | ||||
| Bota-T2R65Bp | 0–310 MYA | ||||||
| A | Hosa-T2R67p | Cafa-T2R67 | Bota-T2R67 | 80–160 MYA | |||
| B | Modo-T2R21 | 0–310 MYA | |||||
| Modo-T2R22 | |||||||
| Modo-T2R23 | |||||||
| Modo-T2R24 | |||||||
| Modo-T2R25 | |||||||
| Modo-T2R26 | |||||||
| Modo-T2R27 | |||||||
| Modo-T2R28 | |||||||
| Modo-T2R29 | |||||||
| Modo-T2R30p | |||||||
| Modo-T2R31p | |||||||
| — | Gaga-T2R2 | >310 MYA | |||||
| — | Gaga-T2R3 | >310 MYA | |||||
| Unknown | Bota-T2R71p | ||||||
| Unknown | Bota-T2R72p | ||||||
| Unknown | Modo-T2R32p | ||||||
| Total | 36 (25, 11) | 41 (34, 7) | 19 (15, 4) | 29 (16, 13) | 34 (26, 8) | 3 (3, 0) |
NOTE.—The origins of each T2R genes were estimated from the linearized trees and each T2R orthologous relationships. Pseudogenes are represented by italics.
The phylogenetic positions of three chicken T2R genes (Gaga-T2R1, -T2R2, and -T2R3) are depicted with black letters in figure 1. The Gaga-T2R1 gene has a monophyletic relationship with the T2R39 and T2R40 gene groups (fig. 1) and it is thought that Gaga-T2R1 is an orthologous gene to the T2R39 and T2R40 gene groups. On the other hand, given the phylogenetic topology and genetic distance, it is possible that neither Gaga-T2R2 nor -T2R3 have any orthologous gene in mammals. Also, as a logical outcome, all mammalian T2R genes except for the T2R39 and T2R40 gene groups do not show any orthologous relationships to chicken T2R genes. These results suggest that the T2R repertoire is quite different between mammals and chickens.
T2R genes appear to result from gene expansions in mammals (Hillier et al. 2004). However, this assumption should be carefully examined by evolutionary relationships between mammal and chicken T2R genes. To show the origin and orthologous relationships of each T2R gene, the linearized tree was reconstructed after eliminating the T2R genes that evolve significantly faster or slower than the average rate (fig. 2). Among human and chicken intact T2R genes, four T2R genes (Hosa-T2R3, Hosa-T2R7, Hosa-T2R9, and Gaga-T2R2) showed a deviation from the average rate at a 5% significance level. As mentioned earlier, because Gaga-T2R1, and Hosa-T2R39 and -T2R40 probably have an orthologous relationship, the divergence point or speciation point between humans and chickens can be estimated at the dotted line in the linearized tree (fig. 2). According to the linearized tree, the assumption of gene expansions in mammalian lineages is likely to be true for the case of the lineage-specific gene duplications (those genes are classified into category B in fig. 1). However, several gene duplications (white diamonds in fig. 2) occurred before the divergence between mammals and birds/reptiles (dotted line in fig. 2). In other words, many orthologous gene sets already existed ∼310 MYA at the time of divergence between mammals and birds/reptiles (Benton 1997; Hedges 2002) and the number of pre-existing orthologous gene sets before the mammal and bird/reptile divergence can be estimated as 10∼11 from the linearized tree (black circles in fig. 2). It can therefore be concluded that chickens have lost many orthologs to mammal T2R genes. In summary, the repertoire of mammalian T2R genes has been formed through continuous gene expansions that have started before the divergence from birds/reptiles (≳310 MYA). As for chicken T2R genes, gene contractions subsequent to the first round of gene expansions appear to have made the chicken T2R repertoire narrow.
Linearized tree for human and chicken T2R genes after eliminating the genes that evolve significantly faster or slower than the average rate by the result of a branch length test (Takezaki, Rzhetsky, and Nei 1995). The dotted line corresponds to the divergence time between humans and chickens and the black circles indicate the ancestral T2R genes at the divergence point between humans and chickens. The estimated divergence points of the eliminated genes and all pseudogenes from humans and chickens are depicted as dotted arrowheads. The white diamonds represent the gene duplication events. The mouse V1Ra1 gene was used as an outgroup.
T2R Genes in Amphibians
By using 62 intact T2R genes detected in humans, mice, and chickens as queries, I identified 49 intact T2R genes and 5 pseudogenes in frogs. All of these were confirmed as T2R genes by reciprocal best-hit blast analyses to the human genome. The frog T2R amino acids sequences have similarity from 13.9% to 99.5% and the lengths range from 870 to 1008 bp with the average being 919 bp. The phylogenetic tree of 25 human, 34 mouse, 3 chicken, and 49 frog intact T2R genes shows that mammals and amphibians have different repertoires of T2R genes, indicating independent origins of mammal and amphibian T2R genes (fig. 3).
Phylogenetic tree of T2R based on amino acid sequences. Genes from mammals (humans and mice) and amphibians (frogs) are shown in gray and black, respectively. The positions of chicken T2R genes are highlighted with asterisks. The tree was reconstructed by the NJ method based on the protein-Poisson distances, and only bootstrap values greater than 50% are shown at each node (500 replications).
T2R Genes in Fishes
TBlastN searches detected four putative T2R genes in zebrafishes and three in pufferfishes. The nucleotide length and amino acid sequence similarity among fish T2R genes range from 918 to 963 bp and from 12.8% to 79.1%, respectively. Due to close relationships and similar sequences between T2R and V1R genes, one of the two types of pheromone receptor gene families, it would be difficult to annotate the candidate sequences as T2R genes with certainty. This is also consistent with the low bootstrap value for supporting the monophyletic relationship of mammals and fish T2R genes in the phylogenetic tree constructed from vertebrate T2R and V1R genes (fig. 4). However, it should be noted that both zebrafishes and pufferfishes are known to have only one copy of the V1R gene (Pfister and Rodriguez 2005) and their positions on the phylogenetic tree are much more closely related to mouse V1R genes (fig. 4). It is therefore likely that the seven candidate sequences (four from zebrafishes and three from pufferfishes) might be T2R genes, although functional analyses are necessary before reaching any definite conclusions.
The NJ tree of T2R and V1R based on amino acid sequences. Genes from mice are represented in gray letters and ones from fishes (zebrafishes and pufferfishes) are shown with black letters and highlighted with a gray box.
History of T2R Genes in Vertebrates
Using the results obtained from our survey of vertebrate genome sequences, the history of T2R genes is reconstructed and summarized in figure 5. According to the phylogenetic analysis in figure 4, there might be only a few ancestral T2R genes at the incipient stage of vertebrate evolution (∼450 MYA), and through the evolutionary history in the lineage leading to the fish, this number of T2R genes did not change very much. About ∼360 MYA, at the divergence time between amphibians and amniotes (Hedges 2002), there might have still been only a few T2R genes in the genome because the origin of most T2R genes in amphibians and amniotes postdates the divergence time between these two groups (fig. 3). However, in the lineage leading to amphibians, it appears that extensive gene expansions have occurred and the number of T2R genes has greatly increased from a few to ∼50 (fig. 3). Also, the linearized tree showed that the T2R repertoire has extensively expanded to harbor some 10 genes in the lineage of the common ancestors of amniotes, from 360 MYA to 310 MYA (fig. 2). After this initial expansion, however, the T2R repertoire contracted in the chicken lineage and the number of genes decreased to only three in the present chicken genome. In the lineage leading to mammals, on the contrary, the number of genes continuously increased (the numbers of ancestral T2R genes at each node were estimated by the linearized trees as shown in the human and chicken comparison), and after the mammalian radiation, lineage-specific expansions have extensively taken place in each mammalian species, leading to 30–40 genes in each species, except for dogs. Most members of the order Carnivora including dogs are either carnivorous or omnivorous (Ray et al. 2005) and these feeding habits might make the T2R repertoire relatively narrow in dogs. Bitter taste perception is thought to be essential for animals in avoiding toxic and harmful substances, and it can therefore serve as a good model to elucidate how the repertoire of such chemosensory receptor genes are affected by environmental factors. To further investigate this idea, the T2R gene repertoire should be examined from a vast array of animals with different feeding habitats.
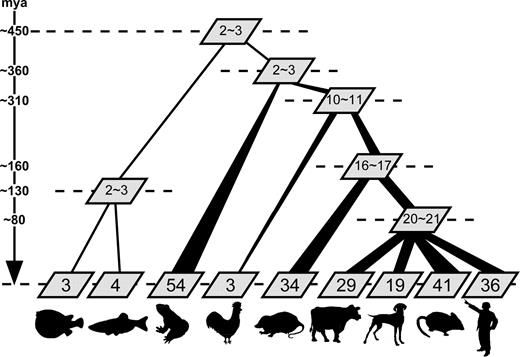
Evolutionary dynamics of vertebrate T2R gene repertoires. The numbers in each box indicate the total number of T2R genes. The numbers of ancestral genes at each node were estimated based on the linearized trees as described in figure 2.
Why Have Chickens Lost T2R Genes?
Although it is almost infeasible to show direct evidence for the cause of T2R gene contractions in chickens, it is tempting to speculate that the contraction is related to genome size reductions in chickens. To know the history of genome size transitions and determine the time of genome size reduction in the lineage leading to chickens, I collected vertebrate genome size data using the available database (Animal Genome Size Database available at http://www.genomesize.com/) and calculated the average genome size in each taxon. The results are summarized in table 3. While terrestrial vertebrates except birds have a genome size of roughly 3 pg (total amount of DNA in the haploid genome, also known as the C-value), the genome size of most birds is less than 2 pg except for ostriches (2.16 pg) with the average being 1.43 ± 0.17 pg from 243 avian species. Specifically, because crocodilians and perhaps also turtles are thought to be the closest living relatives to birds (Janke and Arnason 1997; Kumazawa and Nishida 1999) and both groups have a genome size of approximately 3 pg, the size reduction most likely happened before the origin of present birds (>120 MYA; van Tuinen and Hedges 2001) but after the divergence from crocodilians (<250 MYA; Janke and Arnason 1997). It is therefore likely that the repertoire of avian T2R genes contracted concomitantly with the genome size reduction and no subsequent gene expansions have occurred in the bird lineage. The latter speculation is supported by evidence of no identifiable T2R pseudogenes in the chicken genome. This is consistent with the general trend that the more gene duplications occur, the more pseudogenes are found in a multigene family (Nei, Gu, and Sitnikova 1997). Conversely speaking, there is no or little duplicability in the bird genome and this trend is conspicuously different from that of mammal and amphibian T2R genes, in which extensive gene expansions are still ongoing.
Genome Size (pg) in Vertebrates
Number of Species | Average ± S.D. | ||
|---|---|---|---|
| Mammals | 508 | 3.41 ± 0.76 | |
| Birds | Chickens | 1 | 1.25 |
| Quails | 1 | 1.35 | |
| Curassows | 1 | 1.23 | |
| Geese | 20 | 1.34 ± 0.14 | |
| Penguins | 1 | 1.63 | |
| Oscines | 38 | 1.38 ± 0.17 | |
| Rolleres | 10 | 1.43 ± 0.16 | |
| Cuckoos | 1 | 1.22 | |
| Ostriches | 1 | 2.16 | |
| Rheas | 1 | 1.59 | |
| Reptiles | Crocodilians | 8 | 3.07 ± 0.55 |
| Turtles | 59 | 2.89 ± 0.71 | |
| Lizards | 209 | 2.18 ± 0.64 | |
| Snakes | 114 | 2.14 ± 0.51 | |
| Amphibians | 1 | 3.08 |
NOTE.—Genome size (pg) is measured by the total amount of DNA in the haploid genome (C-value).
Although we cannot address the issue precisely due to the incompleteness of reptile genome sequences, if genome size reduction is one cause for reduction of the T2R repertoire in chickens, there should be several or more than 10 T2R genes in the reptile genome. The T2R repertoire in reptiles should therefore be examined in order to elucidate further the evolutionary histories of vertebrate T2R genes.
Conclusion
In this study, it was revealed that great variation exists among the T2R repertoires of vertebrates, from a few T2R genes in chickens and fishes to 20∼50 genes in mammals and amphibians. To comprehend the history of gene expansions and contractions (birth-and-death mode of evolution), phylogenetic analyses were performed and showed only one chicken T2R ortholog in mammals and no apparent mammalian orthologs in amphibians and fishes. After a precise analysis of the tempo and mode of evolution for each T2R gene, I concluded that continuous gene expansions have shaped the T2R repertoire in mammals, but gene contractions subsequent to the first expansions have made the chicken T2R repertoire narrow. These dramatic repertoire changes might reflect different evolutionary processes and different selective pressures in each organism in concert with ever-changing environments.
Marta Wayne, Associate Editor
The author thanks Naoyuki Takahata, Yoko Satta, and John Novembre for numerous discussions and helpful comments on the manuscript. This study was supported by the Japanese Society for Promotion of Science (JSPS) grant no. 17-02667 (to Y. G.).
References
Adler, E., M. A. Hoon, K. L. Mueller, J. Chandrashekar, N. J. Ryba, and C. S. Zuker.
Chandrashekar, J., K. L. Mueller, M. A. Hoon, E. Adler, L. Feng, W. Guo, C. S. Zuker, and N. J. Ryba.
Conte, C., M. Ebeling, A. Marcuz, P. Nef, and P. J. Andres-Barquin.
———.
Felsenstein, J.
Fischer, A., Y. Gilad, O. Man, and S. Pääbo.
Gilad, Y., V. Wiebe, M. Przeworski, D. Lancet, and S. Pääbo.
Go, Y., Y. Satta, O. Takenaka, and N. Takahata.
Grus, W. E., P. Shi, Y. P. Zhang, and J. Zhang.
Grus, W. E., and J. Zhang.
Hillier, L. W., W. Miller, E. Birney et al. (176 co-authors).
Janke, A., and U. Arnason.
Kretz, O., P. Barbry, R. Bock, and B. Lindemann.
Kumar, S., K. Tamura, and M. Nei.
Kumazawa, Y., and M. Nishida.
Li, X., L. Staszewski, H. Xu, K. Durick, M. Zoller, and E. Adler.
Lin, W., T. E. Finger, B. C. Rossier, and S. C. Kinnamon.
Matsunami, H., J. P. Montmayeur, and L. B. Buck.
Nei, M., X. Gu, and T. Sitnikova.
Nei, M., and S. Kumar.
Nelson, G., M. A. Hoon, J. Chandrashekar, Y. Zhang, N. J. Ryba, and C. S. Zuker.
Niimura, Y., and M. Nei.
Pfister, P., and I. Rodriguez.
Ray, J., K. Redford, R. Steneck, and J. Berger.
Saitou, N., and M. Nei.
Shi, P., J. Zhang, H. Yang, and Y. P. Zhang.
Stevens, D. R., R. Seifert, B. Bufe, F. Muller, E. Kremmer, R. Gauss, W. Meyerhof, U. B. Kaupp, and B. Lindemann.
Takezaki, N., A. Rzhetsky, and M. Nei.
Thompson, J. D., T. J. Gibson, F. Plewniak, F. Jeanmougin, and D. G. Higgins.
Ugawa, S., Y. Minami, W. Guo, Y. Saishin, K. Takatsuji, T. Yamamoto, M. Tohyama, and S. Shimaria.
van Tuinen, M., and S. B. Hedges.
Wang, X., S. D. Thomas, and J. Zhang.
Wong, G. T., K. S. Gannon, and R. F. Margolskee.
Young, J. M., C. Friedman, E. M. Williams, J. A. Ross, L. Tonnes-Priddy, and B. J. Trask.
Young, J. M., M. Kambere, B. J. Trask, and R. P. Lane.
Zhang, J., and D. M. Webb.
