


Abstract
We examined the gene structure of a set of 2563 Arabidopsis thaliana paralogous pairs that were duplicated simultaneously 20–60 MYA by tetraploidy. Out of a total of 23,164 introns in these genes, we found that 10,004 pairs have been conserved and 578 introns have been inserted or deleted in the time since the duplication event. This intron insertion/deletion rate of 2.7 × 10⁻³ to 9.1 × 10⁻⁴ per site per million years is high in comparison to previous studies. At least 56 introns were gained and 39 lost based on parsimony analysis of the phylogenetic distribution of these introns. We found weak evidence that genes undergoing intron gain and loss are biased with respect to gene ontology terms. Gene pairs that experienced at least 2 intron insertions or deletions show evidence of enrichment for membrane location and transport and transporter activity function. We do not find any relationship of intron flux to expression level or G + C content of the gene. Detection of a bias in the location of intron gains and losses within a gene depends on the method of measurement: an intragene method indicates that events (specifically intron losses) are biased toward the 3′ end of the gene. Despite the relatively recent acquisition of these introns, we found only one case where we could identify the mechanism of intron origin—the TOUCH3 gene has experienced 2 tandem, partial, internal gene duplications that duplicated a preexisting intron and also created a novel, alternatively spliced intron that makes use of a duplicated pair of cryptic splice sites.
Introduction
The origin and evolution of introns in eukaryotic genomes has been hotly debated for many years. Central to these arguments is the question of how abundant intron gains and losses are. The evolution of introns is influenced by both mutation bias and selection. Intron length and intron number often appear to be affected independently. Mutation biases may cause positional biases of introns within a gene (Mourier and Jeffares [2003] proposed greater intron loss from the 3′ ends of genes in intron-poor genomes, however, Nielsen et al. [2004] found conflicting results) and within a genome (long introns are rare in G + C–rich regions; Duret et al. 1995). The selective effects of introns may be positive (facilitation of exon shuffling; Fedorov, Roy, Cao, Gilbert 2003) or negative (additional transcriptional cost; Jeffares et al. 2006). Recently, it was shown that introns in Arabidopsis are shortened by selection for transcriptional efficiency (Seoighe et al. 2005) mirroring a result found in other genomes (Castillo-Davis et al. 2002). However, Lynch has argued that evolution of gene structure elements such as introns can be explained by neutral or nearly neutral evolution (Lynch 2002, 2006).
Most previous studies of intron gain and loss have focused on identifying the prototypic gene structure in early eukaryotes and have thus examined this phenomenon in very distantly related eukaryotic genomes (some recent examples of large-scale studies include: Rogozin et al. 2003; Qiu et al. 2004; Rogozin et al. 2005; Roy and Gilbert 2005a). These broadly similar studies have returned strikingly different conclusions from an intron-rich ancestor with a preponderance of intron loss (Roy and Gilbert 2005a) to a less intron-dense animal–plant ancestor, with gains outnumbering losses (Rogozin et al. 2003). The different outcomes are probably due to differing assumptions about the properties of intron gain sites (Nguyen et al. 2005; Rogozin et al. 2005) or to different patterns of evolution in different lineages (Nielsen et al. 2004; Roy and Gilbert 2006). Indeed, a reanalysis of the Rogozin et al. (2003) data by Roy and Gilbert (2005b) using maximum likelihood methods instead of parsimony concluded that intron loss, and not gain, had dominated their evolution. Recently, Roy and Gilbert (2005a) estimated the rate of intron loss and gain to be 2 × 10⁻³ to 2 × 10⁻⁴ per million years and 6 × 10⁻⁷ to 4 × 10⁻⁶ per site per million years, respectively, based on comparisons across diverse eukaryotic lineages.
Studies of intron gain and loss in more recently diverged genomes include mammals (Roy et al. 2003), Caenorhabditis (Coghlan and Wolfe 2004), and fungi (Nielsen et al. 2004). In a comparison of human and rodent introns, Roy et al. (2003) uncovered only loss events. The Coghlan and Wolfe (2004) study searched only for gain events and found evidence for 122 newly inserted introns that originated in the 80–110 Myr that separate Caenorhabditis elegans and Caenorhabditis briggsae. Nielsen et al. (2004) examined the patterns of intron evolution in fungi and uncovered a combination of intron loss and gain events.
The genome of the model plant Arabidopsis thaliana provides an ideal data set for examining intron gain and loss. Mounting evidence supports the occurrence of at least one, and likely multiple, whole-genome duplication events in the Arabidopsis lineage (Arabidopsis Genome Initiative 2000; Blanc et al. 2000; Paterson et al. 2000; Vision et al. 2000; Simillion et al. 2002; Blanc et al. 2003; Bowers et al. 2003; Blanc and Wolfe 2004). The most recent of these genome duplication events is the most unequivocal, having generated a set of large “blocks” of duplicated genes that cover almost the entire genome with no overlap between blocks (Blanc et al. 2003; Bowers et al. 2003). Subsequent to the whole-genome duplication, many duplicated genes were lost and only approximately 2000 genes remain in duplicate today. The genes retained in duplicate are not a random sample of all genes and are biased for genes with a function in transcriptional regulation (Seoighe and Gehring 2004).
Here we analyze the set of paralogous pairs of genes generated by this recent genome duplication for evidence of intron gain and loss in the period since the duplication event. These genes were all duplicated simultaneously and by the same mechanism. At the time of duplication, both paralogs had identical gene structures. This is not necessarily the case for paralogs that have duplicated by other means, for example, retrocopied genes (which are generated by the reverse transcription of mRNA and insertion of the cDNA into the genome) are usually completely devoid of introns at the time of duplication. We estimate the rates of intron loss and gain and test for a relationship with other properties of the genes concerned, such as expression level, G + C content, intragenic location, and function.
Methods
Duplicated Arabidopsis Genes
The sequences of the set of genes duplicated in the most recent whole-genome duplication as described by Blanc et al. (2003) were obtained from GenBank. One gene, At1g52000, was present in more than one duplicated pair and was excluded from further study. Sequences currently annotated as pseudogenes were also excluded. In 9 cases, the locus id had changed since the Blanc et al. (2003) study, and we replaced the old locus id with that of the gene with identical sequence and location (determined by shared adjacency with at least one gene). The full list of gene pairs is available in Supplementary Table 1 (Supplementary Material online).
Identification of Nonconserved Introns
A total of 2563 Arabidopsis paralogs generated by a recent whole-genome duplication were aligned at the protein level using T-Coffee version 1.32 with default parameters (Notredame et al. 2000). For each of the pair, we identified the positions in the alignment corresponding to the intron splice site locations of each of the 23,164 introns in these genes.
The quality of the alignment around the intron splice site was evaluated by examining 10 alignment positions on each side of the splice site following the methods of Coghlan and Wolfe (2004). An unambiguous alignment region was defined as one with at least 5 conserved amino acids and no alignment gaps in the 10 alignment positions on each side of the splice site (20 positions in total). An intron was conserved if the location and phase were identical in the alignment of the two paralogs and if there were no other introns within 5 amino acids of this position on either side. An intron was classified as nonconserved if there was no intron in the paralog in an identical position or within 5 amino acids in the alignment. Cases where the alignment was ambiguous, intron location but not phase was conserved, or where there was another intron within 5 amino acids on either side of the splice site were ambiguous and were excluded from further analysis.
Detection and Alignment of Plant Homologous Sequences
All Arabidopsis sequence pairs with at least one nonconserved intron were used as queries in a Blast search against genomic DNA of the Viridiplantae division of GenBank. The database was searched using TblastN with an expectation (e) value threshold of 1 × 10⁻⁴ and only retaining hits with an e value within a range of 1 × 10⁻⁵ from the top non-A. thaliana hit. Some of the retrieved hits were very long (e.g., entire chromosomes) which may feasibly contain more than one genuine homolog. For each hit, all of the high scoring pairs with e values below the threshold were selected.
The Blast search returned many sequence fragments that did not align with the whole Arabidopsis gene or with the region surrounding the intron. These short fragments negatively affect the quality of the sequence alignment produced by automated methods. We implemented an iterative protocol to remove poorly aligned sequences and sequences that did not span the area of interest (i.e., the region of the intron) as follows. Retrieved similar sequences were initially aligned to the already aligned Arabidopsis pair using T-Coffee. In the first iteration, retrieved sequences that did not have at least 5 aligned bases in 30 bp on either side of the intron splice site were removed, and the remaining sequences were realigned. The resulting alignment was reexamined, sequences with fewer than 10 aligned bases within 30 bp of the intron were removed and the sequences were realigned. In the third iteration, only sequences with 15 aligned bases within 30 bp of the intron position were retained. In each case, the 30-bp window is offset by 10 bp on each side to avoid the immediate region of the splice site that has a tendency to align poorly if there is an intron in one of the sequences (i.e., the splice site region aligns completely to one side or the other and not partially on each side of the intron as would be expected). A final alignment was produced for each of the nonconserved Arabidopsis introns and remaining homologous sequences.
Identification of Homologous Introns
An homologous intron was identified from an alignment as a stretch of at least 40 bp aligned between the −6 and +6 Arabidopsis intron splice site nucleotides and aligned with gaps in the Arabidopsis gene lacking the intron, that is, requiring that the intron is at least 28 bp long. We required that 10 base pairs on both sides of the splice site region (from −15 to −5 and from +5 to +15) should be aligned without gaps in order to unambiguously declare the presence or absence of a homologous intron. If one of the aligned sequences had gaps in this region, it was removed from the alignment. These “cleaned” alignments were used to construct a neighbor-joining tree for each nonconserved intron with ClustalW (Thompson et al. 1994) using Kimura's correction for multiple hits and ignoring positions with gaps.
Similarity of Introns and Other Regions of the Arabidopsis Genome
We used Blast to search with the sequence of all nonconserved introns against the genome of A. thaliana without filtering low complexity regions and with an e value threshold of 1. In order to recover any hits that might be missed by the Blast method, we also used SSearch with the threshold set to 0.1 and default parameters (Pearson 1996). We discarded the self-hits and those hits with a length of less than 50% of the query sequence, this removed most of the hits due to repeats in the sequence. In order to remove those hits that were due to a large-scale duplication (whole-gene duplication or segmental genome duplication), we removed hits where the similarity extended for long regions outside the intron sequence.
Expression Level Differences Between Genes with Gained and Lost Introns
Affymetrix data from 11 microarrays corresponding to expression levels in leaf (3), stem (4), and root (4) for growth in two different conditions—greenhouse and growth chamber—were downloaded from the Geo Web site (http://www.ncbi.nlm.nih.gov/projects/geo). All the genes for which we had expression data were classified into 10 equal-sized expression categories. The data from the same tissue in the equal growth conditions were pooled before analysis.
Using only those genes in which all introns had been classified as gained, lost, or conserved, we examined if those genes with gained or lost introns were more abundant in certain expression categories using a chi-squared test.
Distribution of Gains and Losses Along the Coding Sequence
Intergene Method
All introns were classified into 10 different location categories according to their relative position along the cds of the gene. Category 1 indicates that the intron was in a position between 0% and 10% of the length of the gene, category 2 indicates that the intron was in a position 11–20% along the gene, etc. We examined if there was any significant difference in the distribution along the coding sequence between gained, lost, and conserved introns using a chi-squared test.
Intragene Method
The intragenic location of intron gains and losses was also examined on a per gene basis as per the method of Lin and Zhang (2005). Each gene was classified as one of unbiased, 5′ biased, or 3′ biased based on the relative number of introns in the 5′ or the 3′ half of the gene. The null expectation is that the number of genes with a 5′ bias should equal the number with a 3′ bias, and this was tested using a chi-squared test. This was done separately for all nonconserved introns (in 486 genes), for gained introns, and for lost introns.
Examination of Functional Bias in Gene with Nonconserved Introns
GOslim annotation data for the genes in the Arabidopsis genome were downloaded from The Arabidopsis Information Resource (TAIR) Web site (Berardini et al. 2004) on 10 December 2005. Each gene pair was assigned the combined GOslim terms of each of its genes.
For the purposes of this analysis, we excluded 636 gene pairs that contained no nonconserved introns and at least one ambiguous intron because we cannot be sure whether these are cases of conserved or nonconserved gene structure. This resulted in a set of 1927 gene pairs which we could definitively say did or did not experience an intron indel.
The expected frequencies of GOslim terms among the 281 gene pairs with at least one nonconserved intron were determined using simulations. We randomly sampled 281 gene pairs from the 1927 paralogous genes in our data set and noted the distribution of GOslim terms. This was repeated 100,000 times. The mean and standard deviation (SD) of the frequency of each GOslim term was calculated for the simulations and compared with the observed data. This procedure was repeated for the gene pairs with at least 2 and with at least 3 nonconserved introns. Correction for multiple tests was done in two alternative ways: Bonferroni correction and Benjamini–Hochberg correction (Benjamini and Hochberg 1995).
We performed another set of 100,000 simulations for genes with at least 1, 2, and 3 nonconserved introns correcting for number of introns in the gene pair. In the simulations, for each of the original 281 gene pairs, a gene pair was selected randomly from the list of pairs with at least one member of the selected pair having the same number of introns as one member of the original pair.
Results
Recent Changes in Arabidopsis Gene Structure
We examined 2563 paralogous Arabidopsis gene pairs as identified by Blanc et al. (2003) originating from the recent whole-genome duplication 20–60 MYA for changes in the presence or absence of introns. We aligned the paralogs using T-Coffee (Notredame et al. 2000) and compared the alignment locations of introns within each pair. We employed stringent criteria on the quality of the alignment as per Coghlan and Wolfe (2004), and only introns in unambiguous portions of the alignment were considered further (see Methods). Conserved introns were defined as those present at an identical alignment location in each paralog. Nonconserved introns are those with no intron in the corresponding location in the paralog or within a short distance of that location (see Methods).
We identified 10,004 pairs of introns that have been conserved in both Arabidopsis paralogs since the genome duplication, 578 nonconserved introns (Supplementary Table 2, Supplementary Material online), and 2578 ambiguous cases. The 578 nonconserved introns are the results of either intron gain into one paralog or loss from the other. We found 281 genes having one nonconserved intron each. An additional 115 gene pairs have experienced multiple intron indels in the time since duplication, 37 of which had 3 or more intron gains or losses (table 1).
Gene pairs with 3 or More Nonconserved Introns
Number of Introns | ||||||||
|---|---|---|---|---|---|---|---|---|
| Nonconserved | Conserved | Ambiguous | Gene A | Description | Gene B | Description | ||
| 9 | 0 | 3 | At3g09900 | Ras-related GTP-binding protein, putative | At5g03530 | Ras family GTP-binding protein | ||
| 7 | 10 | 1 | At2g21520 | SEC14 cytosolic factor, putative/phosphoglyceride transfer protein, putative | At4g39170 | SEC14 cytosolic factor, putative/phosphoglyceride transfer protein, putative | ||
| 6 | 0 | 1 | At3g48750 | Cell division control protein 2 homolog A (CDC2A) | At5g63610 | Protein kinase, putative | ||
| 6 | 0 | 1 | At1g15080 | Phosphatidic acid phosphatase family protein/PAP2 family protein | At2g01180 | Phosphatidic acid phosphatase family protein/PAP2 family protein | ||
| 5 | 6 | 2 | At4g28220 | NADH dehydrogenase related | At2g20800 | Pyridine nucleotide-disulphide oxidoreductase family protein | ||
| 5 | 38 | 0 | At1g80490 | WD-40 repeat family protein | At1g15750 | WD-40 repeat family protein | ||
| 5 | 0 | 9 | At4g17890 | Human Rev interacting-like family protein/hRIP family protein | At5g46740 | Ubiquitin-specific protease 21 (UBP21) | ||
| 5 | 26 | 0 | At4g02570 | Cullin family protein | At1g02980 | Cullin family protein | ||
| 5 | 0 | 5 | At1g76360 | Protein kinase, putative | At1g20650 | Protein kinase family protein | ||
| 4 | 12 | 1 | At1g30810 | Transcription factor jumonji (jmj) family protein/zinc finger (C5HC2 type) family protein | At2g34880 | Transcription factor jumonji (jmj) family protein/zinc finger (C5HC2 type) family protein | ||
| 4 | 0 | 4 | At3g55600 | Expressed protein | At2g39790 | Mitochondrial glycoprotein family protein/MAM33 family protein | ||
| 4 | 0 | 6 | At1g05900 | Endonuclease related | At2g31480 | Expressed protein | ||
| 4 | 32 | 0 | At1g30820 | CTP synthase, putative/UTP–ammonia ligase, putative | At2g34890 | CTP synthase, putative/UTP–ammonia ligase, putative | ||
| 3 | 2 | 6 | At4g38550 | Expressed protein | At2g20960 | Expressed protein | ||
| 3 | 4 | 10 | At5g46380 | Hypothetical protein | At4g18150 | Hypothetical protein | ||
| 3 | 24 | 3 | At1g55970 | Histone acetyltransferase 4 (HAC4) | At3g12980 | Histone acetyltransferase 5 (HAC5) | ||
| 3 | 0 | 2 | At1g09080 | Luminal binding protein 3 (BiP-3) (BP3) | At2g32120 | Heat shock protein 70 family protein/HSP70 family protein | ||
| 3 | 4 | 0 | At5g53400 | Expressed protein | At4g27890 | Nuclear movement family protein | ||
| 3 | 8 | 0 | At2g22660 | Glycine-rich protein | At4g37900 | Glycine-rich protein | ||
| 3 | 8 | 2 | At4g12030 | Bile acid–sodium symporter family protein | At4g22840 | Bile acid–sodium symporter family protein | ||
| 3 | 2 | 0 | At3g05960 | Sugar transporter, putative | At5g26340 | Hexose transporter, putative | ||
| 3 | 6 | 6 | At5g22650 | Histone deacetylase-related protein | At3g44750 | Histone deacetylase, putative (HD2A) | ||
| 3 | 0 | 1 | At5g66230 | Expressed protein | At3g51230 | Hypothetical protein | ||
| 3 | 2 | 3 | At5g06150 | Cyclin (cyc1b) | At3g11520 | Cyclin, putative (CYC2) | ||
| 3 | 12 | 0 | At5g40640 | Expressed protein | At3g27390 | Expressed protein | ||
| 3 | 24 | 10 | At1g73860 | Kinesin motor protein related | At1g18410 | Kinesin motor protein related | ||
| 3 | 18 | 0 | At4g26270 | Phosphofructokinase family protein | At5g56630 | Pyrophosphate-dependent phosphofructo-1-kinase–related protein | ||
| 3 | 12 | 0 | At4g12430 | Trehalose-6-phosphate phosphatase, putative | At4g22590 | Trehalose-6-phosphate phosphatase, putative | ||
| 3 | 0 | 2 | At1g74950 | Expressed protein | At1g19180 | Expressed protein | ||
| 3 | 14 | 2 | At1g11950 | Transcription factor jumonji (jmjC) domain-containing protein | At1g62310 | Transcription factor jumonji (jmjC) domain-containing protein | ||
| 3 | 4 | 3 | At1g01010 | No apical meristem (NAM) family protein | At4g01550 | No apical meristem (NAM) family protein | ||
| 3 | 20 | 0 | At5g27540 | GTP-binding protein-related | At3g05310 | GTP-binding protein related | ||
| 3 | 8 | 0 | At3g09840 | Cell division cycle protein 48 (CDC48A) (CDC48) | At5g03340 | Transitional endoplasmic reticulum ATPase related | ||
| 3 | 20 | 1 | At1g18870 | Isochorismate synthase, putative/isochorismate mutase, putative | At1g74710 | Isochorismate synthase 1 (ICS1)/isochorismate mutase | ||
| 3 | 0 | 1 | At4g26540 | Protein kinase family protein | At5g56040 | Leucine-rich repeat protein kinase, putative | ||
| 3 | 6 | 0 | At1g70710 | Endo-1,4-beta-glucanase(EGASE)/cellulase | At1g23210 | Glycosyl hydrolase family 9 protein | ||
| 3 | 10 | 3 | At2g18730 | Diacylglycerol kinase, putative | At4g30340 | Diacylglycerol kinase family protein | ||
Identification of Intron Gains and Losses
To distinguish intron gains from losses, we required genomic sequence data from homologous plant genes. We searched the Viridiplantae division of GenBank for similar flowering plant genomic DNA sequences spanning the intron position and aligned them to the Arabidopsis pair (see Methods). We again employed very stringent criteria on the quality of the sequence alignments. The most important criterion was the exclusion of alignments where there were gaps close to the intron position. These gaps may be indicative of poor alignment quality, thus making it impossible to confidently discern the presence or absence of an intron at the site of interest.
An intron was inferred to have originated in the common ancestor of all genes containing the intron. An intron gain was scored when the nonconserved intron was present only in one A. thaliana genome-duplication paralog and other paralogs of this gene that duplicated after the tetraploidy event (e.g., fig. 1A). Evidence for intron loss comes from the presence of an intron in the same location in any earlier diverging flowering plant gene (e.g., fig. 1B). We could confidently assign 56 intron gain events and 39 intron loss events (Supplementary Table 2, Supplementary Material online).
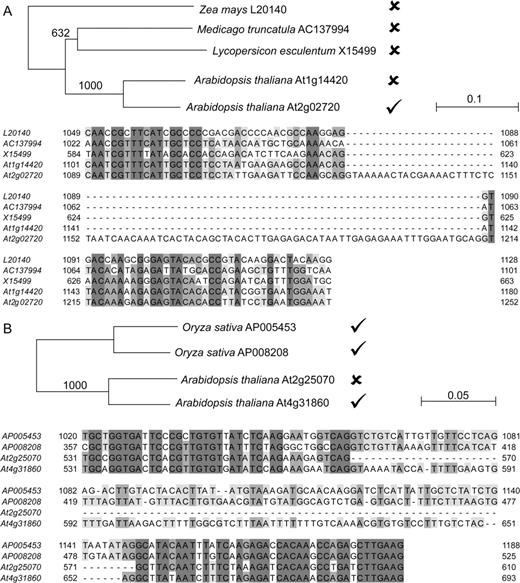
Neighbor-joining trees and sections of multiple sequence alignments of the genomic sequence of Arabidopsis paralogs that experienced intron indels and homologous plant genomic sequences. The presence or absence of the intron of interest is indicated on the tree by ticks and crosses, respectively. Bootstrap values (1000 replicates) are shown along branches. (A) The pectate lyase gene At2g02720 recently gained an intron. This intron is absent from all identified plant homologs. (B) The protein phosphatase type 2C gene At2g25070 lost an intron since the genome duplication in Arabidopsis. The intron is present in its Arabidopsis paralog as well as all identified plant homologs.
Intragenic Location of Intron Indels
Conflicting studies say that intron loss is (Mourier and Jeffares 2003) or is not (Nielsen et al. 2004) more prevalent in the 3′ ends of genes in intron-poor genomes. A recent study by Lin and Zhang (2005) reexamined this question in many eukaryotic genomes, including Arabidopsis, using a gene-by-gene method and found that all genomes analyzed display a significant 5′ bias in the location of introns in genes irrespective of intron density (although Arabidopsis showed the lowest bias).
When we examined the intron indels identified in this study using an intergene method similar to that of Nielsen et al. (2004), we did not find evidence for a bias in the intragenic location of gain and loss events, though they do appear to be more common in the middle of genes (see Supplementary Figures, Supplementary Material online). We also tested for bias in the location of intron indels using the intragene method of Lin and Zhang (2005) and found an excess of nonconserved introns in the 3′ end of genes—only 189 genes display a 5′ bias in the location of nonconserved introns compared with 273 genes that display a 3′ bias; P ≤ 0.001. The distribution of gained introns alone showed no significant bias. There were significantly more genes with a 3′ bias of lost introns compared with a 5′ bias (23 and 11 genes, respectively; P ≤ 0.05). However, if we exclude genes with at least one ambiguous intron (i.e., in a poorly aligned region or close to another intron), then there is no bias in the intragenic location of intron indels. The differences in the results from the two methods may be due to a greater robustness of the Lin and Zhang (2005) method to large variation in gene size because it only splits each gene into 2 location categories.
Relationship to Gene Expression and G + C Content
Previous studies have indicated that intron evolution is correlated with other genic and genomic features. Selection for transcriptional efficiency has led to the reduction in length (but not frequency) of introns in Arabidopsis and other eukaryotes (Castillo-Davis et al. 2002; Seoighe et al. 2005), and G + C–rich regions of vertebrate genomes have shorter introns on average (Duret et al. 1995). We examined whether these phenomena known to influence intron length also influence intron gain and loss. We searched for evidence of a relationship between intron gain or loss and gene expression level based on microarray data and found no difference between genes with gained, lost, or conserved introns. Similarly, we found no significant difference in the G + C content of genes containing introns with different fates (see Supplementary Figures, Supplementary Material online).
Function of Genes experiencing Intron Indels
We compared the function of pairs of genes with nonconserved introns with those that only contained conserved introns (and no ambiguous introns) using the GOslim Gene Ontology classifications from TAIR (Berardini et al. 2004). A summary of the results is presented in table 2. We did not consider gain and loss events separately because of low statistical power.
GO Categories Significantly Over or Underrepresented Among Gene Pairs Experiencing Intron Indels
Nonconserved Introns ≥1 (n = 281) | Nonconserved Introns ≥2 (n = 115) | Nonconserved Introns ≥3 (n = 37) | |||||||||||||
|---|---|---|---|---|---|---|---|---|---|---|---|---|---|---|---|
| Simulations | Simulations | Simulations | |||||||||||||
| GOslim term | Mean | SD | Obs | Mean | SD | Obs | Mean | SD | Obs | ||||||
| Biological process unknown | 122.29 | 8.20 | 96** | 35.50 | 4.81 | 22** | 11.43 | 2.80 | 7 | ||||||
| Chloroplast | 69.26 | 6.73 | 67 | 20.13 | 3.95 | 24 | 6.47 | 2.29 | 12* | ||||||
| Cytosol | 6.17 | 2.19 | 13** | 1.80 | 1.29 | 1 | 0.58 | 0.75 | 1 | ||||||
| DNA and RNA binding | 39.67 | 5.32 | 28* | 11.52 | 3.12 | 6 | 3.71 | 1.81 | 2 | ||||||
| DNA and RNA metabolism | 5.34 | 2.05 | 4 | 1.55 | 1.20 | 2 | 0.50 | 0.70 | 2* | ||||||
| Hydrolase activity | 46.87 | 5.74 | 63** | 13.59 | 3.36 | 20 | 4.37 | 1.95 | 7 | ||||||
| Kinase activity | 30.23 | 4.73 | 42* | 8.76 | 2.76 | 14 | 2.82 | 1.60 | 5 | ||||||
| Molecular function unknown | 104.82 | 7.83 | 82** | 30.43 | 4.59 | 24 | 9.80 | 2.66 | 8 | ||||||
| Nucleotide binding | 31.26 | 4.79 | 41* | 9.08 | 2.81 | 16* | 2.92 | 1.62 | 8** | ||||||
| Nucleus | 53.40 | 6.07 | 41* | 15.51 | 3.56 | 15 | 4.99 | 2.06 | 7 | ||||||
| Other membranes | 109.13 | 7.92 | 116 | 31.67 | 4.65 | 44** | 10.19 | 2.70 | 10 | ||||||
| Response to stress | 22.19 | 4.07 | 24 | 6.45 | 2.39 | 10 | 2.08 | 1.39 | 5* | ||||||
| Signal transduction | 20.56 | 3.95 | 24 | 5.96 | 2.31 | 8 | 1.92 | 1.34 | 6** | ||||||
| Transcription | 44.15 | 5.57 | 32* | 12.84 | 3.29 | 9 | 4.13 | 1.90 | 4 | ||||||
| Transcription factor activity | 42.92 | 5.50 | 28** | 12.49 | 3.24 | 7 | 4.02 | 1.88 | 3 | ||||||
| Transferase activity | 47.28 | 5.77 | 62* | 13.71 | 3.38 | 19 | 4.41 | 1.95 | 6 | ||||||
| Transport | 34.32 | 5.00 | 46* | 9.97 | 2.93 | 19** | 3.22 | 1.70 | 6 | ||||||
| Transporter activity | 35.97 | 5.11 | 45 | 10.45 | 2.99 | 19** | 3.37 | 1.73 | 4 | ||||||
NOTE.—Italics indicate that with correction for multiple tests the result remained after Bonferroni correction to 5% false positive rate and Benjamini–Hochberg correction to 5% FDR. Boldface indicates results that remained after Benjamini–Hochberg correction to 5% FDR.
indicates significance at the 5% level.
indicates significance at the 1% level.
Results uncorrected for multiple testing indicate that gene pairs that experienced at least one intron indel are enriched for gene ontology (GO) terms involving cytosol and hydrolase activity while transcription factor activity as well as unknown molecular function and biological processes are underrepresented; gene pairs that experienced at least 2 intron indels are enriched for “other membranes,” transport, and transporter activity; gene pairs that experienced at least 3 intron indels are enriched for nucleotide-binding functions and signal transduction (all significant at the 1% level). When we repeated the simulations correcting for number of introns, the results were not significantly different. Coghlan and Wolfe (2004) previously found similar results in Caenorhabditis where many genes experiencing intron gains function in pre-mRNA processing.
There are 47 GOslim categories in this analysis. Because of multiple testing, if we consider each of these categories to be independent, we would expect just less than 2.5 categories to falsely appear significant at the 5% level and less than 0.5 categories to falsely appear significant at the 1% level. We observe more categories with P values ≤0.05 and ≤0.01, respectively, which indicates that most of these results are true positives but does not indicate which ones. When we correct for multiple testing using the Bonferroni correction, no GO terms are overrepresented (table 2). However, Bonferroni correction is extremely strict, especially in cases where there may be some dependence between categories (as is the case with GO terms). When we use Benjamini–Hochberg correction (Benjamini and Hochberg 1995), which aims to minimize the false discovery rate (FDR; i.e., the fraction of significant results that are actually false positives), genes with at least one intron indel are enriched for the terms cytosol, hydrolase activity, kinase activity, nucleotide binding, transferase activity, and transport at the 5% FDR level; genes with at least 2 intron indels are enriched for the terms “other membranes,” transport, and transporter activity also at the 5% FDR level (table 2). No terms remain significant for genes with at least 3 intron indels, which may be caused by low statistical power due to the small numbers of genes.
Search for Origins of Introns
The mechanisms of intron gain remain enigmatic (Fedorov, Roy, Fedorova et al. 2003). Possible modes of intron origin almost all involve the incorporation of copies of other genomic DNA into a gene as an intron, be it directly through DNA duplication or indirectly through RNA intermediates (Roy and Gilbert 2006). We searched the entire Arabidopsis genome for DNA sequences with significant similarity to any of the nonconserved introns we identified using Blast and SSearch. We excluded self-hits, short hits (less than 50% of the query length), and any hits that were due to a large duplication (e.g., complete gene duplication, segmental chromosome duplication).
We could successfully identify the origin of only one recently gained intron. The mechanically inducible TOUCH3 gene (TCH3; At2g41100) has gained an intron with respect to its paralog the Calmodulin 3 gene (CAM3; At3g56800) that only contains one intron. TCH3 also contains one conserved intron and one intron in an ambiguous portion of the alignment with respect to CAM3. The sequence similarity search revealed that the new TCH3 intron is significantly similar to the conserved intron within TCH3 and to an intron in an adjacent paralogous gene in the chromosome (At2g41090). Inspection of the TCH3 gene sequence indicated that this intron was duplicated by a partial, internal gene duplication that also duplicated exonic sequence (fig. 2). The 5 homologous sequences we identified in Solanum tuberosum (potato, 3 homologs), Arachis hypogaea (peanut), and Oryza sativa (rice) resembled the CAM3 gene in gene structure and length. The dotplot of the TCH3 gene against itself (fig. 2B) indicates that much of the original gene was in fact duplicated twice (Sistrunk et al. 1994), generating the 2 new introns (fig. 3), but one of these (intron 2) was excluded by our alignment quality criteria during the assignment of conserved and nonconserved introns. Interestingly, TCH3 has an alternative splice form (supported by cDNA evidence; GenBank NC_003071) that uses a pair of cryptic splice sites (AGGT) fortuitously present in the original duplicated gene segment as the ends of a new intron (fig. 3). This mechanism of intron gain was originally proposed over 15 years ago (Rogers 1989).
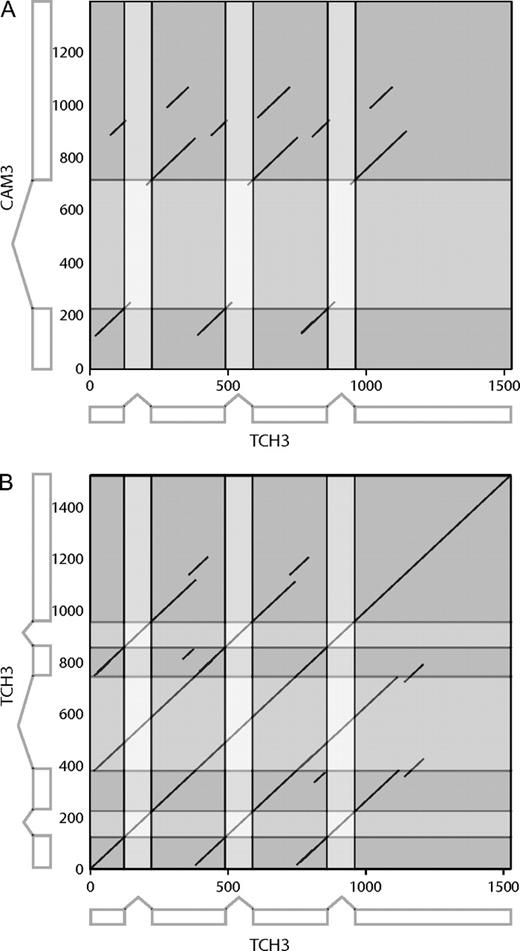
Dotplots of Arabidopsis genes made using EMBOSS Dotmatcher with a window size of 40 and a threshold score of 60. The exonic (including untranslated regions) and intronic regions are shown in dark gray and pale gray, respectively. Axes indicate base pair positions along the gene sequence. (A) Gene sequence of TCH3 (At2g41100) compared with the sequence of its paralog CAM3 (At3g56800). (B) TCH3 gene compared with itself. The alternative splice variant is indicated along the vertical axis.
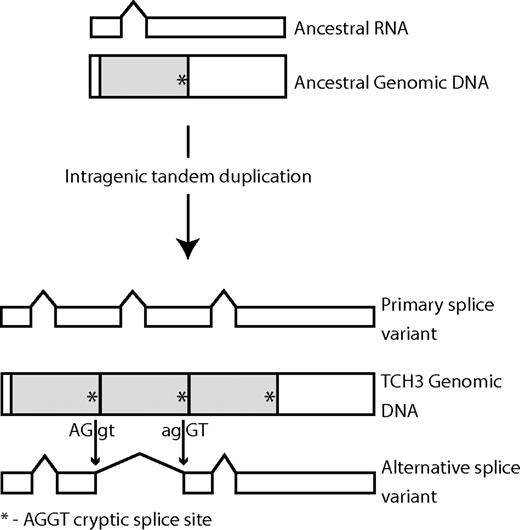
Evolution of new introns in the TCH3 gene. The ancestral gene contained only one intron. Two intragenic duplications of a segment of the ancestral gene (shaded) copied the ancestral intron twice, generating 2 new introns in the primary splice variant of the modern TCH3 gene. The duplicated gene segment also included a cryptic splice site sequence AGGT (indicated by an asterisk *) close to its 3′ end. A pair of cryptic splice sites is used as the boundaries of a new intron in the alternative splice variant of the modern TCH3 gene.
Discussion
The work reported here examines the dynamics of intron gain and loss on a much more recent scale than any previous studies. We observe a rate of gain and loss of introns of 2.7 × 10⁻³ to 9.1 × 10⁻⁴ events per intron site per million years (578 indel events out of 10 582 characterized intron locations in the 20–60 Myr since the genome duplication). This rate is higher than found in most previous studies stretching over broader evolutionary periods. If we extrapolate the amount of intron gain and loss to the whole data set (i.e., 60% of nonconserved introns are gains), the rate of intron gain (2.0 × 10⁻¹² to 5.9 × 10⁻¹² gains per site per year; based on 2 873 004 possible insertion sites that pass alignment quality criteria) is similar to that found by Roy and Gilbert (2005a), and the rate of intron loss is orders of magnitude higher (4 × 10⁻⁶ to 1.2 × 10⁻⁵ events per year), although it is difficult to compare their study with ours because of methodological differences. The fact that this research focuses on relatively recently diverged genes gives greater power to detect intron gain and loss because over longer evolutionary periods, there is the opportunity for the gain and subsequent loss of an intron leading to underestimates of the number of events (Roy and Gilbert 2006). For example, Roy et al. (2003) identified only 5 intron losses and no gains in ∼1500 human–mouse orthologs. Additionally, there may be some lineage-specific intron indel acceleration due to neutral drift to fixation of gain and loss polymorphisms facilitated by the tiny effective population size imposed by A. thaliana's self-fertilization lifestyle.
Intron gain and loss in paralogous genes has been previously studied in a broad range of eukaryotic genomes (Babenko et al. 2004; Castillo-Davis et al. 2004; Qiu et al. 2004). Two studies examining this phenomenon in very old duplicate genes both found an excess of intron gain events (Babenko et al. 2004; Qiu et al. 2004). Analysis of introns in duplicated genes in Plasmodium malaria parasites of human and mouse indicated that intron indels are very frequent in paralogous genes, although they did not distinguish between gain and loss (Castillo-Davis et al. 2004). One of the problems with these analyses lies in the estimation of the intron/exon structure at the time of duplication. The paralogous genes studied are likely to have been duplicated at widely different times—making rate estimation problematic—and by different mechanisms, including retrocopying of the gene via an mRNA intermediate that usually removes all introns from the gene. By contrast, the genes selected for analysis here were all duplicated at the same time and preserving gene structures.
All of these analyses of intron gain and loss find high rates of gene structure evolution in paralogs. Special features of paralogous genes that may give rise to higher intron flux include a possible contribution from subfunctionalization of alternative splice variants (Su et al. 2006) which may involve changes in gene structure. However, this is more likely to involve the loss than the gain of an intron because it proposes the loss of alternative splicing by at least one of the duplicate genes. Some of the paralogous gene pairs in this study experienced multiple intron indels (table 1 and Supplementary Table 1, Supplementary Material online), and it is not clear if there is something special about these genes. A GO term analysis indicates that the group of gene pairs with 2 or more nonconserved introns is enriched for functions involved in transport, transporter activity, and other membranes with respect to the entire group of paralogous genes. However, it is not clear why this should be the case.
Intron gain may be overestimated when there has been a parallel intron loss in the outgroup sequences. The Dollo Parsimony method we employed here does not attempt to correct for this, unlike likelihood methods. However, likelihood methods require an estimate of the rate of intron loss in order to estimate parallel loss events, and these estimates are not readily available for all lineages. A compromise has often been to assume constant rates on all lineages, which may not be biologically realistic. Our analysis uncovered approximately 1·5 times more intron gains than losses during recent Arabidopsis evolution (although the difference is not significant based on a chi-squared test). If the actual frequencies are equal in this data set, then that would imply a 9% chance of parallel loss in all outgroup sequences. If there is just a single outgroup from rice, this equates to a rate of intron loss of 4·5 × 10−4 per intron per million years (assuming a monocot–dicot divergence date of 200 MYA), which is comparable to the rate estimated by Roy and Gilbert (2005a). Where there are more numerous or more closely related outgroups, the rate of loss must be much higher to create this pattern of parallel intron loss. A tendency for parallel intron loss of particular introns (over random intron loss) has been observed in diverse Caenorhabditis genes and in the White gene of animals (Krzywinski and Besansky 2002; Cho et al. 2004). If this phenomenon holds in plant genomes or more generally if intron loss is more frequent in rice, then the parsimony method used here to infer intron gain and loss will be even more susceptible to the overassignment of intron gains due to parallel loss in the outgroup.
Arabidopsis thaliana has a famously small genome. One might have therefore naïvely predicted an excess of recent intron loss events, which we do not observe (though the amount of intron loss is high). However, the broad correlation between genome size and intron size in vertebrates (McLysaght et al. 2000) is not generally apparent in plant genomes (Wendel et al. 2002). This uncoupling of genome size and intron size is mirrored here by an uncoupling of genome reduction and intron loss. The yeast Cryptococcus neoformans has a similar uncoupling of these phenomena in its small, yet intron-dense, genome (Loftus et al. 2005). In future research, it will be interesting to investigate whether the high rate of intron flux in paralogous genes can be related to subfunctionalization or neofunctionalization following gene duplication.
William Martin, Associate Editor
The authors would like to thank Ken Wolfe and Kirsten Bratke for helpful discussions. This work is supported by Science Foundation Ireland.
Funding to pay the Open Access publication charges for this article was provided by the Smurfit Institute of Genetics.
References
Arabidopsis Genome Initiative.
Babenko VN, Rogozin IB, Mekhedov SL, Koonin EV.
Benjamini Y, Hochberg Y.
Berardini TZ, Mundodi S, Reiser R, et al. (18 co-authors).
Blanc G, Barakat A, Guyot R, Cooke R, Delseny M.
Blanc G, Hokamp K, Wolfe KH.
Blanc G, Wolfe KH.
Bowers JE, Chapman BA, Rong J, Paterson AH.
Castillo-Davis CI, Bedford TB, Hartl DL.
Castillo-Davis CI, Mekhedov SL, Hartl DL, Koonin EV, Kondrashov FA.
Cho S, Jin SW, Cohen A, Ellis RE.
Coghlan A, Wolfe KH.
Duret L, Mouchiroud D, Gautier C.
Fedorov A, Roy S, Cao X, Gilbert W.
Krzywinski J, Besansky NJ.
Loftus BJ, Fung E, Roncaglia P, et al. (54 co-authors).
McLysaght A, Enright AJ, Skrabanek L, Wolfe KH.
Nguyen HD, Yoshihama M, Kenmochi N.
Nielsen CB, Friedman B, Birren B, Burge CB, Galagan JE.
Notredame C, Higgins DG, Heringa J.
Paterson AH, Bowers JE, Burow MD, et al. (11 co-authors).
Qiu WG, Schisler N, Stoltzfus A.
Rogozin IB, Sverdlov AV, Babenko VN, Koonin EV.
Rogozin IB, Wolf YI, Sorokin AV, Mirkin BG, Koonin EV.
Roy SW, Fedorov A, Gilbert W.
Roy SW, Gilbert W.
Roy SW, Gilbert W.
Seoighe C, Gehring C.
Seoighe C, Gehring C, Hurst LD.
Simillion C, Vandepoele K, Van Montagu MC, Zabeau M, Van de Peer Y.
Sistrunk ML, Antosiewicz DM, Purugganan MM, Braam J.
Su Z, Wang J, Yu J, Huang X, Gu X.
Thompson JD, Higgins DG, Gibson TJ.
Vision TJ, Brown DG, Tanksley SD.
