


Abstract
Although the combination of pale skin and intense sun exposure results in an important health risk for the individual, it is less clear if at the population level this risk has possessed an evolutionary meaning. In this sense, a number of adaptive hypotheses have been put forward to explain the evolution of human skin pigmentation, such as photoprotection against sun-induced cancer, sexual selection, vitamin D synthesis or photoprotection of photolabile compounds, among others. It is expected that if skin pigmentation is adaptive, we might be able to see the signature of positive selection on some of the genes involved. In order to detect this signature, we analyze a battery of 81 candidate loci by means of phylogenetic and population genetic tests. Our results indicate that both light and dark skin may possess adaptive value. Of the main loci presenting this signature, TP53BP1 shows clear evidence of adaptive selection in Africans, whereas TYRP1 and SLC24A5 show evidence of adaptive selection in Caucasians. Although we cannot offer a mechanism that based on these genes explains the advantage of light skin, if TP53BP1, and perhaps RAD50, have truly conferred an adaptive value to the African population analyzed, photoprotection against sun-induced skin damage/cancer might be proposed as a mechanism that has driven the evolution of human skin pigmentation.
Introduction
The apportionment of human diversity in skin color is atypical. Although genetic markers indicate that the differences among major geographical groups represent only a 10% of the total human genetic diversity (Lewontin 1972; Barbujani et al. 1997), variation in skin reflectance among populations of the major geographical regions represents an 88% of the global diversity (Relethford 2002). As these differences might be adaptive, the pigmentation of the human skin represents a topic of special interest in human evolution (Diamond 2005). Moreover, given the evidence that intense sun exposure and pale skin might be important risk factors in skin cancer (Sturm 1998; Sturm et al. 2001; Agar and Young 2005 and references therein), the pigmentation of the skin also represents a topic of health concern.
However, although this health risk is evident, it is less clear that protection against skin cancer is the driving mechanism in the evolution of human pigmentation. Despite the appeal of this hypothesis, evidence supporting it has been indirect, and thus, a number of hypotheses coexist on the mechanisms by which pigmentation offers an adaptive value (Robins 1991; Quevedo and Holstein 1998; Aoki 2002; Jablonsky 2004). There is evidence of correlation between skin reflectance and environmental variables such as UV radiation (Jablonsky and Chaplin 2000; Chaplin 2004; Jablonsky 2004). It is also known that the effects of UV light on skin include both damage to DNA and stimulation of melanogenesis (Kadekaro et al. 2003), that the melanogenic response is more pronounced in darker constitutive pigmentation, and that epidemiological studies show an inverse correlation between the degree of pigmentation and skin cancer incidence (Agar and Young 2005 and references therein). All these would suggest a photoprotective role for pigmentation (Sturm 1998; Palmer et al. 2000; Rees 2004). But this hypothesis has not gone unchallenged (Montagna 1985), and alternative explanations consider pigmentation as a regulator of the penetration of UV radiation, both to prevent photolysis of photolabile metabolic compounds, that is, folate, and to permit the synthesis of compounds like vitamin D (Chaplin 2004; Jablonsky 2004) for instance.
Whatever the mechanisms involved, given that skin (and hair) color in humans is under genetic control (Byard 1981; Rees 2003), if pigmentation plays a role in the adaptive evolution of humans, we could expect to see a signature of selection on the sequence diversity and/or the divergence patterns of those genes involved. These genes would point to particular biological pathways that could help us cast some light on the evolutionary meaning of pigmentation.
Among the strategies to identify selection, a series of phylogenetic methods have been developed to detect selection in particular lineages by looking at the ratio dN/dS (dN and dS being, respectively, the nonsynonymous and synonymous substitution rates in coding sequences) (Goldman and Yang 1994; Nielsen and Yang 1998; Yang 1998; Yang et al. 2000; Yang and Nielsen 2002; Zhang et al. 2005). Using his approach, Clark et al. (2003), for instance, were able to identify adaptive physiological differences between chimpanzees and humans. Another strategy to identify adaptive selection is by means of the statistic FST (Akey et al. 2002). It is expected that positive selection may lead to an increase in the values of this statistic when comparing populations under different environmental pressures. Similarly, the extended haplotype homozygosity (EHH) test (Sabeti et al. 2002) can detect the presence of adaptive mutations by analyzing long-range single-nucleotide polymorphism (SNP) haplotypes and identifying regions that show unusually high EHH and high population frequency.
More than 100 genes have been identified in the mouse in which mutations can affect pigmentation of the skin, hair, or eyes. Many of them have been cloned, and for all of these, a human orthologue has been identified (Bennet and Lamoreux 2003). Among these, MC1R has been the locus most extensively investigated for polymorphisms and divergence (Valverde et al. 1995; Healy et al. 1999; Rana et al. 1999; Harding et al. 2000; Box et al. 2001; Mundy and Kelly 2003). Herein, we apply these 3 approaches to a battery of 81 loci. Overall, these loci are involved in a variety of physiological processes, including DNA damage response genes, immunity and hypo/hyperpigmentation-related genes (Stinchcombe et al. 2004), melanocyte migration, control of melanogenesis, hormone response genes (like α-MSH and the sex hormones or vitamin D), or prostaglandin-coding genes (prostaglandins may mediate postinflammatory pigmentary changes through modulation of melanocyte dendricity and melanin synthesis) (Scott et al. 2004). Our results indicate that both light and dark skin may possess adaptive value in human populations.
Materials and Methods
The selection of loci involved in pigmentation included mainly, but not exclusively, the cloned mouse color genes listed on the Web page of the International Federation of Pigment Cell Societies (http://ifpcs.med.umn.edu/micemut.htm). Another set of genes was selected from the literature on the pigmentation patterns of Drosophila. Other genes were chosen by their association to hormones or other molecules that have been hypothesized to have a role in pigmentation. The initial coding sequences of the human, mouse, and chimpanzee orthologues were downloaded from the University of California Santa Cruz (UCSC) genomes browser (http://genome.ucsc.edu/) and/or the Ensembl genome server (http://www.ensembl.org/index.html). Occasionally, other species, including other primates or mammalian genomes, were used instead of or in addition to that of the mouse. In case of alternative transcripts, the isoform with the greater number of exons and/or that maximizing the global alignment was selected. Sequences were edited with BioEdit 5.0.9 (Hall 1999). Before phylogenetic analysis, both initiation and stop codons were trimmed. Occasionally, some segments that were difficult to align with confidence were removed from the alignment. Small alignments were carried out manually when necessary; occasionally, ClustalW was run to help obtain a global alignment. Alignments were always inspected by eye. In case of conflicting sequence data for a particular species, we conservatively favored the variant that maximized global sequence similarity. Loci that were too divergent to align confidently were dropped from the study. Finally, a set of 81 loci was selected for phylogenetic analysis. FASTA alignments are available as Supplementary Material 1 online. These loci include ADAM17, ADAMTS20, AP3D1, AP3M2, AR, ASIP, ASMT, ATRN, BLOC1S3, BRCA1, CHS1 (LYST), CNO, CYP24A1, CYP27B1, DC6, DDC, EDA, EDN3, EDNRB, ERCC2, ESR1, ESR2, GGT1, GPR143, HPS1, HPS2 (AP3B1), HPS3, HPS5, HPS6, HPS7 (DTNBP1), IKBKG, KIT, KITLG, MAGMAS, MAMAL1, MATP (AIM1), MC1R, MDM2, MGRN1, MITF, MLANA, MLPH, MTNR1A, MTNR1B, MUTED, MYO5A, MYO7A, OCA2 (P locus), OSTM1, PAR2, PAX3, PER1, PGR, PKCβ, PLDN, POMC, PTGER1, PTGER2, PTGER3, PTGFR, PTGIR, RAB27A, RABGGTA, RAD50, RXRA, SILV (PM17), SLC24A5, SOX10, TBX2, TH, TP53, TP53BP1, TYR, TYRP1, TYRP2 (DCT), VDR, VDRIP, VPS18, VPS33A, YARS, and ZNFN1A1.
Phylogenetic analysis was conducted by means of the PAML package (Yang 1997). Thus, the maximum likelihood dN/dS ratio (ω) test was performed using codeml. For each locus, 3 pairs of models, representing the null versus the test hypothesis, were evaluated by the log-likelihood ratio test. First, we evaluated the one-ratio branch model (assuming one ω for all lineages, model = 0, NSsites = 0) versus the free-ratio branch model (in which ω is free to vary for each branch, model = 1, NSsites = 0) (Yang 1998). A second test evaluated the sites model M1 (model = 0, NSsites = 1) versus the branch-sites model A (model = 2, NSsites = 2), an extension of model M1. M1 assumes 2 categories of sites, the first includes neutral sites, for which ω1 = 1, and the second category includes conserved sites with ω2 = 0; this is called the “neutral model.” In branch-sites models, ω varies among branches and codons, with a total of 4 site classes in the sequence: there are 2 site classes along the background lineages with ratios ω0 or ω1 (sites with ω0, a small ω, are highly conserved; sites with ω1, with ω near or smaller than 1, are neutral or weakly constrained sites), but along the lineage of interest, the foreground lineage, a certain event caused some sites to come under positive selection and have a ω ratio ω2 > 1. In model A, ω0 and ω1 are fixed to 0 and 1, respectively. Third, we evaluated the sites model M3 (model=0, NSsites = 3) versus the branch-sites model B (model = 2, NSsites = 3). M3 is an unconstrained discrete model that accommodates heterogeneous ω ratios among sites. Model B is similar to A, but ω0 and ω1 are estimated from the data as free parameters. Model B is an extension of the sites model M3 (Nielsen and Yang 1998; Yang et al. 2000; Yang and Nielsen 2002). Finally, as the above tests have been recently considered as excessively “liberal” (Zhang 2004), those loci that showed a significant result with the above tests were also subject to the improved “test 2”: in this test, the null hypothesis is the branch-site model A but with ω2 fixed to 1; its alternative model has ω2 ≥ 1 constrained (Zhang et al. 2005). Results for the 81 loci are available as Supplementary Material 2 online.
FST results for the 81 loci are available as Supplementary Material 3 online. As pointed out in Akey et al. (2002), genotyping errors are unlikely to produce false positive results as, on the one hand, the final allele frequencies employed are the result of lumping together 2 different data sets for each geographical group (or 3 in the case of East Asians) in a majority of the cases and, on the other, genotyping errors per se are more likely to decrease FST values.
To obtain a neutral distribution of the FST statistic, we selected 43 regions distributed across the autosomal genome that belong to broader regions of low gene density and which are separated at least 150 kb from the closest exon. Each of these regions spans an average of 1.96 Mb and in total make 84.3 Mb. For each region, we downloaded the SNP frequency information available form the HapMap browser (data Rel #20/phase II on National Centre for Biotechnology Information BI B35 assembly, dbSNP b125) for the 3 major populations (Caucasians: 153,339 SNPS, Yorubans: 123,798 SNPs, and Chinese: 33,190 SNPs). We further filtered the number of SNPs to include only those SNPs 1) that were separated at least 100 kb from each other, 2) that have been genotyped in all 3 populations, and 3) for which at least one of the 3 major populations has a minor allele frequency higher than 0.1. A final list of 546 SNPs satisfied these criteria. Therefore, we have used the upper 95% limits of these observed “neutral” distributions as the cutoff points to declare departure from neutrality. The 95% upper limits were Caucasians–Chinese: 0.33, Caucasians–Yorubans: 0.47, and Chinese–Yorubans: 0.45 (fig. 1).
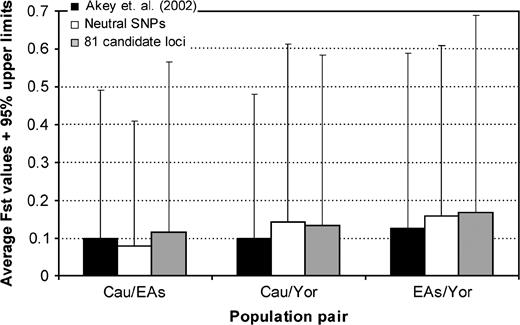
Average and 95% upper limits of FST distributions. Black bars represent the mean of the FST distribution found for the autosomal SNPs analyzed in Akey et al. (2002). White bars represent the mean of the FST distribution found for the autosomal neutral SNPs analyzed in this work. Gray bars represent the mean of the FST distribution found for the autosomal SNPs corresponding to the 81 candidate loci for skin pigmentation analyzed in this work. Cau: Caucasians, EAs: East Asians, and Yor: Yorubans. Error bars project up to the 95% upper limit of the corresponding distribution. The upper 95% limits of the observed neutral distributions were used as the cutoff points to declare departure from neutrality in the FST analysis.
Regarding the observed EHH distributions, these were obtained by following the method developed in Sabeti et al. (2002). Basically, whole chromosome SNP information for 3 populations, Africans, Caucasians, and Chinese was downloaded from the HapMap Web page (http:/www.hapmap.org). In general, for each gene of interest, we selected a region that, centered on the gene as much as possible, extended approximately 200 kb on each direction. For this region, we looked for a central core region of 3–5 SNPs long that followed the infinite sites model in the global population sample. This core region defined core haplotypes for which their frequency was registered. The core haplotype with the highest frequency for each population was analyzed for their EHH. In approximately 10% of the loci, the second most frequent core haplotype in a given population was also analyzed, particularly, if this core haplotype was present with high frequency in non-Africans and was different from the most frequent core haplotype in Africans. For this analysis, haplotype homozygosity was scored starting with the core haplotypes and increasing their length in one SNP each time. In order to test the significance of the extended homozygosity distribution, we obtained the neutral distributions by running simulations using RR Hudson's ms program (http://home.uchicago.edu/∼rhudson1/source.html) under the following demographic scenario: we assumed an Out-of-Africa model in which 3 demographic splits take place. One, 2,500 generations ago, reflecting the dispersals of modern humans through Europe; a second, 3,000 generations ago, reflecting the colonization of Asia and a third one, 5,000 generations ago reflecting the Out-of-Africa expansion. Ne was assumed to be 10,000, and θ = 4Neμ was 160 for a DNA segment of 200-kb long. For the Caucasian and East Asian populations, an exponential population growth parameter α = 2Ng was set to 40. It is expected that doing so, the effect of population growth can be discarded when explaining possible departures from neutrality. In order to be conservative, no migration between demes was considered. Recombination was included in the simulations by taking the Decode sex averaged recombination rates displayed in the UCSC genome Web browser for each gene (http://genome.ucsc.edu). Parameters were proportionally reduced according to the frequency of the haplotype being simulated by using the −n flag. Initially, for each of the approximately 200-kb-long-regions, 2,000 simulations were run, and a P value of 0.05 was used as the significance cutoff point. From each simulation, a Perl script randomly chose a number of SNPs identical to that shown by the HapMap Web page for each region under study. Thus, from the whole set of simulations, we obtained the upper 95% EHH values for each nonoverlapping window of 1-kb long. If the observed EHH values were higher than the 95% upper EHH values obtained in the corresponding simulated distribution, we considered that as evidence of positive selection. In order to correct for multiple testing, we used a P value of 0.005 which rendered in this case an approximate, conservative, false discovery rate (FDR) of 4%, estimated from the approach of Benjamini and Hochberg (1995) to control FDRat a level α; this approach ranks the initial P values in ascending order
Results
Validation of the Phylogenetic and FST Methods
Firstly, we tested if the proposed phylogenetic approach may be useful to detect adaptive selection, even when selection has acted only in one geographical populational group. For that, we subjected a set of 10 genes from those described in Akey et al. (2004) to the phylogenetic test described above (see Materials and Methods). This set of genes had been analyzed previously for evidence of selection with pairwise Tajima's D, Fu and Li's D*, Fu and Li's F*, and Fay and Wu's H* tests in African-Americans and European Americans. Five of these loci (DCN, EPHB6, KEL, TRPV5, and TRPV6) were identified in Akey et al. (2004) as “positively selected” in European Americans (but not in African-Americans), and for the other 5 (IL17B, F2RL1, TNF, FGB, and THBD), no robust evidence of selection was found in either group. Thus, 3 loci (EPHB6, TRPV5, and TRPV6) also showed significant evidence for positive selection in at least one of the phylogenetic tests described. Of these 3 loci, TRPV6 was also significant for test 2 (−2LR = 5.1; df = 1). DCN and KEL showed ω > 2 for some nucleotide positions in all 3 species. For the rest of the loci, the phylogenetic tests provided evidence of predominant purifying selection or evidence of neutrality (with some sites with ω values between 1 and 1.2).
Secondly, to test the FST method, all these 10 loci were also subject to FST analysis (using the same criteria and sources of data as described in Materials and Methods). In this case, the group of previously declared positively selected loci in Caucasians (DCN, EPHB6, KEL, TRPV5, and TRPV6) showed, as a whole, average pairwise FST values of 0.44 for Caucasians versus Africans, 0.01 for East Asians versus Caucasians, and 0.36 for East Asians versus Africans. EPBH6, KEL, TRPV5, and TRPV6 showed SNPs with significant values for Caucasians versus Africans at a FDR (Benjamini and Hochberg 1995) of approximately 17%. In contrast, for the set of loci with no robust evidence of selection, average FST values of 0.04, 0.05, and 0.14 were found, and no particular SNP showed significant FST values in any pairwise population comparison. The inclusion of an additional set of 42 loci (BDKRB2, CCR2, F10, F5, FGA, IFNG, FSBP, IL1B, IL12B, IL20, LTA, PLAU, F11, PTGS2, SELPLG, SELL, STAT6, TNFRSF1A, VEGF, CRF, KLK1, NOS3, PROCR, TIRAP, SFTPB, APOH, BF, CD36, CSF2, CSF3, CRP, F2R, FGG, FGL2, IGF2, IL10, MAP3K8, MMP9, PPARG, SCYA2, SERPINE1, and TNFAIP2) described in Akey et al. (2004) as “with no robust evidence of selection,” yielded a total of 100 SNPs and average pairwise FST values of 0.10, 0.11, and 0.13 for Caucasians versus Africans, East Asians versus Caucasians, and East Asians versus Africans, respectively. However, when the whole set of SNPs was corrected for multiple testing, none of the SNPs showed significant differences between Caucasians and Africans or East Asians versus Africans even at FDR values as high as 40%. These results suggest that FST values may in principle be useful as exploratory tools for detecting selection, although multiple testing may substantially reduce the power of this method to detect significant departures from neutrality in genome-wide scans.
Phylogenetic Results
A total of 81 loci related, in the broad sense, to the pigmentary phenotype were scanned for phylogenetic evidence of selection. The phylogenetic tests indicate that initially only 4 genes showed a significant signal of differential positive selection in the human lineage. These loci are BLOC1S3, BRCA1, MYO7A, and PGR. Of these, BRCA1 and PGR had already been identified as under positive selection in humans (Yang and Nielsen 2002; Nielsen et al. 2005, respectively). However, after multiple test correction, only MYO7A and PGR remained significant (at a FDR value of ca. 4%). Twenty-five loci showed nonsignificant evidence of positive selection but with likelihood ratios supporting it, at least in one of the 3 phylogenetic tests: ADAMTS20, AR, ASIP, CYP24A1, DC6, DDC, ESR2, GPR143, HPS2, HPS3, IKBKG, LYST, MCRN1, MDM2, PAR2, PER1, PTGER1, PTGFR, PTGIR, RAB27A, SOX10, TP53BP1, TYRP1, TYRP2, and OCA2. Fifteen loci, ASMT, CYP27B1, EDN3, HPS1, KITLG, MAGMAS, MITF, MLANA, OSTM1, PTGER2, RAD50, TBX2, TH, TYR, and VDRIP show some evidence of positive selection but not exclusive to humans. Twenty-eight genes showed evidence of being or having been under a regime of negative selection: ADAM17, AP3M2, ATRN, CNO, DTNBP1, EDA, EDNRB, ERCC2, GGT1, HPS6, KIT, MC1R, MTNR1B, MUTED, MYO5A, PAX3, PKCβ, PLDN, PTGER3, POMC, RABGGTA, RXRA, TP53, VDR, VPS18, VPS33A, YARS, and ZNFN1A1. Eight additional genes: ESR1, HPS5, MAMAL1, MATP, MLPH, MTNR1A, SILV, and SLC24A5 were classified as “neutral” as a proportion of sites showed ω values about 1. AP3D1 was left as unclassified.
Population Genetic Results
FST Values
We finally decided not to consider those loci on the X chromosome (GPR143 with 2 SNPs, AR with 7 SNPs, EDA with 18 SNPs, and IKBKG, with no SNPs available) due to the small sample size remaining after removing the male individuals. In addition, BLOC1S3 could not be evaluated for FST as no SNPs satisfying our criteria could be retrieved. Thus, a total of 338 SNPs belonging to 76 autosomal loci from those listed above were compared for their frequencies in the 3 populational groups (frequency data on Chinese and Japanese were pooled). SNPs within the same gene were separated from each other, 15 kb on average approximately, which given the average sizes of linkage disequilibrium blocks in human populations (Hinds et al. 2005) should be enough to detect the possible effects of selection on most nucleotides across each gene even if these effects are indirect, that is, hitchhiking. For these loci, the global observed FST distribution showed parameters similar to those described using a more comprehensive set of loci by Akey et al. (2002). Thus, 17.5% of the FST values among the 3 populations were equal to 0, a 7.7% of the FST values were equal to or greater than 0.4, and the average FST was 0.135, whereas Akey et al. (2002) analysis yielded values of 10.8%, 4%, and 0.122, respectively. However, the observed FST distribution obtained from 81 candidate loci was different from the neutral one (Kolmogorov-Smirnov D value 0.21, P = 0) and from the distribution obtained by Akey et al. (2002) (Kolmogorov–Smirnov D value 0.12, P = 0.002). Summarized pairwise population comparisons of FST distributions are shown in figure 1. Of the total 338 SNPs, 61 (belonging to 29 loci; Supplementary Material 3, Supplementary Material online) showed at least one significant pairwise FST value (equal to or higher than the 95% upper limits of the observed neutral distribution). These 61 SNPs were distributed across all of the above phylogenetic categories of loci.
Aiming at identifying FST differences that parallel broad phenotypic differences in skin pigmentation, we initially decided to consider an SNP as “pigmentation relevant” when the following criteria were met: 1) we applied a multiple test correction (with a FDR of 35%); 2) FST values had to be “consistent,” that is, FST values had to follow a pattern whereby when the Caucasian (East Asian) population presented a multiple-test–corrected significant FST value with the Yoruban population, the East Asian (Caucasian) population had also to show an FST value with the Yoruban population higher than the pairwise FST value between Caucasians and East Asians; 3) the pairwise comparison involving both non-African populations had to show a nonsignificant FST value.
The rationale of using these criteria, whereby our East Asians have to follow the same trend as Caucasians, is based on the phenotypic measures of skin pigmentation. The average skin reflectance (specifically for melanin, filter 609) varies little between Caucasians and the East Asians. Thus, the British population has an average skin reflectance of roughly 66–69%, whereas the Japanese population, for instance, has an average reflectance of approximately 51–60% (Robins 1991). However, these differences are more apparent when considering the African populations. Although for Africans, reflectance values can range from as low as ∼18% to as high as 50% or more, for Nigerian Yorubans (the African population in the CSHL-HapMap panel), population average skin reflectance ranges between 24% and 26% (Robins 1991). After applying the criteria described above, only TP53 and TP53BP1 showed one pigmentation relevant SNP each (rs2287499 and rs2467737, respectively).
However, Lamason et al. (2005) have recently shown that population-specific differences in skin pigmentation genes may exist. In this sense, SLC24A5 showed multiple-test–corrected, significant differences between Caucasians and Africans only, and 9 loci (ADAM17, ADAMTS20, ESR2, LYST, MATP, OCA2, PTGER1, TYRP1, and TYRP2) showed multiple-test–corrected, significant differences between Caucasians and East Asians only.
EHH Test
This test was applied to a selection of 32 loci from those analyzed before. The list included all 4 loci (BLOC1S3, BRCA1, MYO7A, and PGR) showing phylogenetic evidence of positive selection at least with one of the tests described above, in addition to those 28 loci not already counted in and that showed at least one significant, multiple-test–uncorrected, pairwise FST value: ADAM17, ADAMTS20, ATRN, EDN3, ESR2, KIT, KITLG, LYST, MATP, MDM2, MITF, MLPH, MUTED, OCA2, PAR2, PAX3, PKCβ, PTGER1, RAB27A, RAD50, SLC24A5, TH, TP53, TP53BP1, TYR, TYRP1, TYRP2 (DCT), and VDRIP. This short list allowed us to reach an equilibrium between unrestricted inclusiveness and exclusion of those with less chance to produce positive results in order to reduce the number of analyses.
Out of these 32 loci, 9 (ADAMTS20, ATRN, BRCA1, MLPH, LYST, PGR, TP53BP1, RAD50, and VDRIP) showed one haplotype with a significant signature of recent positive selection in a region within or around the locus. However, after applying a correction for multiple tests, only 5 loci remained significant (at a FDR of ca. 4%). Three loci (LYST, TP53BP1, and RAD50) showed this signature only in the Yoruban population (fig. 2) and 2 loci (TYRP1 and SLC24A5) only in Caucasians (fig. 3).
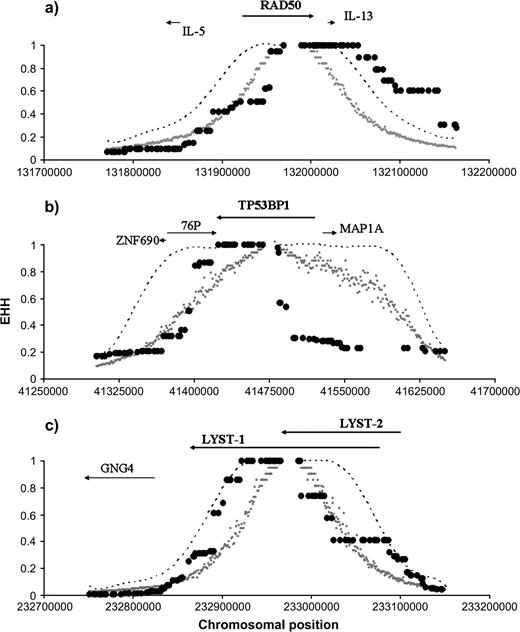
Decay of homozygosity in the EHH test for RAD50, TP53BP1, and LYST in Yorubans. The plots show the observed extent of homozygosity and confidence intervals (CIs) in the 3 loci significant for the EHH test in Yorubans: (a) RAD50, (b) TP53BP1, and (c) LYST. The small gray dots represent the 95% upper limits of the EHH distribution obtained by simulations. The discontinuous line shows the 99.5% upper limits (representing an FDR value of ca. 4%). The bigger black dots represent the observed EHH values. Above each graph, the approximate localization of the loci under study and their surrounding neighbors is indicated by arrows pointing in the sense of transcription.
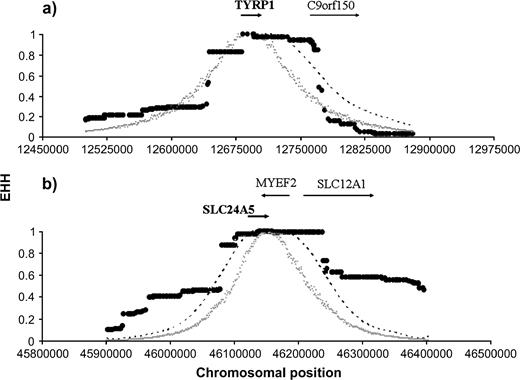
Decay of homozygosity in the EHH test for TYRP1 and SLC24A5 in Caucasians. The plots show the observed extent of homozygosity and CIs in the 2 loci significant for the EHH test in Caucasians: (a) TYRP1 and (b) SLC24A5. Interpretation as indicated in figure 2.
Discussion
We have made use of the available public genomic information to scan for signatures of selection in candidate loci for skin pigmentation by conducting 3 complementary tests. The phylogenetic tests employed search for evidence of selection by looking exclusively at the coding sequence of the loci, whereas the other 2 tests (FST and EHH) use the information on coding and (mostly) noncoding SNPs distributed along the locus of interest and surrounding regions. Due to SNP ascertainment bias, other tests for selection based on the number of singleton haplotypes are not applicable to this kind of data (Voight et al. 2006). It might be expected that the phylogenetic test would provide us with evidence of selection on the human lineage as a whole, whereas the other 2 tests are more likely to highlight geographically specific or population-specific processes. Positive selection at the phylogenetic level may be difficult to detect because it often operates episodically on a few amino acid sites, and the signal may be masked by negative selection. (Zhang et al. 2005). In addition, the reduced number of species used in this work in many of the comparisons, the short length of the coding sequence of some of the loci and the conservative approach used in the alignment might lead to lack of power to detect positive selection with statistical significance. However, we have shown that these tests can detect population-specific signatures of selection (see TRPV6 above, see also Akey et al. 2004 for additional discussion on this aspect). Despite these caveats, some of the phylogenetic tests identified 2 loci, MYO7A and PGR, as under positive selection. PGR was included in the list of candidate loci based on suggestions that both progesterone and estrogen may have a strong impact on the pigmentation of sexual skin (Robins 1991). MYO7A was included in our list of candidate genes as it has been reported to regulate melanosome transport, at least in the retinal pigmented epithelium (Gibbs et al. 2004). However, the functions of these loci are not restricted to the melanocyte. PGR is involved in the reproductive process, and MYO7A also functions as a lysosome-associated molecular motor in sensory cells (Soni et al. 2005). Therefore, whether these 2 loci have hold an adaptive value because of their role in the evolution of skin pigmentation or in other processes cannot be inferred from this analysis.
Of the other 2 tests, FST is expected to have the lowest power to detect departures from neutrality as this test simply utilizes SNP frequency differences between populations, and frequencies may show a wide variance given the stochastic nature of neutral evolution. We cannot exclude either the possibility that other mechanisms like epistatic interaction may pass undisclosed by this single locus approach. This effect may be more pronounced if pigmentation is also the result of multiple minor QTLs. The EHH test has been reported to lead to greater power to detect selection by making use of more informative parameters, like the decay of homozygosity (Sabeti et al. 2002). With this in mind, 5 loci have been initially identified as positively selected. Three of them (LYST, TP53BP1, and RAD50) show this evidence for positive selection in the African population only (fig. 2). The other 2 loci (TYRP1 and SLC24A5) are positive in Caucasians only.
Of these, LYST belongs to the group of immunity and hypo/hyperpigmentation-related genes. There are a number of diseases characterized by pigmentation defects and simultaneous immune dysfunction (Stinchcombe et al. 2004). Some of them, like Chediak–Higashi syndrome (CHS) in humans (OMIM 606897), caused by mutations in LYST are characterized by the presence of enlarged dysfunctional secretory lysosomes, dysfunction restricted to immune cells and melanocytes. In melanocytes, this dysfunction affects the melanosomes (melanocyte lysosomal-related organelles that release melanin to neighbor keratinocytes), which results in a marked associated hypopigmentation. Thus, the relationship between mutations in LYST and melanosome size immediately suggests a possible role for variants of this group of genes in normal variation in skin pigmentation as melanosome size is a trait directly related to the degree of skin pigmentation. Thus, in darkly pigmented individuals, the basal keratinocytes tend to have more abundant and larger melanosomes than Caucasians or Asians. It is interesting to note that of the 2 described alternative transcripts of LYST, only the longer isoform shows severe reduction in abundance in CHS patients (Barbosa et al. 1997). It is precisely on the specific sequence corresponding to this isoform (the 3′ end) that the signal of positive selection is observed (fig. 2). In this sense, we can speculate that the patterns of diversity in LYST favor darker skin in Africans, but however, we cannot discard that this effect might be due to the role of this gene in the immune response.
TP53BP1 (tp53-binding protein 1) is a putative early DNA damage sensor which has been labeled as a central transducer of the DNA damage signal to other tumor suppressor proteins and which is likely to play an important role in the maintenance of genomic stability and prevention of cancer (Wang et al. 2002). It has been reported that the principal mediators of the cellular transcriptional response to UV radiation are unrepaired cyclobutane pyrimidine dimers (CPDs), rather than other DNA lesions or other damaged macromolecules (Garinis et al. 2005). In this regard, CPDs provoke accumulation of TP53BP1 (Garinis et al. 2005) and their continuing presence appears to be the primary cause of the vast majority of (semi) acute responses in the UV-exposed skin, like sunburn, apoptosis, or skin cancer (Jans et al. 2005). The most prominent pathway induced by CPDs is that associated with DNA double-strand break signaling and repair. Interestingly, RAD50 is also involved in DNA double-strand break repair. The product of this gene forms a DNA-binding complex with MRE11 and NBS1 named the MRN complex, which acts at the very early steps of DNA repair (Valerie and Povirk 2003). However, it is not clear if the signal for positive selection deduced from the EHH graph (fig. 2) and FST values corresponds exclusively to this locus or to the effect of the close neighbor locus IL-13. Other interleukins have been linked to melanogenesis. Thus, IL-1α has been shown to upregulate the synthesis and release of ET-1 by keratynocytes and α-MSH by human keratynocytes and melanocytes, factors that stimulate cultured human melanocyte proliferation and melanogenesis (Abdel-Malek and Kadekaro 2006). Instead, IL-13 might posses an anti-inflammatory effect because treatment with IL-13 produced dose-dependent attenuation of UVB-induced hyperalgesia in mice (Saade et al. 2000). Alternatively, it might be the case that the signal for selection on RAD50 derives from the locus control region activity of the 3′ region of RAD50, which has been shown to influence the transcription of the pleiotropic cytokines IL-4 and IL-13 (Lee and Rao 2004).
These observations suggest that photoprotection against UV damage might have held an evolutionary value. It may be claimed that skin cancer, for instance, may cause little fitness reduction as it tends to happen after reaching reproductive age. However, in Nigeria and Tanzania, the proportion of albinos in the age range of 31–60 years has been shown to be 6%, a figure lower than that for nonalbinos (20%). This observation may be linked to the fact that these albinos exhibit cancer or malignant lesions by the age of 20 (Robins 1991). Apart from cancer, sunburn has been pointed out another acutely disabling effect of sun overexposure, particularly by its interference with sweating (Robins 1991).
Our approach focused initially on those loci showing differences between populations of light skin and dark skin. However, other loci involved in the pigmentary phenotype may show more population-specific patterns of diversity. For instance, the “derived” state of SNP rs1426654 in SLC24A5, a putative potassium-dependent sodium/calcium exchanger gene, shows an allele frequency of 98.7–100% in several European American populations and has been claimed to have been the target of selection. However, in African and East Asian populations, it is the “ancestral” allele that showed frequencies between 93% and 100%. Besides, the role of this locus in pigmentation, at least in the zebrafish, has been confirmed experimentally (Lamason et al. 2005). We have confirmed that SLC24A5 may be under positive selection in Caucasians (fig. 3).
We also have observed in this work a similar pattern of EHH distribution supporting positive selection for TYRP1 in Caucasians only (fig. 3). TYRP1 is an enzyme that takes part in the eumelanic pathway. Its main function may be to regulate melanosome maturation, stabilize and maintain tyrosinase protein levels, suppress tyrosinase-mediated cell death protecting against the cytotoxicity of melanin intermediates, or act as a chaperone to tyrosinase (Kobayashi et al. 1998; Rad et al. 2004; Hearing 2005). Mutations in TYRP1 cause OCA3 (OMIM 203290), a form of oculocutaneous albinism characterized by normal amounts of tyrosinase but that shows a reduction in catalytic activity of 70% (Sturm et al. 1998). This role would agree with the observation that tyrosinase levels are similar among the main geographical human groups, but however, black skin have up to 10 times more tyrosinase activity than white skin (Iozumi et al. 1993). TYRP1 has been claimed to play a role in mediating ethnic differences in melanogenesis and constitutive pigmentation in vivo (Alaluf et al. 2003), and interestingly, a link between TYR, TYRP1, and UV irradiation by means of p53 has also been proposed (Nylander et al. 2000).
As the role for SLC24A5 in pigmentation has been functionally confirmed (Lamason et al. 2005) and as TYRP1 functions exclusively in melanogenesis, this indicates that light skin is not simply the result of loss of environmental pressure but that light skin likely holds an adaptive value too. In this sense, when a selected set of 8 SNPs, one per locus, from the DNA damage response group of loci (TP53, TP53BP1, MDM2, RAD50, and BRCA1) in addition to LYST, TYRP1, and SLC24A5 were chosen to run Structure v2.0 (Pritchard et al. 2000), the information contained in this set of SNPs seems to reflect overall patterns of phenotypic pigmentation (fig. 4).
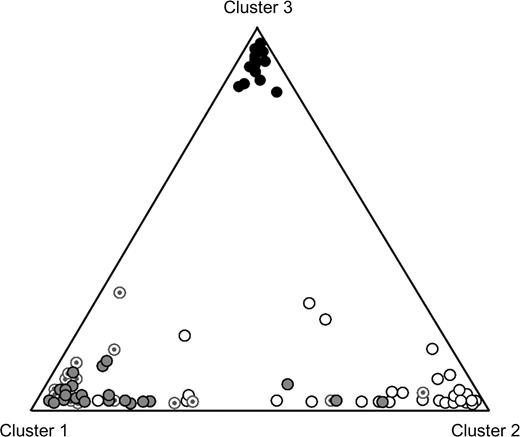
Structure analysis by means of Structure 2.0. Triangle plot representing a “Structure” analysis of the CSHL-HapMap data on 4 populations: Caucasians (light gray circles), Yorubans (black circles), Chinese (white circles), and Japanese (circles with a gray dot inside). Data comprised individual genotypes on 8 SNPs, one from each of the following loci: BRCA1 (rs799912), LYST (rs10803109), MDM2 (rs3730541), RAD50 (rs2522394), SLC24A5 (rs2675348), TP53 (rs2287499), TP53BP1 (rs690367), and TYRP1 (rs1326798), from a total of 255 individuals (individuals with missing values were removed). For the analysis, a run length of 100,000 was determined both for the burning and postburning periods, assuming an ancestry model with admixture and correlated allele frequencies. We evaluated values of K, the number of clusters, from 1 to 4, and for each K, 5 rounds of simulations were made. Of these, a scenario with K = 3 clusters obtained the highest posterior probability (P = 1). Despite the 3 clusters, a gradient of individuals along the Eurasian axis is observed, which can be interpreted as reflecting the continuous variation in the skin pigmentary phenotype within these populations. They are however markedly separated from the Yoruban population.
The mechanisms by which light skin confers a selective advantage cannot be inferred with these data alone. However, the relevance of mechanisms like vitamin D synthesis, which have been claimed to have a role in the evolution of light pigmentation (Robins 1991 and references therein), could be minimized as neither of the representative loci of this pathway (Omdahl et al. 2002) that have been analyzed, VDR (Vitamin D receptor) and VDRIP (Vitamin D3 receptor-interacting protein), CYP27B1 (P450C1), CYP24A1 (P450C24), and RXRA (Retinoid X receptor), showed clear evidence of positive selection.
Thus, although human skin pigmentation may be the result of a complex interaction of environment and genes and of epistatic interactions among genes, many of which may have passed undetected, the present work highlights the likely adaptive value of both light and dark skin, being skin/DNA damage response a possible driving mechanism for the evolution of dark skin pigmentation.
Web Site References
International Federation of Pigment Cell Societies: http://ifpcs.med.umn.edu/micemut.htm.
UCSC genomes browser: http://genome.ucsc.edu/.
Ensembl genome server: http://www.ensembl.org/index.html.
SNP Browser version 2 (Appelera Corp. 2004): http://marketing.appliedbiosystems.com/mk/get/snpb_landing?isource=fr_E_RD_www_allsnps_com_snpbrowser.
Structure v2.0: http://pritch.bsd.uchicago.edu/software/structure2_1.html.
ms program: http://home.uchicago.edu/∼rhudson1/source.html.
Manolo Gouy, Associate Editor
We thank 2 anonymous reviewers, whose comments helped improve the content of the manuscript. S.A. is a Ramón y Cajal Fellow (Spanish Ministerio de Educación y Ciencia). I.G. is a PhD student granted by the Basque Government. Work funded by grants UE03/A02 and 9/UPV 00154.310-14495/2002 from the University of the Basque Country to C.R. and Bizkaitek 2003–2004 from the Diputación Foral de Bizkaia to S.A.
References
Abdel-Malek Z, Kadekaro AL.
Agar N, Young AR.
Akey JM, Eberle MA, Rieder MJ, Carlson CS, Shriver MD, Nickerson DA, Kruglyak L.
Akey JM, Zhang G, Zhang K, Jin L, Shriver M.
Alaluf A, Barret K, Blount M, Carter N.
Aoki K.
Barbosa MDFS, Barrat FJ, Tchernev VT, et al. (14 co-authors).
Barbujani G, Magagni A, Minch E, Cavalli-Sforza LL.
Benjamini Y, Hochberg Y.
Box NF, Duffy DL, Irving RE, Russell A, Chen W, Griffyths LR, Parsons PG, Green AC, Sturm RA.
Chaplin G.
Clark AG, Glanowski SR, Nielsen PD, et al. (17 co-authors).
Garinis GA, Mitchel JR, Moorhouse MJ, et al. (13 co-authors).
Gibbs D, Sassan MA, Lillo C, Kitamoto J, Klomp AE, Steel KP, Libby RT, Williams DS.
Goldman N, Yang Z.
Hall TA.
Harding RM, Healy E, Ray AJ, et al. (11 co-authors).
Healy E, Todd C, Jackson IJ, Birch-Machin M, Rees JL.
Hearing VJ.
Hinds DA, Stuve LL, Nilsen GB, David A, Halperin E, Eskin E, Ballinger DG, Frazer KA, Cox DR.
Iozumi K, Hoganson GE, Pennella R, Everett MA, Fuller BB.
Jans JW, Schul W, Sert YG, et al. (12 co-authors).
Kadekaro AL, Kavanagh RJ, Wakamatsu K, Ito S, Pipitone MA, Abdel-Malek ZA.
Kobayashi T, Imokawa G, Bennet DC, Hearing VJ.
Lamason RL, Mohideen MA, Mest JR, et al. (25 co-authors).
Lee DU, Rao A.
Mundy NI, Kelly J.
Nielsen R, Bustamante C, Clark AG, et al. (13 co-authors).
Nielsen R, Yang Z.
Nylander K, Bourdon JC, Bray SE, Gibbs NK, Kay R, Hart I, Hall PA.
Omdahl JL, Morris HA, May BK.
Palmer JS, Duffy DL, Box NF, Aitken JF, O'Gorman LE, Green AC, Hayward NK, Martin NG, Sturm RA.
Pritchard J, Stephens M, Donelly P.
Quevedo WC, Holstein TJ.
Rad HH, Yamashita T, Jin HY, Hirosaki K, Wakamatsu K, Ito S, Jimbow K.
Rana BK, Hewett-Emmett D, Jin L, et al. (12 co-authors).
Relethford JH.
Robins AH.
Saade NE, Nasr IW, Massaad CA, Safieh-Garabedian B, Jabbur SJ, Kanaan SA.
Sabeti PC, Reich DE, Higgins JM, et al. (17 co-authors).
Scott G, Leopardi S, Printup S, Malhi N, Seiberg M, Lapoint R.
Soni LE, Warren CM, Bucci C, Orten DJ, Hasson T.
Stinchcombe J, Bossi G, Griffiths CM.
Sturm RA.
Sturm RA, Box NF, Ramsay M.
Sturm RA, Teasdale RD, Box NF.
Valerie K, Povirk LF.
Valverde P, Healy E, Jackson I, Rees JL, Thody AJ.
Voight FB, Kudaravalli S, Wen X, Pritchard JK.
Wang B, Matsuoka S, Carpenter PB, Elledge SJ.
Weir BS, Cockerham CC.
Yang Z.
Yang Z.
Yang Z, Nielsen R.
Yang Z, Nielsen R, Goldman N, Pedersen AMK.
Zhang J.
Author notes
*Department Genetics, Physical Anthropology and Animal Physiology, Faculty of Science and Technology, University of the Basque Country, Leioa, Bizkaia, Spain and †Progenika Biopharma, S.A., Edificio 801A, Parque Tecnológico de Zamudio, Derio, Spain
