


Abstract
Studies of microbial eukaryotes have been pivotal in the discovery of biological phenomena, including RNA editing, self-splicing RNA, and telomere addition. Here we extend this list by demonstrating that genome architecture, namely the extensive processing of somatic (macronuclear) genomes in some ciliate lineages, is associated with elevated rates of protein evolution. Using newly developed likelihood-based procedures for studying molecular evolution, we investigate 6 genes to compare 1) ciliate protein evolution to that of 3 other clades of eukaryotes (plants, animals, and fungi) and 2) protein evolution in ciliates with extensively processed macronuclear genomes to that of other ciliate lineages. In 5 of the 6 genes, ciliates are estimated to have a higher ratio of nonsynonymous/synonymous substitution rates, consistent with an increase in the rate of protein diversification in ciliates relative to other eukaryotes. Even more striking, there is a significant effect of genome architecture within ciliates as the most divergent proteins are consistently found in those lineages with the most highly processed macronuclear genomes. We propose a model whereby genome architecture—specifically chromosomal processing, amitosis within macronuclei, and epigenetics—allows ciliates to explore protein space in a novel manner. Further, we predict that examination of diverse eukaryotes will reveal additional evidence of the impact of genome architecture on molecular evolution.
Introduction
Ciliates are microbial eukaryotes with 2 distinct genomes: one in the transcriptionally active macronucleus and the other in the “germline” micronucleus (Katz 2001; Jahn and Klobutcher 2002; Yao et al. 2002). The micronucleus is analogous to other eukaryotic nuclei as it divides via mitosis and meiosis. However, there is no vegetative transcription from micronuclei. In contrast, the macronuclear genome is processed in all ciliates through chromosomal fragmentation and amplification, as well as by the elimination of specific sequences within chromosomes (Jahn and Klobutcher 2002; Yao et al. 2002). These processed genomes divide by amitosis, an imprecise mechanism that allows for differential assortment of alleles during asexual division.
Three classes of ciliates (Spirotrichea, Phyllopharyngea, and Armophorea) extensively process their macronuclear genomes to generate gene-sized chromosomes (Katz 2001; Jahn and Klobutcher 2002). This is in contrast to other ciliates where fragmentation of zygotic chromosomes generates longer macronuclear chromosomes (often >100 kb) that in the case of the completely sequenced Tetrahymena thermophila genome, contain an average of ∼100 genes per macronuclear chromosomes (E Orias, personal communication). Phylogenetic analyses indicate that extensive fragmentation of macronuclear genomes has arisen at least twice, and possibly 3 times, within ciliates (Riley and Katz 2001).
There is increasing evidence of the role of epigenetics in shaping ciliate genomes (reviewed in Meyer and Duharcourt 1996; Yao et al. 2003; Mochizuki and Gorovsky 2004; McGrath et al. 2006). Data supporting epigenetics include experimental modifications of parental macronuclei (e.g., by inserting micronuclear-limited sequences) that are then inherited by newly developing macronuclei (Duharcourt et al. 1995; Chalker and Yao 1996; Duharcourt et al. 1998; Chalker et al. 2005). One model proposed to explain this epigenetic pattern of inheritance is that an RNA interference–based mechanism enables genome scanning between the zygotic nucleus, the parental macronucleus, and the newly developing macronucleus (Mochizuki et al. 2002; Mochizuki and Gorovsky 2004). Although not yet fully understood, it is possible that epigenetics coupled with amitosis shapes chromosomal content in ciliate macronuclei.
Based on discordant genealogies of protein-coding genes and analyses of patterns of evolution in ciliate histone H4 genes, we have previously hypothesized that the rapid protein evolution in ciliates is a result of the unusual architecture of ciliate genomes (Katz et al. 2004; Katz et al. 2006). Ciliate phylogeny cannot be resolved consistently in analyses of various protein-coding genes (elongation factor 1-α [EF1α; Moreira et al. 1999], actin [Bhattacharya and Ehlting 1995; Bhattacharya and Weber 1997], α-tubulin [Israel et al. 2002], and histone H4 [Katz et al. 2004]) due to considerable rate heterogeneity. In addition, analysis of histone H4 revealed that ciliates have accelerated rates of protein evolution, including more divergent paralogs, when compared with other eukaryotic clades (Katz et al. 2004 and references therein).
In this study, we test the effect of genome architecture on protein evolution through analyses of nucleotide substitution and paralog divergence in 1) ciliates compared with other eukaryotes and 2) ciliates with extensive genome processing compared with other ciliates. Across 6 protein-coding genes, we find evidence that genome architecture, specifically extensive chromosomal processing, is associated with increased rates of protein diversification.
Materials and Methods
Data Collection
Sequence data were assembled from 3 sources: complete genomes from the Kyoto Encyclopedia of Genes and Genomes (KEGG) database (Kanehisa 1997; Kanehisa and Goto 2000), sequences from GenBank to capture broad taxonomic diversity, and characterization of additional ciliate protein-coding genes. Complete animal and fungal genomes were sampled from KEGG using a keyword search (Kanehisa 1997; Kanehisa and Goto 2000). GenBank accession numbers associated with KEGG entries are reported (see Supplementary Material online). No complete genomes of plants were available on KEGG at the time of data collection, so plant sequences were obtained from GenBank. Additional genera of animals, fungi, and plants containing most or all of our target genes in GenBank were chosen in each clade in order to get a taxonomically diverse sample (table 1). For ciliates, all species with sequences that met our criteria (below) were used. Ciliates were classified as extensively fragmenting based on the definition of Riley and Katz (2001) as having macronuclear chromosomes less than 15 kb in length with many “gene-size” macronuclear chromosomes. Genes were considered acceptable if they were annotated as the gene of interest and not “similar to” or “predicted.” GenBank sampling excluded expressed sequence tags, sequence tagged sites, genome survey sequence, third party annotation, working draft, and patents. Heat shock protein 90 (HSP90) includes sequences named HSP82 but with additional annotation as HSP90. Only cytosolic HSP90 genes were included (Stechmann and Cavalier-Smith 2003; Leander and Keeling 2004).
Summary of Taxa and Genes Sampled
Major Clade | Lineage | Taxon | Actin | α-Tubulin | β-Tubulin | EF1α | Histone H4 | HSP90 | Data Source |
|---|---|---|---|---|---|---|---|---|---|
| Animal | Mammal | Homo sapiens | 6 | 6 | 10 | 2 | 14 | 3 | KEGG |
| Mammal | Mus musculus | 6 | 7 | 5 | 2 | 12 | 2 | KEGG | |
| Fly | Drosophila melanogaster | 6 | 4 | 4 | 2 | 1 | 1 | KEGG | |
| Bird | Gallus gallus | 6 | 2 | 4 | 1 | 3 | 2 | GB | |
| Bony fish | Danio rerio | 3 | 2 | 2 | 1 | — | 2 | KEGG | |
| Echinoderm | Strongylocentrotus purpuratusa; S. droebechiensisb | 4a | 3b | 1a | 1a | 4a | — | GB | |
| Nematode | Caenorhabditis elegans | 3 | 3 | 4 | 1 | 8 | 1 | KEGG | |
| Annelid | Lumbricus terrestris | 3 | — | — | — | — | — | GB | |
| Mollusc | Mytilus galloprovincialisa; M. edulisb | — | — | — | 1a | 5b | — | GB | |
| Hydrozoan | Hydra attenuataa; H. magnipapillatab | 1a | — | — | 1b | — | — | GB | |
| Tunicate | Ciona intestinalis | — | 3 | — | — | — | — | GB | |
| Sponge | Suberites fuscusa; S. domunculab | — | 1a | 1b | — | — | 1a | GB | |
| Plant | Eudicot | Arabidopsis thaliana | 8 | 6 | 9 | 3 | 8 | 3 | GB |
| Eudicot | Lycopersicon esculentum | — | — | — | 1 | 2 | — | GB | |
| Eudicot | Medicago sativa | — | — | 1 | — | — | — | GB | |
| Monocot | Oryza sativa | 8 | 3 | 5 | 4 | 1 | 1 | GB | |
| Monocot | Zea mays | 3 | 4 | 7 | 2 | 3 | 1 | GB | |
| Moss | Physcomitrella patens | 4 | 2 | 6 | — | — | — | GB | |
| Green alga | Chlamydomonas reinhardtii | 1 | 2 | 2 | — | 4 | — | GB | |
| Fungus | Ascomycete | Saccharomyces cerevisiae | — | 2 | 1 | 1 | 2 | 1 | KEGG |
| Ascomycete | Schizosaccharomyces pombe | 1 | 2 | 1 | 2 | 3 | 1 | KEGG | |
| Ascomycete | Candida albicans | 1 | 1 | 1 | 1 | 1 | 1 | KEGG | |
| Ascomycete | Eremothecium gossypii | 1 | — | 1 | 1 | 1 | 1 | KEGG | |
| Basidiomycete | Cryptococcus neoformans | — | — | — | — | — | 1 | GB | |
| Basidiomycete | Ustilago maydis | — | 1 | — | 1 | 1 | — | GB | |
| Zygomycete | Rhizopus stolonifera; R. microsporusb | 1a | 3b | 3b | 1b | — | — | GB | |
| Microsporidia | Encephalitozoon cuniculi | — | 1 | 1 | — | 1 | — | KEGG | |
| Ciliate | Extensively fragmented | Phyllopharyngea | 1* | 4 | 4* | 2* | 6 | 1* | GB |
| Extensively fragmented | Armophorea | 9* | 6* | 3* | 3* | 5 | — | GB | |
| Extensively fragmented | Spirotrichea | 31 | 27 | 12 | 6 | 24 | 1 | GB | |
| Nonextensively fragmented | Oligohymenophorea | 16 | 9 | 7 | 5 | 8 | 4 | GB | |
| Nonextensively fragmented | Heterotrichea | 2 | 5 | 0 | 4 | 10 | 1 | GB | |
| Nonextensively fragmented | Colpodea | — | 1 | 1 | 1 | — | — | GB | |
| Nonextensively fragmented | Litostomatea | 5 | 3 | — | 2 | — | — | GB | |
| Nonextensively fragmented | Karyorelictea | 1 | 1 | — | 1 | — | — | GB | |
| Nonextensively fragmented | Nassophorea | — | 1 | — | 1 | — | — | GB |
NOTE.—Numbers under protein headings indicate the number of gene copies from each taxon. This number represents only those genes that are >1% divergent at the nucleotide level. Taxon indicates species (plants, animals, and fungi) or class (ciliates). For each ciliate class, the number of paralogs is summed for all species in that class (for a break down by species and GenBank accession numbers, see Supplementary Material online). For some genera, data on the same species were not available for all genes, thus superscript letters are used to indicate which of 2 species within a genus data are from for a given gene. Asterisks indicate that some of the sequences from these taxa were gathered in this study. Data source indicates the database used to collect sequence data: KEGG (http://www.genome.ad.jp/kegg) or GenBank (GB; http://www.ncbi.nlm.nih.gov).
Only sequences at least two-thirds of the full-length gene were included in the analyses. We considered genes to be homologs if there was at least 40% amino acid–sequence identity. Because we lack mapping information for many of the species in our analysis, we cannot positively distinguish alleles from paralogs. Previous studies on ciliates have shown that variation caused by polymerase chain reaction (PCR) error and allelic variation generally ranges from 0% to 0.5% (Riley and Katz 2001; Israel et al. 2002). Thus, for all species, we considered genes to be paralogs only if they were divergent by more than 1% at the nucleotide level. Although this approach may confound recent paralogs with alleles, this is unlikely to have an impact on the broad conclusions of the study. Further, the presence of more than 2 paralogs (defined using 1% cutoff) in many taxa indicates that these sequences are duplicated genes and not alleles. Subsequent analyses included all paralogs from each species.
Additional Ciliate Sequences
Additional sequence data were generated for ciliates with extensively fragmented genomes by amplification, cloning, and sequencing of protein-coding genes from Chilodonella uncinata, Metopus es, and Nyctotherus ovalis. Chilodonella uncinata DNA was extracted from a single-cell isolate clonal line, derived from ATCC 50194. Metopus es DNA was isolated from a population of cells derived from CCAP 1653/2. Nyctotherus ovalis DNA was isolated as previously described (Riley and Katz 2001). Gene fragments were amplified using platinum Taq (Invitrogen, Carlsbad, CA) or Phusion (New England BioLabs, Ipswich, MA) DNA polymerase. The following primers were used in amplification—actin: 245F 5′-AACTGGGAYGAYATGGARAAGAT-3′ and 1080R 5′-ATCCACATYTGYTGGAANGT-3′; β-tubulin: 303+ 5′-GGTGCTGGTAAYAAYTGRGC-3′ and 1278− 5′-ACCAGGTCGTTCATRTTNGA-3′; EF1α: 1F (Baldauf and Doolittle 1997) and 1293− 5′-ATTACACCTACNGCNACNGT-3′; and HSP90: F4 and R2 (Leander and Keeling 2004). Amplified products were cloned using TOPO TA (Invitrogen) or PCR SMART (Lucigen, Middleton, WI) cloning kits and sequenced on an ABI 3100. Based on emerging data from whole macronuclear chromosomes from these species (CL McGrath, RA Zufall, and LA Katz, in preparation), conceptual translations were made using the ciliate MAC genetic code (M. es) or the Universal code (N. ovalis) or using TAA as the only stop codon (C. uncinata).
Sequence Analysis
Alignments of all sequences were generated for each protein by ClustalW (Thompson et al. 1994) as implemented by Megalign (DNAStar, Inc, Madison, WI) with a gap penalty of 10 and gap length penalty of 10. Alignments were adjusted by hand, and regions with gaps found in more than one taxon as well as regions that were not unambiguously aligned were excluded from subsequent analyses.
Genealogies were constructed using amino acid distances calculated in Tree-Puzzle 5.0 (Schmidt et al. 2002) using a JTT model (Jones et al. 1992) with variation in rates among sites estimated by a gamma distribution with 5 rate classes plus invariable sites. These distances were imported into PAUP* 4.0b10 (Swofford 2002) and analyzed using the Neighbor-Joining algorithm. Overall, resulting topologies of genealogies were concordant with proposed organismal phylogenies, with the notable exception of unstable long-branch ciliate sequences (topologies are available from the author upon request). We explored the impact of changing tree topologies on dN/dS estimates using different models and algorithms and found no substantial effect (data not shown).
Likelihood-based analyses of synonymous and nonsynonymous substitution rates were carried out using HyPhy (Kosakovsky Pond et al. 2005) with the MG94 3×4 model, an extension of the model of Muse and Gaut (1994) that allows for unequal base frequencies at each of the 3 codon positions. This model was used to estimate a common dN/dS ratio for each major clade in table 2.
Clade-Based Estimates of dN/dS
Actin | α-Tubulin | β-Tubulin | EF1α | Histone H4 | HSP90 | |
|---|---|---|---|---|---|---|
| Animal | 0.0152 | 0.0098 | 0.0189 | 0.0560 | 0.0032 | 0.0251 |
| Ciliate | 0.0545 | 0.0164 | 0.0306 | 0.1261 | 0.0530 | 0.0548 |
| Fungus | 0.0240 | 0.0291 | 0.0183 | 0.0647 | 0.0200 | 0.0226 |
| Plant | 0.0344 | 0.0142 | 0.0085 | 0.0156 | 0.0049 | 0.0228 |
| Ratio | 1.6 | 0.56 | 1.6 | 1.9 | 2.6 | 2.2 |
NOTE.—The highest value for each gene is in bold. “Ratio” indicates the ratio of the estimated ciliate dN/dS to the highest nonciliate dN/dS.
We used 2 different approaches for comparing the dN/dS ratio between extensively fragmenting and nonextensively fragmenting lineages. For the box plots, the dN/dS ratio was estimated for each branch under the MG94 3×4 model. The box plots display the distributions of these ratio estimates for terminal branches. As described previously (Katz et al. 2004), the effects of outliers were reduced in a conservative manner by setting values less than 10−10 to 0 and estimates of 10 or more to 10. Similarly, dN/dS values were capped at 2. These steps limited the effects of inflated dN/dS outliers, likely arising as the results of the sampling properties of ratio estimators.
We also compare a single ratio of dN/dS estimated for the polyphyletic extensively fragmenting ciliates to the nonextensively fragmenting ciliates. Branches were classified as either extensively or nonextensively fragmenting in a conservative manner (if 2 daughter branches were both extensively fragmenting, the parent branch was designated the same; otherwise, it was considered nonextensively fragmenting). Under this assumption, we are likely underestimating the number of nodes that are extensive fragmenters. We then used features in HyPhy to allow extensively fragmenting branches to have one value of dN/dS and nonextensively fragmenting branches to have a second value. The 2 dN/dS ratios were then estimated by maximum likelihood.
Paralog divergences, both amino acid and nucleotide, were measured as the average of uncorrected pairwise distances between all paralogs of a gene within a species in PAUP* 4.0b10 (Swofford 2002). For this analysis, paralogs were considered only in taxa that were identified to the species level. Importantly, our genealogies revealed no cases of paralogs that were older than the species we sampled (i.e., there were no shared paralogs between species).
Results
To assess the effects of genome architecture on protein evolution in ciliates, we analyzed 6 protein-coding genes (actin, α-tubulin, β-tubulin, EF1α, histone H4, and HSP90) within ciliates and among 3 other well-sampled lineages of eukaryotes: plants, animals, and fungi. Sequence data from plants, animals, and fungi are drawn primarily from completely sequenced genomes, with additional taxa added to capture broader taxonomic diversity within each major clade (table 1 and table S1, Supplementary Material online). Sequence data for ciliates were collected from GenBank or were generated as part of this study. This combined approach is conservative in biasing us toward finding paralogs in completed genomes of plants, animals, and fungi as compared with ciliates.
First, we compared rates of protein diversification between ciliates and other eukaryotes. For 5 of the 6 genes (actin, β-tubulin, EF1α, histone H4, and HSP90), ciliates have the highest estimated ratios of nonsynonymous/synonymous substitution (dN/dS; fig. 1, table 2), indicative of either relaxed functional constraints or positive selection. The values for ciliates are between 1.6- and 2.6-fold greater than those for the next highest clade (table 2). One exception is α-tubulin, where the estimate for fungi (0.029) is 1.8-fold higher than for ciliates (0.016). The probability of ciliates having the highest ratio in 5 or more genes, if there were actually no tendency for ciliates to have the highest ratios, is 0.0046, as computed from a 1-sided binomial distribution (a 1-sided test is appropriate here, given our a priori hypothesis).
Clade-based estimates of dN/dS. The dN/dS ratios (table 2) are shown on the y axis for each gene on the x axis. Each clade is represented by a different symbol. For every gene, except α-tubulin, ciliates have the largest dN/dS.
Next, we compared rates of protein evolution in ciliates with extensively fragmented genomes to other ciliates using 3 methods: 1) branch-based dN/dS (fig. 2, box plots), 2) paralog divergence (fig. 3), and 3) a novel approach that allows comparisons between these 2 nonmonophyletic types of ciliates (ciliates with extensively fragmented genomes vs. those with nonextensively fragmented genomes). For this third approach, we designated every branch in the ciliate genealogies either as a branch with extensively fragmented genomes or as a branch with nonextensive fragmentation, with interior branches labeled as extensively fragmenting only if all of the tips in its subclade were extensively fragmenting (see Materials and Methods). By exploiting capabilities of HyPhy (Kosakovsky Pond et al. 2005), we then allowed the 2 sets of branches to have separate dN/dS ratios and estimated those values using maximum likelihood (fig. 2, boxed dN/dS estimates).
Elevated rates of protein evolution in extensively fragmenting ciliates compared with other ciliates. Extensively fragmenting (EF) ciliates are compared with nonextensively fragmenting (NEF) ciliates by 2 measures. 1) Numbers in the boxes are the ratio of dN/dS estimates for EF to NEF, generated using a new approach for estimates from nonmonophyletic groups. 2) Box plots show the distribution of estimated dN/dS ratios of individual branches. For every protein, both measures show a higher dN/dS in EF ciliates. This demonstrates the effect of genome architecture on rates of protein evolution: more extensive chromosomal processing correlates with increased rates of substitution.
Average pairwise distance among paralogs within a species. Ciliates with extensively fragmented genomes are shown in bold. The number of duplicate genes is in parentheses after the species name. Species are arranged within each protein by increasing average amino acid distance. HSP90 is not shown because only one species of ciliate has sequenced paralogs. In every case, the taxa with the largest amino acid divergences have extensively fragmented genomes, though not all extensive fragmenters have large divergences.
All 3 methods show a striking effect of genome architecture on protein evolution within ciliates; rates of diversification are significantly elevated in ciliates with extensively fragmented genomes when compared with ciliates with nonextensively fragmented genomes. For each of the 6 genes, ciliates with extensive fragmentation have higher estimated dN/dS ratios (fig. 2; 1-tailed sign test, P = 0.016), ranging from 1.1- to 4.0-fold greater than those of other ciliates. Similarly, although the average number of paralogs within a species does not differ between types of ciliates, the most divergent paralogs within ciliates are found in species with extensively fragmented genomes for all 6 genes (fig. 3). In species with divergent paralogs, amino acid distances are sometimes higher than nucleotide divergence, which probably results from saturation of nucleotide substitutions, relaxed constraints, and/or positive selection.
Discussion
Our analyses reveal a consistent and significant pattern of elevated rates of protein evolution associated with changes in genome architecture. When we compare ciliates to other eukaryotes, ciliates show elevated rates of evolution for 5 of the 6 genes that we examined. Within ciliates, the pattern is even stronger as we can compare the impact of multiple origins of lineages with extensive chromosome processing to those without extensive processing. In every case, the most divergent paralogs and highest dN/dS ratios are found in ciliates with extensively fragmented genomes. Together, these data indicate that extensive genome processing allows for more heterogeneous rates of protein diversification.
The choice of 6 conserved genes of varying functions further strengthens the hypothesis that genome architecture drives protein evolution. We had previously reported on this pattern for one of these genes, histone H4, from a subsample of the taxa included here (Katz et al. 2004). However, as this gene is involved in chromatin structure, it was possible that the phenomenon of elevated rates of protein evolution was restricted to genes involved in changes in genome architecture. Here, we report on 5 additional genes involved in a variety of cellular processes, including cilia (tubulins), microfilaments (actin), translation (EF1α), and stress response (HSP90). We also reanalyze histone H4 with additional sampling from complete genomes of plants, animals, and fungi. Analyses of these 6 genes are conservative, given our hypothesis as relaxation of functional constraints and/or adaptive evolution is less likely in conserved genes. We anticipate that the observed pattern will be even stronger in less conserved genes, though comparisons (i.e., dN/dS estimates) may be more difficult for such genes across the time scales (∼1 billion years) considered here.
We elaborate a model to demonstrate how ciliate genome architecture can enable elevated rates of protein evolution. The relevant genomic features in ciliates include differential selection on transcriptionally silent micronuclei versus transcriptionally active macronuclei, chromosome processing (including fragmentation and amplification) following conjugation, and assortment due to amitosis. The model we propose is enhanced further by evidence that epigenetics regulates macronuclear content (see Introduction).
To illustrate our model, we describe the potential fate of deleterious alleles in ciliates (fig. 4). Although alleles are presumably at equal frequency in the macronucleus following conjugation (in the absence of epigenetics), assortment during amitosis can produce macronuclei with different chromosome copy numbers. Assuming deleterious mutations are not completely recessive (e.g., have additive epistatic effects), macronuclei with a lower proportion of alleles with deleterious mutations will be favored by selection (fig. 4A). The effect of this is to allow deleterious mutations to be maintained in the micronucleus at a reduced selective cost when compared with a canonical eukaryotic genome. Subsequently, during the potentially large number of rounds of asexual division, it is possible that the allele carrying the deleterious mutation will acquire a compensatory mutation in the micronucleus (fig. 4B). This compensatory mutation may be included in the macronuclear genome following conjugation. Finally, if there is an epigenetic mechanism whereby the chromosome complement of parental macronuclei is communicated to newly developing macronuclei, such a process will be enhanced. These processes can explain the observed elevated rates of protein evolution in ciliates compared with other eukaryotes.
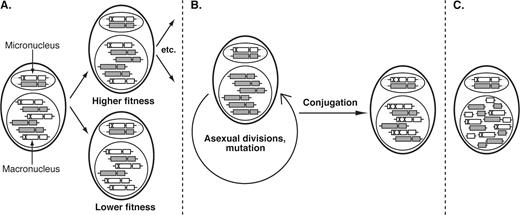
Genome architecture drives protein evolution in ciliates through the impact of selection operating on processed chromosomes in a somatic nucleus that divides by amitosis. Each ciliate contains a germ line micronucleus with a canonical eukaryotic genome, and a somatic macronucleus represented by a large polyploid nucleus. (A) If a deleterious mutation occurs (shown as an X), the chromosome carrying that mutation can be lost following unequal assortment during amitosis of the macronucleus. Although this mutation may eventually be completely eliminated from the macronucleus, it will be present in the micronucleus. (B) During subsequent rounds of asexual division, the micronucleus will acquire additional mutations. Given sufficient time and/or population size, one or more of these mutations may be compensatory. After conjugation, individuals with compensatory mutations can increase in frequency in the population. (C) These processes are exaggerated in ciliates with extensively fragmented genomes, where every allele and locus is able to assort independently.
In ciliates with extensively fragmented genomes, the effects of assortment and amitosis on gene-sized macronuclear chromosomes can explain the significant accumulation of divergent paralogs. The generation of gene-sized chromosomes during macronuclear development breaks up linkage groups such that the fate of each locus is independent of other loci (fig. 4C). Consequently, in lineages with extensively processed genomes, selection can favor macronuclei with lower copy numbers of a deleterious allele without affecting any other locus. This contrasts to other ciliates like Tetrahymena and Paramecium where each macronuclear gene is linked to ∼100 other genes. If allelic/chromosome copy number is heritable through conjugation due to epigenetics, the proposed model becomes more efficient because deleterious alleles/chromosomes can continue to “hide” in the micronucleus after conjugation. The phenotypic consequences of the observed divergent proteins in ciliates with extensively processed genomes remain unknown.
There are many unknown variables in our model, in part due to the very limited data on genomics in nonmodel ciliates (i.e., ciliates other than Tetrahymena and Paramecium). To parameterize this model requires data on factors including mutation rates, degree of unequal assortment during amitosis, frequency of conjugation, and impact of epigenetics in extensively fragmenting ciliate lineages. As such data become available, a quantitative assessment of the verbal model presented here will enable specific predictions about the relationship between genome architecture and protein evolution.
Finally, we argue that the role of genome architecture in driving patterns of molecular evolution is widespread yet often overlooked. A few other well-documented examples exist, including the increased accumulation of deleterious substitutions associated with genome size reduction in intracellular bacteria (reviewed in Moran and Plague 2004) and the extensive RNA editing templated by minicircles in the mitochondrial genomes of trypanosomes (reviewed in Stuart et al. 2005). Yet, the impact of genome architecture remains unexplored in many systems, including the effect of chromosomal processing in 3 lineages of animals (nematodes, copepods, and hagfish): somatic genomes in these lineages develop by rearrangements and elimination of germ line DNA that is at least analogous to what occurs in ciliates (reviewed in Zufall et al. 2005). As more comparative genomic data sets become available for analysis, we predict that genome architecture will increasingly be found to have an impact on molecular evolution.
Present address: Department of Biology and Biochemistry, University of Houston, Houston, Texas.
Present address: Program in Medical and Population Genetics, Broad Institute of Harvard and Massachusetts Institute of Technology, Cambridge, Massachusetts.
Martin Embley, Associate Editor
We thank Jacob Bornstein and Kaveri Rajaraman for their contributions to preliminary analyses. We are also grateful for comments and advice from 3 anonymous reviewers. Portions of this work were carried out while S.V.M. was on sabbatical leave at the National Evolutionary Synthesis Center. This work was supported by grants from the National Science Foundation to S.V.M. (EF 0331654), R.A.Z. (DBI 0301610), and L.A.K. (DEB 043115 and DEB-0092908).
References
Baldauf SL, Doolittle WF.
Bhattacharya D, Ehlting J.
Bhattacharya D, Weber K.
Chalker DL, Fuller P, Yao MC.
Chalker DL, Yao MC.
Duharcourt S, Bulter A, Meyer E.
Duharcourt S, Keller AM, Meyer E.
Israel RL, Kosakovsky Pond SL, Muse SV, Katz LA.
Jahn CL, Klobutcher LA.
Jones DT, Taylor WR, Thornton JM.
Kanehisa M, Goto S.
Katz LA.
Katz LA, Bornstein J, Lasek-Nesselquist E, Muse SV.
Katz LA, Snoeyenbos-West OLO, Doerder FP.
Kosakovsky Pond SL, Frost SDW, Muse SV.
Leander BS, Keeling PJ.
McGrath C, Zufall RA, Katz LA.
Meyer E, Duharcourt S.
Mochizuki K, Fine NA, Fujisawa T, Gorovsky MA.
Mochizuki K, Gorovsky MA.
Moran NA, Plague GR.
Moreira D, Le Guyader H, Philippe H.
Muse SV, Gaut BS.
Riley JL, Katz LA.
Schmidt HA, Strimmer K, Vingron M, von Haeseler A.
Stechmann A, Cavalier-Smith T.
Stuart KD, Schnaufer A, Ernst NL, Panigrahi AK.
Swofford D.
Thompson JD, Higgins DG, Gibson TJ.
Yao MC, Duharcourt S, Chalker DL.
Yao MC, Fuller P, Xi X.
Author notes
*Department of Biological Sciences, Smith College; †Bioinformatics Research Center and Department of Statistics, North Carolina State University; and ‡Program in Organismic and Evolutionary Biology, University of Massachusetts at Amherst
