


Abstract
Teleost fishes provide the first unambiguous support for ancient whole-genome duplication in an animal lineage. Studies in yeast or plants have shown that the effects of such duplications can be mediated by a complex pattern of gene retention and changes in evolutionary pressure. To explore such patterns in fishes, we have determined by phylogenetic analysis the evolutionary origin of 675 Tetraodon duplicated genes assigned to chromosomes, using additional data from other species of actinopterygian fishes. The subset of genes, which was retained in double after the genome duplication, is enriched in development, signaling, behavior, and regulation functional categories. The evolutionary rate of duplicate fish genes appears to be determined by 3 forces: 1) fish proteins evolve faster than mammalian orthologs; 2) the genes kept in double after genome duplication represent the subset under strongest purifying selection; and 3) following duplication, there is an asymmetric acceleration of evolutionary rate in one of the paralogs. These results show that similar mechanisms are at work in fishes as in yeast or plants and provide a framework for future investigation of the consequences of duplication in fishes and other animals.
Introduction
Whole-genome duplication (WGD) is expected to have a large impact on the evolution of lineages in which it has occurred. Understanding this impact necessitates unraveling a complex network of causes and consequences, including which genes are retained in duplicate, and how the duplication modifies their evolutionary constraints. The most progress on these and related issues has been made in the yeast Saccharomyces cerevisiae (Kellis et al. 2004; Davis and Petrov 2005; Scannell et al. 2006) as well as in the plant Arabidopsis thaliana (Blanc and Wolfe 2004; Maere et al. 2005). Studies in animals are less advanced, may be because the species that are the easiest to study did not experience such genome duplication (fruit flies and nematodes).
Three WGD events have been proposed in ancient vertebrate history: 2 at the origin of the group and a third specific to fishes (Meyer and Van de Peer 2005). Although the 2 rounds of duplication at the origin of vertebrates remain controversial (but see Dehal and Boore 2005), fishes have provided the first clear demonstration of ancient genome duplication in vertebrate evolution (Jaillon et al. 2004; Woods et al. 2005). More recent tetraploids are known in many vertebrate lineages (Otto and Whitton 2000), but they do not give insight into the longterm consequences of duplication and cannot explain the eventual success of tetraploid lineages, in the way that more ancient duplications do. Thus, fishes provide a unique platform to study genome duplication in vertebrates.
A genome duplication was originally suggested in ray-finned fishes based on the finding that zebrafish and medaka possess 7 Hox clusters (Amores et al. 1998; Wittbrodt et al. 1998; Naruse et al. 2000), against 4 in mammals and 1 in most invertebrates, as well as by comparative mapping (Postlethwait et al. 2000), but it was only confirmed with the release of 2 pufferfishes' genome sequences. First, 2 studies identified many short duplicated groups of linked genes (paralogons) in the Takifugu rubripes genome and dated duplications with a molecular clock to a window between divergence of ray-finned fishes from tetrapods and diversification of teleost fishes (Christoffels et al. 2004; Vandepoele et al. 2004). Second, all chromosomes of Tetraodon nigroviridis were assigned to paralogons, demonstrating the genome scale of the duplication, and each pair of paralogons was shown to be homologous to 1 (nonduplicated) human chromosomal region (Jaillon et al. 2004). It has been estimated that 76% to 80% of paralogs were secondarily lost after the WGD (Jaillon et al. 2004; Woods et al. 2005).
When did this duplication occur? Direct dating of fish gene duplications has relied on molecular clock methods with large error bars, using 2 closely related Tetraodontiformes (Tetraodon and Takifugu). Molecular clock dating can be biased by saturation of synonymous changes at the timescales considered as well as by changes in evolutionary rates between mammals and fishes and in duplicate genes (Robinson-Rechavi and Laudet 2001; Van de Peer et al. 2001; Jaillon et al. 2004; Jordan et al. 2004; Venkatesh et al. 2005). Less sensitive to these problems, phylogenies of a few tens of gene families have shown a high frequency of gene duplications to be a common feature among sampled teleosts, but not among other fishes (Robinson-Rechavi et al. 2001; Hoegg et al. 2004), confirmed by the distribution of Hox complexes (Crow et al. 2006). Finally, comparative mapping shows that paralogons are homologous between Tetraodon and zebrafish (a Cypriniforme), confirming that the WGD occurred before the divergence of these 2 lineages of teleosts (Woods et al. 2005).
The aim of this study is to provide a framework for understanding the consequences of WGD in teleost fishes. Duplicate genes were characterized by phylogeny, evolutionary rates, and functional classification. We used the 2 published fish genomes as well as other available fish data.
Materials and Methods
We combined predicted genes from genome sequences and gene sequences from databases. Genes from the freshwater pufferfish T. nigroviridis were from the published version of the genome (Jaillon et al. 2004) (8.2X coverage). Genes from the pufferfish T. rubripes (Aparicio et al. 2002) and the unpublished genome of the zebrafish Danio rerio were from Ensembl (Hubbard et al. 2002), versions 22.2c and 22.3b, respectively. These genomic data were complemented with all actinopterygian fish proteins from the Hovergen “clean prot” database version 44 (Duret et al. 1994). This database classifies vertebrate genes in homologous families, excluding partial sequences with less than 80% coverage of the alignment of complete proteins, and provided us directly with protein alignments to compare with the genes from genomes. In addition, human and mouse proteins were recovered from Swissprot and its complement TrEMBL (Boeckmann et al. 2003), as outgroups to actinopterygian fishes. Amino acid sequences were aligned using ClustalW (Thomson et al. 1994), followed by manual adjustments if needed.
We defined groups of paralogs as 2 or 3 Tetraodon genes that have the same human best hit from Swissprot, using Blast with the settings used for “exofish” gene detection (Roest Crollius et al. 2000; Jaillon et al. 2004); “best hit” was defined according to Blast score (Altschul et al. 1997). To reinforce phylogenetic with mapping analysis, we used only groups with at least 2 genes mapped to Tetraodon chromosomes. This defines a set of 704 pairs with both paralogs assigned to chromosomes, plus 419 triplets with at least 2 paralogs assigned to chromosomes, making a total of 1,123 gene families to investigate. For each corresponding amino acid alignment, a preliminary phylogenetic tree was estimated by Neighbor-Joining (Saitou and Nei 1987) with rate heterogeneity between sites corrected for by a gamma law of parameter alpha set to 0.8 and 500 bootstrap replicates. Phylogenies were then refined with regard to species sampling and partial sequences in Phylo_win (Galtier et al. 1996) and interpreted manually. All phylogenies are available in the Supplementary Material online.
The rate of gene loss after genome duplication was computed using the subset of genes that are mapped to Tetraodon chromosomes and have a clear orthology relation between human and Tetraodon. Orthology was defined either from the phylogeny or by reciprocal best Blast hit, for cases of one-to-one homologs. There are 2,371 such human genes, of which 364 have 2 Tetraodon co-orthologs, which were shown in our analysis to be duplicated in the fish-specific genome duplication. This gives a rate of gene retention after the duplication of 15% (364/2,371). The figure of 378 in table 1, instead of 364, includes fish genes for which human orthology is not clear.
Distribution of Tetraodon Gene Duplications by Phylogenetic Relative Dating
Ancestral Fish-Specific Duplication | ||||||||
|---|---|---|---|---|---|---|---|---|
| Chromosome Distribution | Ancestral Vertebrate Duplication | Strong Evidencea | Unrootedb | Weak Supportc | Recent Duplication | Total | ||
| Same | 14 | 12 | 11 | 2 | 10 | 49 | ||
| Different | 247 | 213 | 120 | 20 | 26 | 626 | ||
| All | 261 | 378 | 36 | 675 | ||||
NOTE.—Classification of all genes that have at least 2 paralogs in the Tetraodon nigroviridis genome, which share the same human ortholog, and for which both paralogs are mapped to T. nigroviridis chromosomes. Duplications are considered “ancestral to vertebrates” if they occurred in vertebrates before the actinopterygian/tetrapod divergence (fig. 1A). Duplications are considered “ancestral to fishes” if at least 1 order of fishes outside percomorphs shares the duplication (fig. 1B). There are 447 gene phylogenies that could not be classified because of low phylogenetic resolution or because only Tetraodon and Takifugu sequences were available among fishes, making phylogenetic dating impossible.
Phylogenies with a clear outgroup, Neighbor-Joining bootstrap support over 75%, and consistent results with different methods.
Phylogenies with good support, as in the footnote “a,” but no good outgroup sequences available for rooting.
Phylogenies with low bootstrap support (under 75%) in Neighbor-Joining or different results depending on methods.
For evolutionary rate computations, amino acid alignments were extended to the nucleotide coding sequences. For each pair, the number of synonymous substitutions per synonymous site, Ks, and the number of nonsynonymous substitutions per nonsynonymous site, Ka (Li 1993; Pamilo and Bianchi 1993), were calculated using the “diverge” option of the GCG software. We removed pairs with null Ka or Ks values and pairs for which Ka or Ks were not computable because sites were too few. We also manually removed predicted proteins containing clear frameshifts. Thus, evolutionary rates were computed for 254 WGD and 1,666 singleton genes (categories defined in fig. 2). For evolutionary rate computations, we updated the predicted Takifugu genes to version 31.2 from Ensembl, and we added human and mouse genes from Ensembl version 36.
Human orthologs of mapped duplicated Tetraodon genes, as determined by phylogenetic analysis, were compared for over- or underrepresentation of Gene Ontology (GO) terms (Ashburner et al. 2000), using GOToolBox (Martin et al. 2004), with the hypergeometric test, and the Benjamini and Hochberg (1995) correction for multiple testing. The reference data set was composed of all human orthologs of mapped Tetraodon genes.
Results
Phylogenetic and Chromosomal Classification of Duplicated Genes
We identified 1,123 pairs or triplets of Tetraodon paralogs with the same human best hit and for which at least 2 genes were mapped to Tetraodon chromosomes. We conducted a phylogenetic analysis of each of the corresponding gene families, of which 675 could be classified with respect to gene duplication in fishes. Phylogenetic reconstruction was used to date duplication events, relatively to speciation events (fig. 1), as opposed to molecular clock dating. Phylogenies of duplicate genes can be biased by rate differences when few species and simple methods are used (Van de Peer et al. 2002; Fares et al. 2006). Although we can never guarantee the accuracy of all reconstructions, care was taken to maximize taxonomic sampling, to take into account the rate heterogeneity among sites, and to check automatic alignment results. Altogether, we analyzed sequences from 112 species of ray-finned fishes, sampling 13 lineages (Percomorpha + 12 actinopterygian orders). The most notable contribution was from zebrafish, which is included in 90% of the phylogenies; 79% of phylogenies include only zebrafish and the 2 Tetraodontiformes. We also checked for long-branch attraction a la Fares et al. (2006) by comparing evolutionary rates: there is no significant difference between the “ancestral vertebrate” paralogs and the “ancestral fish-specific” paralogs (not shown). Among paralogs that diverged in the teleost fishes (table 1), most duplicated before the divergence of main teleost fish lineages (e.g., fig. 1B). We take these pairs to be the best markers of the teleost fish–specific WGD in the following analyses.
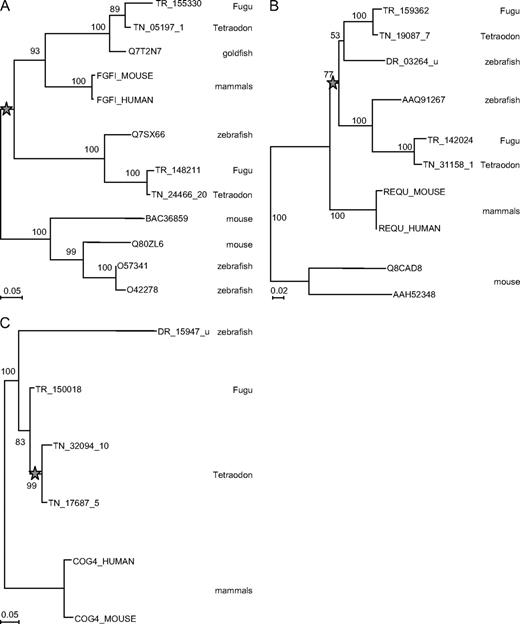
Examples of relative dating of gene duplications by phylogeny. Representative examples of the main phylogenetic scenarios observed. Neighbor-Joining phylogenetic trees, with substitutions corrected for heterogeneity between sites by a gamma law (α = 0.8); Maximum Likelihood gives identical topologies (not shown). Branch length is proportional to the number of substitutions per site (see measure bar for each tree); numbers at nodes are support in percentage of 500 bootstrap replicates. The stars represent the duplication that led to 2 Tetraodon paralogs in each case. (A) Fibroblast growth factor-18 precursor, duplicated before the tetrapod–actinopterygian split (ancestral vertebrate duplication), with secondary loss of 1 copy in mammals, leading to 2 copies in fishes but only 1 in human; clade BAC36859–O42278 is a more distant paralog used as an outgroup. (B) Zinc-finger protein ubi-d4 (Requiem), duplicated anciently in fishes; clade Q8CAD8–AAH52348 is a more distant paralog used as an outgroup. (C) Conserved oligomeric Golgi complex component 4, duplicated specifically in Tetraodon, after the divergence with other fishes.
A previous classification of Tetraodon paralogs, based on a simple synonymous molecular clock (Jaillon et al. 2004), provided evidence for paralogons, that is, large duplicated regions that often comprise whole chromosomes. We repeated this analysis, but using exclusively the paralogs whose period of duplication has been phylogenetically verified to be fish specific (Supplementary Figure I, Supplementary Material online). This confirms the coverage of the Tetraodon genome by paralogons in a robust manner. Two-thirds of all ancient fish-specific paralogs are part of a duplicated block of at least 5 genes. Conversely, recent duplicates are the only class of paralogs that are frequently neighbors on the same chromosome (table 1).
Consistency between chromosomal order and phylogeny supports the validity of our phylogenetic analysis in identifying the paralogs from WGD (Fares et al. 2006). This also provides a verification of the “ancestral vertebrate” paralogs (table 1): 80% are not included in fish-specific paralogons, consistent with a separate origin. Interestingly, these “ancestral vertebrate” paralogs define 6 duplicated blocks (of at least 5 genes), which are distinct from the fish-specific paralogons; these may be remnants of ancestral vertebrate genome duplication (Dehal and Boore 2005).
We verified orthology relations between zebrafish and Tetraodon chromosomes (Supplementary Figure II, Supplementary Material online): most zebrafish duplicated linkage groups are indeed orthologous to Tetraodon paralogons. The duplicated blocks from 1 species for which we did not identify an homologous duplicated block in the other species are those defined by the smallest number of gene pairs. Thus, the combined phylogenetic and mapping analysis confirms that the paralogons covering Tetraodon and zebrafish chromosomes find their origin in a WGD that took place before the divergence of these species. This is consistent with the findings of Woods et al. (2005), based on linkage mapping.
Genome duplication in fishes was followed by massive gene loss because most genes in the Tetraodon or Takifugu genomes are not found in characteristic gene pairs. Out of 2,371 human genes with a clear orthology relation to mapped Tetraodon genes, 364 have a phylogenetic profile typical of the WGD in Tetraodon (see Materials and Methods). This gives an estimate of 15% of gene pairs retained after the WGD, that is, loss of one of the paralogs in 85% of pairs. This is slightly higher than the estimates of 76% to 80% reached by more approximate methods (Jaillon et al. 2004; Woods et al. 2005). It is possible that 85% is still an underestimate because we neglect the fast-evolving genes for which a human ortholog is not detected and which may be more likely to lose a paralog after duplication. The exact figure of gene loss remains to be determined, ideally by comparison to a closer nonduplicated genome, such as that of nonteleost fish. To improve our understanding of the process of gene loss and retention, we compared the characteristics of paralogs from the WGD to those of nonduplicated genes.
Evolutionary Rates of Duplicate Genes
We first compared the substitution rates between Tetraodon and Takifugu orthologs. As they all diverged at the time of the Tetraodon/Takifugu speciation, we can directly convert differences between evolutionary distances (Ka and Ks) into differences between evolutionary rates. We see 2 clear trends (fig. 2A): WGD paralogs differ from singleton genes and there is asymmetry between the 2 paralogs from WGD. The most significant differences are in selective pressure, as measured by the Ka/Ks ratio. But these differences can be due either to changes in selective patterns after duplication, or to bias in the genes kept after duplication, or to a combination of both. To distinguish these possible causes, we tested rates that are phylogenetically independent of the duplication.
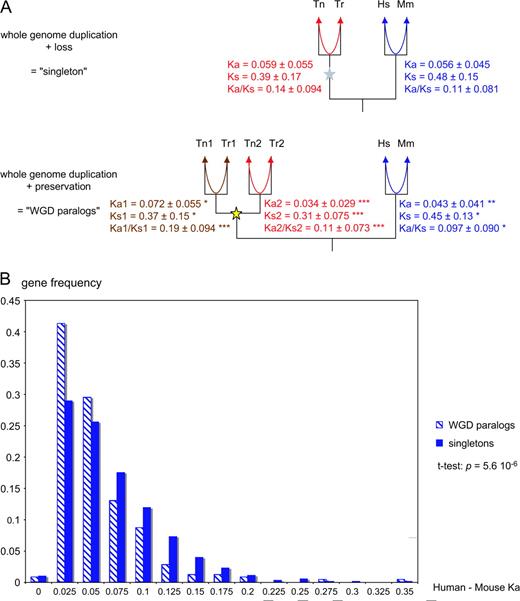
Evolutionary rates of singleton and duplicate genes in Tetraodon nigroviridis. (A) Genes are classified according to duplication history. Tn = T. nigroviridis; Tr = Takifugu rubripes; Hs = Homo sapiens; Mm = Mus musculus. Ka = mean number of nonsynonymous substitutions per nonsynonymous site, measuring protein evolutionary rate; Ks = mean number of synonymous substitutions per synonymous site, measuring neutral evolutionary rate; Ka/Ks = mean ratio of nonsynonymous to synonymous substitutions, measuring selective pressure. All means are ± standard deviation. The arrows indicate which sequences were compared. In red and brown, the comparison between pufferfish orthologs; for WGD paralogs, we report separately the values for ortholog pairs with highest Ka (in brown) and with lowest Ka (in red); stars indicate a significant difference to the pufferfish singleton values (unpaired t-test: * P < 0.05; ** P < 10−4; *** P < 10−6). In blue, the comparison between mouse and human orthologs; stars indicate a significant difference to the mammalian singleton values. (B) Frequency distributions of Ka values between human and mouse orthologous genes, according to their duplication history in fishes.
Comparing the evolutionary rates between mouse and human orthologs of the fish genes, we find results similar to the slower WGD paralogs in pufferfishes, with notably lower Ka in the orthologs of pufferfish genes that were kept in double (fig. 2A and B). Mammalian orthologs of fish WGD pairs evolve 23% slower than orthologs of singletons. These differences in evolutionary rates between orthologs of singletons and those of duplicates cannot be due to the fish WGD. Instead, they show that the fish genes that were already under the strongest selective pressure were retained as duplicates after the genome duplication.
Another feature to take into account is that teleost fish genes seem to evolve faster, under weaker constraint, than mammalian genes (Robinson-Rechavi and Laudet 2001; Jaillon et al. 2004; Steinke et al. 2006). Indeed, in our data, the Ka/Ks ratio is systematically higher in pufferfishes than in mammalian orthologs (fig. 2A). The difference is highly significant for singleton genes and fast-evolving paralogs (paired t-test: P < 2.2 × 10⁻¹⁶) but not for slow-evolving paralogs. The latter are thus under relatively high selective pressure, typical of mammalian rather than pufferfish genes. Of note, the divergence time between Tetraodon and Takifugu was recently reassessed at 85 MYA (Yamanoue et al. 2006), similar to the divergence between human and mouse. This affects neither relative rate tests (Robinson-Rechavi and Laudet 2001; Steinke et al. 2006) nor comparisons of Ka/Ks ratios (this study), which are both independent of divergence time.
Once we have established contributions to evolutionary rate, which are not a direct result of duplication (biased retention and species-specific differences), can we also measure the direct effect of duplication? Lower purifying selection is expected on redundant genes after duplication. In principle, both paralogs could experience released selection and higher rates, or the relaxation could be restricted to only one paralog, whereas the other would conserve ancestral constraints and evolutionary rates. We first tested whether the observed difference between WGD paralogs is meaningful. Indeed 2 homologous gene pairs will never have exactly the same rate because of stochastic as well as mechanistic factors, such as variations in mutation rates along the genome. For this, we contrast variation in Ka to variation in Ks, used as a proxy for neutral variation in evolutionary rate. The relative variation in Ka is significantly larger than the variation in Ks (figs. 2A and 3), supporting a selective difference between the paralogs. A striking 36% of paralogous pairs have higher Ka variation than predicted by the neutral distribution (ΔKa higher than the 97.5th percentile of ΔKs distribution). And this is a conservative estimate, considering that for 81% of paralogs, ΔKa is higher than ΔKs, indicating potential selective differences. The results are similar if we exclude pairs with mean Ka < 0.05, to account for possible stochastic effects on small numbers of substitutions (not shown). Thus, the rate differences between the 2 paralogs can be largely interpreted in terms of selective differences.
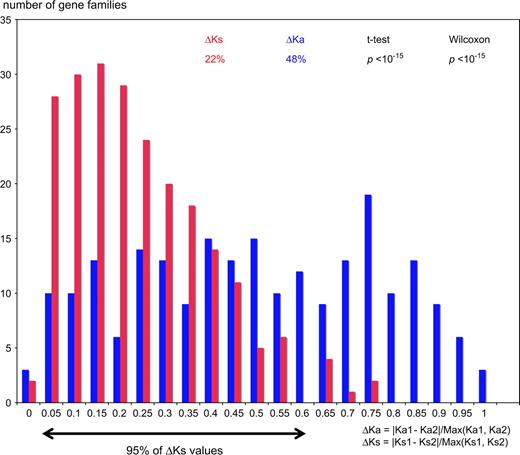
Variation in evolutionary rates after WGD in Tetraodontiformes. Distributions of ΔKs (red) and ΔKa (blue) values between WGD paralogs. Ka1, Ka2, Ks1, and Ks2 as defined in figure 2A. The arrow shows the range of variation in ΔKs for 95% of gene pairs, defining a neutral expectation of rate variation between paralogs.
If we compare the rates of these paralogs to those of mammalian orthologs on the one hand and to singleton pufferfish genes on the other, it seems that the slower copy has retained the strong constraint of its ancestor (Ka2/Ks2 not significantly different from mammalian ortholog Ka/Ks), whereas the other copy has experienced a large relaxation of selective constraint (Ka1/Ks1 highest of any subset of data, P < 10−6 in all comparisons).
We have only identified 36 unambiguous recently duplicated genes in Tetraodon, and Ka and Ks can be computed for both fishes and mammals for only 23 of them. This low number limits statistical power, but we observe that on average they have intermediary evolutionary rates and selective pressures, between those of paralogs from the WGD and those of singletons (i.e., Ka of mammalian orthologs = 0.052). Interestingly, there appear to be selective differences between these recent paralogs, as between WGD paralogs, although sample size limits significance (ΔKa = 39%; ΔKs = 22%; P = 0.056).
Functional Classification of Duplicate Genes
We examined the possibility that the genome duplication may have retained duplicate genes in specific functional classes, by using the GO classification (Ashburner et al. 2000) of human orthologs of Tetraodon genes. Orthologs of WGD paralogs are significantly enriched in terms that relate to development, signaling, behavior, and regulation (table 2). This enrichment is confirmed if we consider the less detailed level 2 GO terms (not shown), with notably an excess of genes associated to the biological process “development” (P = 0.0065). Conversely, they are depleted in terms describing fundamental processes of the cell, such as metabolism or catalytic activity. For the most part, the same terms are enriched or depleted in the recently duplicated genes, but low sample size again limits significance (not shown).
Functional Classification of Tetraodon Duplicated Genes
Ontology | GO Term | Observed Gene Number | Enrichment/Depletion | P Value |
|---|---|---|---|---|
| Biological process | Cell communication | 43 | ×1.79 | 3.7 × 10−06 |
| Organismal physiological process | 24 | ×2.04 | 1.2 × 10−04 | |
| Death | 10 | ×2.86 | 9.5 × 10−04 | |
| Locomotory behavior | 6 | ×3.21 | 0.0054 | |
| System development | 9 | ×2.14 | 0.012 | |
| Mesoderm development | 3 | ×5.15 | 0.012 | |
| Tissue development | 5 | ×2.67 | 0.023 | |
| Regulation of cellular process | 29 | ×1.24 | 0.037 | |
| Response to stimulus | 19 | ×1.35 | 0.039 | |
| Regulation of physiological process | 28 | ×1.22 | 0.042 | |
| Metabolism | 54 | ÷1.31 | 4.4 × 10−05 | |
| Cellular physiological process | 77 | ÷1.06 | 0.050 | |
| Molecular function | Pattern binding | 6 | ×3.16 | 0.0059 |
| Neurotransmitter binding | 4 | ×3.74 | 0.013 | |
| Structural constituent of eye lens | 2 | ×8.42 | 0.014 | |
| Ion binding | 30 | ×1.33 | 0.017 | |
| Carbohydrate binding | 6 | ×2.53 | 0.018 | |
| Channel or pore class transporter activity | 4 | ×2.59 | 0.045 | |
| Catalytic activity | 41 | ÷1.28 | 0.0045 | |
| Nucleic acid binding | 13 | ÷1.54 | 0.018 | |
| Oxidoreductase activity | 4 | ÷2.23 | 0.027 | |
| Ligase activity | 1 | ÷4.87 | 0.029 | |
| Hydrolase activity | 13 | ÷1.45 | 0.031 | |
| Nucleotide binding | 13 | ÷1.43 | 0.034 | |
| Cellular component | Connexon complex | 3 | ×8.22 | 0.0018 |
| Extracellular matrix (sensu Metazoa) | 9 | ×2.54 | 0.0038 | |
| Membrane | 35 | ×1.28 | 0.017 | |
| Membrane-bound organelle | 39 | ÷1.30 | 0.0029 | |
| Intracellular organelle | 45 | ÷1.23 | 0.0051 | |
| Intracellular | 58 | ÷1.13 | 0.015 |
NOTE.—Statistics on human orthologs of Tetraodon genes, which were classified according to duplication history as in figure 2. The observed gene number is the number of human genes annotated for each term. Only GO terms of level 3 or higher with a significant enrichment or depletion in paralogs from WGD are reported (P ≤ 0.05 after correction for multiple tests). Enrichment (× n) and depletion (÷ n) are reported as the ratio between expected and observed frequency of terms, based on expectations from human genes that were defined as orthologs of Tetraodon genes in the combined phylogenetic and mapping analysis.
Discussion
We interpret our results in light of the now classical “duplication–degeneration–complementation” (DDC) model for the functional consequences of gene duplication (Force et al. 1999). The DDC model proposes 3 possible fates for the new paralogs: nonfunctionalization, in which 1 copy is lost and the situation reverts to its preduplication state; neofunctionalization, in which 1 copy acquires a new function while the other keeps the ancestral function; and subfunctionalization, in which each copy loses part of the ancestral function, both copies being required then to keep the full function active. It is clear from genomic studies that nonfunctionalization is the main fate of duplicate genes: gene loss appears to have been 88% in about 80 Myr since genome duplication in yeasts (Kellis et al. 2004), 70% in ≤86 Myr in Arabidopsis (Bowers et al. 2003), and 79% in about 61–67 Myr in cereals (Paterson et al. 2004). The figure of 85% we obtain for gene loss in Tetraodon is similar to the observations in other lineages, despite the greater age of the event; even less gene loss has been reported based on similarity hits without phylogenetic analysis (Jaillon et al. 2004; Woods et al. 2005). This is probably because most gene loss occurs rapidly after duplication (Lynch and Conery 2000; Jaillon et al. 2004; Scannell et al. 2006), so that subsequent evolution does not change the figure significantly.
Slowly evolving genes are more likely to be found duplicated in the yeast S. cerevisiae and the nematode worm Caenorhabditis elegans (Davis and Petrov 2004). The bias is similar in both yeast and worm and is maintained over evolutionary time, indicating that gene retention was also biased after the WGD in yeast. Jordan et al. (2004) also showed that genes that have paralogs evolve slower than singletons, in several eukaryotic and prokaryotic genomes, but did not use a phylogenetic framework with independent estimates of duplication and evolutionary rate. Using phylogenetically independent estimates, we show that such a bias exists in duplicated genes in a vertebrate genome (fig. 2): nonduplicated mammalian orthologs of gene pairs retained from a WGD in fishes evolve 23% slower in mammals than orthologs of singleton genes. This is a comparable figure to observations for nematode and yeast genes (Davis and Petrov [2004] computed differences relative to the slower rate; this gives 30% in fishes, compared to 25% in nematode and 50% in yeast). Because these gene pairs result from 1 WGD event, where all genes were duplicated, the bias must come from a differential retention of the duplicates, rather than a biased generation.
Unraveling the contributions of biased retention, different rates in fishes and mammals, and duplication itself, we find evidence for asymmetric acceleration of protein evolution after WGD. A recent study found evidence for different rates of evolution between fish-specific paralogs in 24 genes as well as for increased rates of radical amino acid substitution (Steinke et al. 2006), although it is not clear to what extent this constitutes evidence for positive selection. In yeast, differences in evolutionary rate between WGD paralogs have been found to be pervasive and associated to some evidence for positive selection on amino acid sites (Fares et al. 2006). In that study, it was estimated that 19% of duplicate genes have fixed amino acids by positive selection. We find considerably higher differences in Ka than in Ks between paralogs, which also indicates a change in selective pressure, for at least 36% of gene pairs. The difference appears due to acceleration of nonsynonymous rate in 1 paralog of the pair, whereas the other keeps the ancestral constraint. Therefore, as in yeast, fly, and nematode (Conant and Wagner 2003; Kellis et al. 2004), results are suggestive of neofunctionalization of duplicated genes in vertebrates, insofar as this can be indicated by evolutionary rates. This would be in agreement with the original evolutionary theory of Ohno (1970) as well as with a more recent model of subfunctionalization followed by neofunctionalization (He and Zhang 2005).
Retention of duplicates is also biased with regard to function (table 2). The excess of development and signaling functions supports the much discussed idea that genome duplication may have played an important role in establishing developmental diversity of fishes (Vogel 1998; Wittbrodt et al. 1998; Meyer and Schartl 1999; Venkatesh 2003; Postlethwait et al. 2004; Meyer and Van de Peer 2005; Volff 2005). The duplication may also have been important in establishing behavioral diversity. Interestingly, by a quite different approach, Steinke et al. (2006) found an excess of transcription factors among genes with accelerated evolution or specific duplication in fishes. The enrichment in communication and developmental genes is consistent with observations in insects and yeasts (Jordan et al. 2004) and Arabidopsis (Maere et al. 2005), although another study found an enrichment of metabolic genes in Arabidopsis (Blanc and Wolfe 2004), and contrasting results were found in mammals (Nembaware et al. 2002; Jordan et al. 2004).
In conclusion, the consequences of WGD in fishes have been mediated both by biased gene loss, resulting in enrichment of development, signaling, or behavioral genes compared with mammals, and by changes in selective pressure, asymmetric between duplicates. The functional consequences of these changes remain to be explored.
Kenneth Wolfe, Associate Editor
We are grateful to the Sanger Institute for making zebrafish genome data publicly available. Laurent Duret and Simon Penel helped with fish data from Hovergen. F.G.B. and V.L. acknowledge support from Région Rhone-Alpes, Ministére de l'éducation nationale, de la recherche et de la technologie, European Union, and Institut national de la recherche agronomique.
Funding to pay the Open Access publication charges for this article was provided by Etat de Vaud.
References
Altschul SF, Madden TL, Schaffer AA, Zhang J, Zhang Z, Miller W, Lipman DJ.
Amores A, Force A, Yan YL, et al. (13 co-authors).
Aparicio S, Chapman J, Stupka E, et al. (41 co-authors).
Ashburner M, Ball CA, Blake JA, et al. (20 co-authors).
Benjamini Y, Hochberg Y.
Blanc G, Wolfe KH.
Boeckmann B, Bairoch A, Apweiler R, et al. (12 co-authors).
Bowers JE, Chapman BA, Rong J, Paterson AH.
Christoffels A, Koh EG, Chia JM, Brenner S, Aparicio S, Venkatesh B.
Crow KD, Stadler PF, Lynch VJ, Amemiya C, Wagner GP.
Davis JC, Petrov DA.
Davis JC, Petrov DA.
Dehal P, Boore JL.
Duret L, Mouchiroud D, Gouy M.
Fares MA, Byrne KP, Wolfe KH.
Force A, Lynch M, Pickett FB, Amores A, Yan Y-l, Postlethwait J.
Galtier N, Gouy M, Gautier C.
He X, Zhang J.
Hoegg S, Brinkmann H, Taylor JS, Meyer A.
Hubbard T, Barker D, Birney E, et al. (35 co-authors).
Jaillon O, Aury J-M, Brunet F, et al. (61 co-authors).
Jordan IK, Wolf YI, Koonin EV.
Kellis M, Birren BW, Lander ES.
Li WH.
Lynch M, Conery JS.
Maere S, De Bodt S, Raes J, Casneuf T, Van Montagu M, Kuiper M, Van de Peer Y.
Martin D, Brun C, Remy E, Mouren P, Thieffry D, Jacq B.
Meyer A, Schartl M.
Meyer A, Van de Peer Y.
Naruse K, Fukamachi S, Mitani H, et al. (20 co-authors).
Nembaware V, Crum K, Kelso J, Seoighe C.
Pamilo P, Bianchi NO.
Paterson AH, Bowers JE, Chapman BA.
Postlethwait J, Amores A, Cresko W, Singer A, Yan Y-L.
Postlethwait JH, Woods IG, Ngo-Hazelett P, Yan YL, Kelly PD, Chu F, Huang H, Hill-Force A, Talbot WS.
Robinson-Rechavi M, Laudet V.
Robinson-Rechavi M, Marchand O, Escriva H, Bardet P-L, Zelus D, Hughes S, Laudet V.
Roest Crollius H, Jaillon O, Bernot A, et al. (12 co-authors).
Saitou N, Nei M.
Scannell DR, Byrne KP, Gordon JL, Wong S, Wolfe KH.
Steinke D, Salzburger W, Braasch I, Meyer A.
Thomson JD, Higgins DG, Gibson TJ.
Van de Peer Y, Frickey T, Taylor JS, Meyer A.
Van de Peer Y, Taylor JS, Braasch I, Meyer A.
Vandepoele K, De Vos W, Taylor JS, Meyer A, Van de Peer Y.
Venkatesh B, Tay A, Dandona N, Patil JG, Brenner S.
Woods IG, Wilson C, Friedlander B, Chang P, Reyes DK, Nix R, Kelly PD, Chu F, Postlethwait JH, Talbot WS.
Author notes
*Laboratoire de Biologie Moléculaire de la Cellule, INRA LA 1237, CNRS UMR5161, IFR 128 BioSciences Lyon-Gerland, Ecole Normale Supérieure de Lyon, Lyon, France; †Dyogen Group, CNRS UMR8541, Ecole Normale Supérieure, Paris, France; ‡Structure et évolution des génomes, CNRS UMR8030, Genoscope, Evry, France; §Laboratoire de Biométrie et Biologie Evolutive, CNRS UMR5558, Université Claude Bernard Lyon 1, Villeurbanne, France; and ∥Department of Ecology and Evolution, Biophore, University of Lausanne, Lausanne, Switzerland
