-
PDF
- Split View
-
Views
-
Cite
Cite
Otto X. Cordero, Paulien Hogeweg, Feed-Forward Loop Circuits as a Side Effect of Genome Evolution, Molecular Biology and Evolution, Volume 23, Issue 10, October 2006, Pages 1931–1936, https://doi.org/10.1093/molbev/msl060
Close - Share Icon Share
Abstract
In this article, we establish a connection between the mechanics of genome evolution and the topology of gene regulation networks, focusing in particular on the evolution of the feed-forward loop (FFL) circuits. For this, we design a model of stochastic duplications, deletions, and mutations of binding sites and genes and compare our results with yeast network data. We show that the mechanics of genome evolution may provide a mechanism of FFL circuit generation. Our simulations result in overrepresentation of FFL circuits as well as in their clustering around few regulator pairs, in concordance with data from transcription networks. The mechanism here proposed and the analysis of the yeast data show that regulator duplication could have played an important role in FFL evolution.
Introduction
Gene regulatory networks can be decomposed into several layers starting from their genomic constituents (Babu et al. 2004; Dobrin et al. 2004). At the most basic level, we see a collection of transcription factors (TFs), target genes, and upstream binding sites (BS) in the DNA. At the next level, regulators and targets interact in the local circuitry. Circuits cluster into modules in which genes have similar expression patterns and are associated with common cell processes. Finally, modules are connected to build up the entire network. One of the most prominent features of the global structure of these networks is their scale-free architecture (see, Guelzim et al. 2002; Lee et al. 2002; Teichmann and Babu 2004 for analyses in Saccharomyces cerevisiae and Escherichia coli). In a scale-free network, the probability of a node having k connections follows a power law (N(k) ∼ k−γ), with most of the nodes having few connections and a few having many. Nodes in the tail of the power law distribution have an atypically high number of connections (degree) and can be regarded as hubs. These are regulatory proteins, binding to many target genes. The centralized organization imposed by regulatory hubs may be significant for cellular dynamics. For instance, relative to the cell cycle, condition-specific hubs may provide the capacity to facilitate shifts between different phases, whereas nontransient hubs possibly define an interface between cell cycle progression and housekeeping functions (Luscombe et al. 2004).
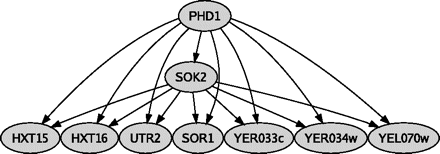
Milo et al. (2002) have shown that at the local circuitry level, some small subgraphs, called network motifs, are much more abundant than would be expected by chance. The most well-known example is the feed-forward loop (FFL) motif, which is thought to perform an important signaling role (Mangan and Alon 2003; Mangan et al. 2003) and whose overabundance has been attributed to incremental acquisition of adaptive single interactions (Conant and Wagner 2003; Babu et al. 2004). An example of FFL circuits in yeast is shown in figure 1.
FFL network motif. The small yeast subnetwork formed by TFs Phd1 and Sok2 serves as an example to illustrate the structure of FFL motifs. Phd1 is the master regulator, and Sok2 is the secondary regulator. Both connect to the same 7 genes, creating 7 FFL circuits.
The statistical significance of the FFL circuit abundance was calculated by comparing the number of FFLs in an observed network with the average number of FFLs in an ensemble of random networks (Milo et al. 2002, 2004). From this, a
In this article, we set up a model of “neutral” genome mutational dynamics to study its effects on the topology of the gene regulation network. Such mutational dynamics are defined by duplication, deletion, and mutation of genes and BS but without any selection mechanism. The general question is whether the abundance of FFL circuits can be explained as a “signature” of the evolutionary mechanics. Furthermore, we use data of the yeast transcription network (Lee et al. 2002) to establish differences and similarities with our model.
Modeling Mutational Dynamics
Van Noort et al. (2004) showed that the global structure of the yeast coexpression network can be explained by a discrete model based on genome growth by duplication and deletion of genes and TF BS. We extend this model by associating genes to proteins that may act as TF by recognizing BS. In this manner, we are able to establish directed connections on the basis of TF–BS matching. For simplicity, both proteins and BSs are defined in a linear discrete space, separated by a mutational distance. However, our result is not affected by the use of a more biologically relevant sequence space (e.g., hamming distances). The genome is evolved at the level of genes and BSs, and the network can be calculated from the genome content at any time step in the simulation.
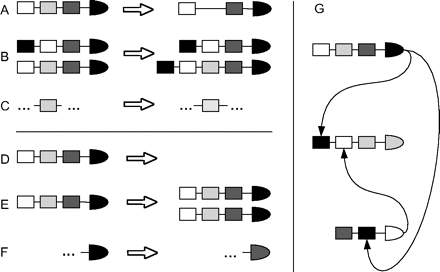
As in Van Noort et al. (2004), we initialize a genome G = {X1, X2, …, Xn}, where each gene Xi has a promoter region Ri = {bsi1, bsi2, …, bsim}, which is composed of randomly chosen sites that may or may not be functional (bound by a protein). A protein Pi is also associated to each gene. The genome is evolved according to the following events (fig. 2A–F): 1) gene duplication: a gene Xi is duplicated to Xj, together with its respective promoter Ri and protein Pi; 2) gene deletion: Xi is removed from G; 3) BS duplication: a gene Xi acquires a new BS bsjk copied from another gene Xj, so
Mutational operations and network calculation. (A) BS deletion. (B) BS duplication. (C) BS mutation and possible innovation. (D) Gene deletion. (E) Whole-gene duplication. (F) Protein divergence and possible innovation. (G) Generation of a network by (fuzzy) matching of proteins and promoter sites.
The network is calculated as follows. A protein becomes a TF (regulator) when it matches a BS of any other gene. Initially, the number of different regulators in the network is determined by the number of different BSs that are randomly distributed among the genes. Binding occurs when the protein falls within an interval of a few (here 2) mutations away from a BS. The transcriptional regulatory network can be calculated (fig. 2G) by establishing a connection from gene Xi to gene Xj if protein Pi matches any bs ∈ BSj, that is to say, if Pi is a TF binding to the promoter region of gene Xj. When a target gene becomes inactive through loss of its functional BSs, it is no longer considered in the network because its degree becomes zero. In turn, a target gene with nonfunctional sites can be reintegrated into the network by BS mutations. In our study, we have initialized simulations with 1,000–2,500 genes, 5–10% regulators, and 1–3 BSs per gene.
The choice of parameters is based on the following considerations. Based on the idea that single-gene duplication is an ongoing process and that most recent duplicates are lost in small mutations (Kellis et al. 2004), we assume equal gene duplication–deletion rates for our simulations (e.g., 1 duplication–deletion every 1 or 2 generations). BS duplication and deletion rates are also assumed to be in equilibrium, resulting in genomes with stable average size but constant changes in internal organization. It was shown (Van Noort et al. 2004) that higher BS duplication and deletion rates relative to those of genes were required to obtain better approximations of yeast coexpression data. Previous studies have shown the flexibility of upstream regions and highlighted their importance for fast adaptation (Stone and Wray 2001; Berg et al. 2004; Tanay et al. 2005) and divergence of duplicate gene pairs (Evangelisti and Wagner 2004; Maslov et al. 2004). Therefore, in a typical simulation run, BS duplication and deletion rates are from two- to eightfold higher than gene duplication and deletion rates. In turn, BS mutation rates are typically no more than twofold higher than gene duplication–deletion rates. This allows nonfunctional sites to become functional and vice versa but keeping duplications as the most dominant process in network evolution. On the other hand, considering the small proportion of regulators in our simulations, the rate of protein divergence is two- to fivefold higher than gene duplication and deletion rates, which compensates for losses of regulator families and allows to keep enough TF diversity within the genome. The resulting effective rate of innovation is, in average, 1 novel TF appearing every 10 time steps and a nonfunctional site turning into a functional BS every 5 time steps. Within the ranges we have mentioned, different parameter configurations were considered without affecting our results and conclusions.
Results
Global Network Structure
Given the small proportion of regulators, our networks start with a high average number of outgoing connections per TF, for example, a network with 2,000 genes and 100 regulators needs at least an average of 20 BS per regulator. Mutations increase the number of different BS types within the genome, but most of these new site types are nonfunctional, that is, with no protein bound, keeping the actual number of different TF almost unchanged.
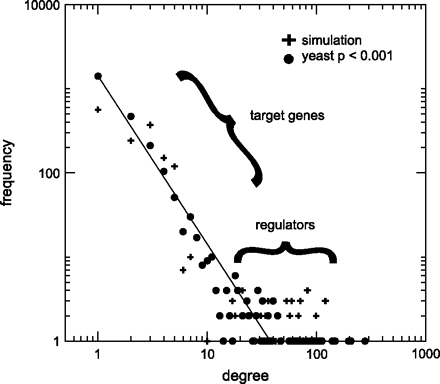
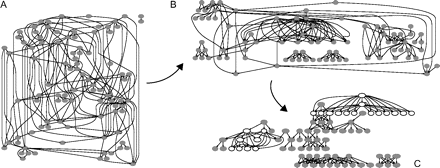
The initial setting produces a random graph. However, the mutational dynamics defined in our model transforms this network such that its distribution of connections follows a power law (see fig. 3). Intuitively, the consequence of duplication of target genes and BSs is that some regulators will gain more connections, elongating the tail of the degree distribution, whereas most of the genes keep a low (in-) degree. Figure 4 shows the transformation of a toy network with 100 genes as an effect of the mutational dynamics.
Power law distribution of connections in yeast and simulations. The graph shows the degree distribution for yeast (filled circle) and a simulation (pluses) with 2,500 genes and 150 regulators, that is, similar values as observed in the data.
The effects of mutational dynamics on network structure. A network with 100 genes at 0 (A), 1,000 (B), and 2,000 (C) steps is shown to illustrate the results of mutational dynamics on network architecture. In C, the genes involved in FFL circuits are depicted as empty circles.
The exact value of the exponents depends on the proportion of different TFs in the genome. With 2,500 genes and 5% TFs, the exponent that minimizes the sum of squares error is approximately −2. This coincides well with the yeast data (P < 0.001) (Lee et al. 2002), where the proportion of regulators is 4.3% and the exponent approximately −2. For the extreme cases with 1% and 50% TFs, the exponents are approximately −1.5 and −2.5, respectively. We run our simulations with a proportion of regulators between ∼5% and ∼10%, which keeps a scaling behavior consistent with the data. A more detailed study of the model's limiting distributions in the network and the effect of the number of regulators is left for further research.
Local Network Circuitry
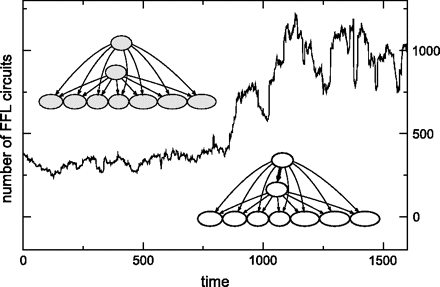
We find a high abundance of FFL circuits in our simulated networks. We observe that after a period of drift around a mean value, the network undergoes “FFL motif avalanches”: sudden increases in the number of FFL circuits (fig. 5).
Avalanche of FFL network motifs. An initial period of duplication–deletion creates highly connected duplicate regulators. An extraregulatory connection between them leads to as many FFL circuits as the amount of coregulated targets. The picture corresponds to a simulation run performed with default parameters (see text for information on this rates).
An analysis of our simulated genomes reveals that after an avalanche, most of the circuits (∼90%) are formed by a large target overlap between few interconnected regulatory hubs (e.g., regulators contributing with ≥5% of the total number of connections). The mechanism behind this phenomenon is as follows: before the avalanche of circuits, some regulators have undergone duplication and thus bind to an overlapping set of target genes (as shown in fig. 5). A new connection linking these 2 paralog regulators creates as many FFL circuits as the number of coregulated targets.
Local Circuitry in Yeast Network
We investigated whether such a mechanism of coregulation and cross talk between regulatory hubs is present in real regulatory networks and to what extent the FFL circuits can be explained in the same manner as in the model. For this, we looked specifically at the S. cerevisiae network (Lee et al. 2002) as derived from microarray experiments testing the binding affinity of 106 well-documented regulators. An error model of binding in the data allows the assignment of a P value to the interactions. Our analysis is based on P < 0.001.
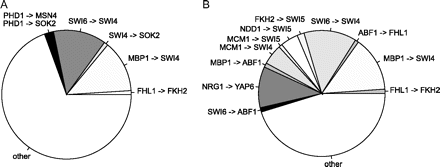
In accordance with our simulations, we find that a large number of FFL circuits can be associated with pairs of homolog regulators. Namely, more than 30% of the FFL circuits in yeast are formed by 5 pairs of regulators with significant homology at the protein level (fig. 6A). From these pairs, those that contribute to the most FFL circuits are the cell cycle regulators Swi6–Swi4 (forming the SCB binding factor complex [Kumar et al. 2000; Horak et al. 2002]) and Mbp1–Swi4, both with bidirectional PBlastE < 1×10⁻¹² on the S. cerevisiae database. In concordance with the definition of a FFL circuit presented in Milo et al. (2002), we do not include the homolog pair Cin5–Yap6, connected with a bidirectional regulatory interaction and generating 47 (symmetric) FFL circuits.
Hub–hub cross talk and target overlap in the yeast network. (A) Proportion of FFL motifs made by homolog pairs of regulators: more than 30% in total. Two pairs of regulators, Swi6–Swi4 and Mbp1–Swi6, are particularly prolific in the number of FFL circuits. (B) The pie chart shows the proportion of FFL motifs made by interactions between 2 regulatory hubs (out-degree > 80), in total 55% percent from the 334 motifs.
In general, most of the FFL circuits in the yeast network are linked to a list of 16 regulatory hubs. These regulators bind each to more than 80 targets and together they are involved in almost 50% of all the interactions in the network. In 55% percent of the FFL circuits, both master and secondary regulators are in this list of hubs (fig. 6B), and in 90% of the circuits, at least one regulator belongs to this list. We also find that many of these regulatory hubs are part of a serial circuit of 8 cell cycle transcriptional regulators (Swi4, Swi6, Fkh2, Ace2, Swi5, Mbp1, Mcm1, and Ndd1) that regulate almost 30% of yeast genes (Simon et al. 2001). In addition to this serial regulatory subnetwork allowing cell cycle progression, there is a large overlap between the targets of some of these regulators: 41% of 112 Mbp1 targets are also bound by Swi4, 28% of Ndd1 targets overlap with Swi4, and 27% of Ace2 by Ndd1. These levels of overlap are at least 10 standard deviations higher than the average value in an ensemble of 100 randomized networks with identical degree distributions. In short, duplicate regulatory hubs, target overlap, and hub cross talk are features of the FFL architecture that we find in both simulations and yeast data.
FFL Significance, Average In-Degree of Regulators and Evolution
In the yeast P < 0.001 network, the average in-degree of regulators is 0.915, whereas the average in-degree of the whole network is 1.79. This in-degree bimodality renders a low number of expected circuits (170 in comparison with the observed 334), leading to the conclusion that FFL circuits are overrepresented. However, a network with the same number of genes, FFL circuits, and out-degree per regulator, but without the in-degree bimodality, has no FFL circuit overrepresentation because the expected number of circuits increases to ∼300.
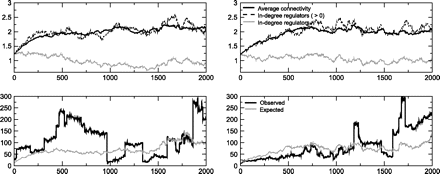
In our simulations, both the presence of circuits and in-degree bimodality evolve together, resulting in networks with FFL circuit overrepresentation. Figure 7 illustrates this. The bimodality here occurs in the same way as in yeast, that is to say, some regulators have zero in-degree (they are not regulated by any other TF) but do have connections to some targets.
In-degree bimodality and FFL circuit overrepresentation. Time plots for 2 different simulations. The upper panels show the behavior of the average in-degree of the whole network (black, dark upper line) and the average in-degree of regulators (gray, lower line). The dashed curve shows the in-degree of regulators averaged only over those with in-degree > 0, showing that in-degree bimodality is caused by some regulators with zero in-degree. The lower panels show the number of FFL circuits (black) and the expected number of circuits in a randomized ensemble with identical degree sequences (gray). Note that, although overrepresentation is not a stable feature, it occurs much more often than expected by chance (see text).
The process generating the FFL circuits, as described previously, may increase the average connectivity through the duplication of highly connected regulatory hubs. It is also an inherently unstable process in the sense that the circuits are clustered around a few regulatory hubs and depend on a single cross-hub connection. This means that after a certain level of network organization has been reached, many FFL circuits can be gained or lost easily by targeted addition or deletion of single connections, whereas for most random modifications the FFL significance remains unchanged, for example, 20% of the edges added or removed at random has no effect on the significance, the same holding for yeast and E. coli networks (Milo et al. 2002). In spite of the sensitivity to targeted modifications, when sampling 100 independent simulations at the same time step (e.g., 1,200 or 1,500 steps), we find FFL statistical significance in ∼30% of the cases, in contrast with the 5% expected for random networks. We can understand this better by looking back at figure 4, where we see that evolved networks such as that in figure 4C develop a hierarchical structure that is very different from a random network. Finally, note that many other selection pressures other than maintaining network motifs can conserve the hubs or the interconnections producing the FFL circuits.
Discussion and Conclusions
We show that a genome evolution model, based on duplications, deletions, and innovations of genes and BSs, provides possible explanations for the generation of FFL circuits and their overrepresentation. In our simulations, circuits are formed by interconnected hubs with overlapping sets of targets. This kind of topology is a general result of the mutational dynamics and does not depend on specific parameter values or simulation schemes.
Overrepresentation of FFL circuits occurs in many types of networks. Our model specifically applies to transcription regulation networks. The circuits generated in our simulations cluster around a few master and secondary regulator pairs with overlapping binding targets, as observed in transcription regulation networks of E. coli and yeast (Dobrin et al. 2004) but, interestingly, not in other networks with overrepresentation of FFL, for example, the Caenorhabditis elegans neural network (Kashtan et al. 2004).
The fact that FFL circuits appear in “avalanches” as a side effect of the mutational dynamics shows that selection on individual circuits (Conant and Wagner 2003; Babu et al. 2004) is not needed to explain their abundance. Previous tests of whole-motif duplication (Conant and Wagner 2003) or target-gene duplication (Babu et al. 2004) led to the conclusion that gene duplication was not responsible for the abundance of circuits. In contrast, our results suggest that gene duplication does play a major role but in relation to regulators, rather than to target genes or whole circuits. Indeed, in yeast, many FFL circuits are formed by a few pairs of highly connected homolog regulators.
Another new perspective on the structure of the transcription network is given by the dependence of the statistical overrepresentation of FFL circuits on the low average in-degree of regulators. We show in our simulations that the mechanics of evolution leads to the generation of FFL circuits as well as a bimodal in-degree distribution and an increase in connectivity. The combined effect is that FFL circuit overrepresentation often occurs. An important bottom line is that evolution is very different from a randomization test, where all but one property is fixed. Instead, evolution changes many properties simultaneously.
Yoko Satta, Associate Editor
We thank Anton Crombach, Max Heywood, and Nynke Kramer for helpful suggestions concerning this article. We like to thank Daniel van der Post for his thorough review and comments. We are also in debt with the reviewers, whose valuable comments helped to improve this article.
Funding for the research and the Open Access publication charges was provided by the Netherlands Organization for Scientific Research.
References
Artzy-Randrup Y, Fleishman SJ, BenTal N, Stone L.
Babu MM, Luscombe NM, Aravind L, Gerstein M, Teichmann SA.
Berg J, Willmann S, Lassig M.
Dobrin R, Beg QK, Barabasi AL, Oltvai ZN.
Evangelisti AM, Wagner A.
Guelzim N, Bottani S, Bourgine P, Kepes F.
Horak CE, Luscombe NM, Qian J, Bertone P, Piccirrillo S, Gerstein M, Snyder M.
Itzkovitz S, Milo R, Kashtan N, Ziv G, Alon U.
Kashtan N, Itzkovitz S, Milo R, Alon U.
Kellis M, Birren BW, Lander ES.
Kumar R, Reynolds DM, Shevchenko A, Goldstone SD, Dalton S.
Lee TI, Rinaldi NJ, Robert F, et al. (21 co-authors).
Luscombe NM, Babu MM, Yu H, Snyder M, Teichmann SA, Gerstein M.
Mangan S, Alon U.
Mangan S, Zaslaver A, Alon U.
Maslov S, Sneppen K, Eriksen KA, Yan KK.
Milo R, Shen-Orr S, Itzkovitz S, Kashtan N, Chklovskii D, Alon U.
Milo R, Itzkovtiz S, Kashtan N, Levitt R, Shen-Orr S, Ayzenshtat I, Sheffer M, Alon U.
Simon I, Barnett J, Hannett NA, et al. (11 co-authors).
Stone JR, Wray GA.
Tanay A, Regev A, Shamir R.


