


Abstract
Phylogenomic studies produce increasingly large phylogenetic forests of trees with patchy taxonomical sampling. Typically, prokaryotic data generate thousands of gene trees of all sizes that are difficult, if not impossible, to root. Their topologies do not match the genealogy of lineages, as they are influenced not only by duplication, losses, and vertical descent but also by lateral gene transfer (LGT) and recombination. Because this complexity in part reflects the diversity of evolutionary processes, the study of phylogenetic forests is thus a great opportunity to improve our understanding of prokaryotic evolution. Here, we show how the rich evolutionary content of such novel phylogenetic objects can be exploited through the development of new approaches designed specifically for extracting the multiple evolutionary signals present in the forest of life, that is, by slicing up trees into remarkable bits and pieces: clans, slices, and clips. We harvested a forest of 6,901 unrooted gene trees comprising up to 100 prokaryotic genomes (41 archaea and 59 bacteria) to search for evolutionary events that a species tree would not account for. We identified 1) trees and partitions of trees that reflected the lifestyle of organisms rather than their taxonomy, 2) candidate lifestyle-specific genetic modules, used by distinct unrelated organisms to adapt to the same environment, 3) gene families, nonrandomly distributed in the functional space, that were frequently exchanged between archaea and bacteria, sometimes without major changes in their sequences. Finally, 4) we reconstructed polarized networks of genetic partnerships between archaea and bacteria to describe some of the rules affecting LGT between these two Domains.
Introduction
Traditional biological explanations have largely relied on the (re)construction of a genealogical tree, which describes the branching pattern of lineages as they diverge and split from a last common ancestor. Such a genealogical hierarchy seemed particularly promising to make sense of evolution, by providing a largely dichotomous topology that structures biodiversity in the most informative way possible. The nested structure of genealogical groups within genealogical groups echoed well with the hierarchical structure of pre-Darwinian classifications (e.g., Doolittle and Bapteste 2007). Later, it encouraged many tree-based methodological developments that put some order in the diversity of life (McInerney et al. 2008). Thus, evolutionary studies and tree reconstruction became vastly intertwined. Because a branch of the genealogical tree grouped together all the descendants from a last common ancestor, genealogical (monophyletic) groups were simultaneously considered as 1) valid units of classification and 2) valid evolutionary units (Hennig 1966; Hull 1976). Consequently, genealogical groups also appeared as 3) valid explanatory units in evolutionary scenarios. The literature is filled with hypotheses about monophyletic groups that explain the past and present diversity by determining the genealogical relationships between lineages, species, etc. and by mapping the evolution of characters onto their genealogy (O’Hara 1997). For many lineages, this approach is perfectly sound.
However, the universal scope of such genealogical-based evolutionary explanations has recently been questioned seriously (Bapteste et al. 2009; Dagan and Martin 2009; Doolittle 2009a, 2009b; Ragan and Beiko 2009). A genealogical tree would no doubt be an ideal explanatory framework if the evolutionary processes and patterns were only tree-like for all life, but prokaryotic evolution does not seem only to obey such a simple pattern of divergence and split (Dagan and Martin 2006; Lawrence and Retchless 2009; Zhaxybayeva, Doolittle 2009; Retchless and Lawrence 2010). At many biological levels—from the genes to the communities—evolution also involves processes producing evolutionary units and evolutionary relationships that match neither the genealogical groups nor the genealogical relationships (Bapteste and Boucher 2008). Lateral gene transfer (LGT) and recombination, for instance, produced evolutionary modules with their own individual fates. Thus, (adaptive) genes and groups of genes are distributed across prokaryotes in ways that do not perfectly match the species genealogy. For instance, the suite of coevolving genes coding for gas vesicles in cyanobacteria and haloarchaea defines a functional unit as well as an evolutionary unit (Walsby 1994). This genetic module codes for a clear adaptive phenotype, conferring buoyancy to its host, and it can be inherited both by LGT and from ancestors to descendants.
LGT and recombination also produce phylogenetically mosaic entities among recombined genes (Lo et al. 2007) and recombined plasmid (Brilli et al. 2008) or in viral (Lima-Mendez et al. 2008) or prokaryotic (Zhaxybayeva, Doolittle et al. 2009) genomes harboring genes with multiple distinct phylogenetic affinities. Finally, the same processes are greatly involved in the evolution of microbial communities (Allen et al. 2007; Lo et al. 2007) as well as possibly in the evolution of interspecific consortia (Vogl et al. 2008; Wanner et al. 2008) and of “superorganisms” (Sonea and Mathieu 2001; O’Malley and Dupré 2009). Microbial communities are remarkable evolutionary units that associate distinct DNA donors and hosts (also referred to as “genetic partners” sensu Bapteste and Burian 2010) in a genetic network (e.g., Halary et al. 2010). These communities are often phylogenetically composite. Both mobile elements and cell lineages are key players in the evolution of these complex structures (Dinsdale et al. 2008) as illustrated in communities of cyanobacteria, cyanophages, and plasmids in the ocean (Lindell et al. 2004, 2007; Zeidner et al. 2005; Palenik et al. 2009), in natural communities, in acid mine drainage (Lo et al. 2007), or in gut microbiomes of various animals (Gill et al. 2006; Qu et al. 2008). These heterogeneous groups, evolving in an integrative fashion, are made of genetic partners that do not occupy a single branch in the Tree of Life. Yet, these groups are real units of selection and thus represent real units of evolution. Understanding the context in which various genetic partners thrive—here, the genetic network in which DNA flows—is crucial to understand the integrative aspect of microbial evolution. Typically, bacteria living in dynamic and genetically more diverse environments have larger pangenomes than obligate intracellular pathogens (Wilmes et al. 2009).
This more recent and more intricate vision of prokaryotic evolution presents both modular and integrated aspects and is characterized by the occurrence of other evolutionary units than the genealogical units and of other evolutionary relationships than the genealogical relationships (Bapteste and Burian 2010). As the history of these additional evolutionary units and relationships ought not all be coherent with one another nor to match a unique species tree, universal tree-based explanations alone cannot offer a full account of prokaryotic evolution. Precisely, because evolution is more than the divergence along a genealogy, evolutionary explanations must be more than genealogical explanations. Improving our evolutionary explanations beyond a Tree of Life thus appears as a major challenge for microbiology.
Enriched evolutionary explanations can be achieved by including more evolutionary objects (e.g., mobile elements, metagenomes, and pangenomes), more evolutionary units (e.g., modules and communities), and more evolutionary relationships (e.g., functional integration and ecological interactions) in our analyses and scenarios. To this end, a new phylogenomic perspective must be explored. In particular, original methods must be devised to analyze forests of unrooted gene trees (Koonin et al. 2009; Puigbò et al. 2009; Lapointe et al. 2010). Phylogenomic studies produce such unrooted trees, which often cannot be polarized in time, because the vast majority of prokaryotic and mobile elements sequenced within the context of genomic and metagenomic projects have probably undergone some LGT and recombination. On these gene trees, some internal nodes represent speciation (orthology) and duplication events (paralogy), whereas some other nodes represent the multilateral union of different lineages by LGT or by recombination (xenology). Being “related” in rooted and unrooted trees thus has a distinct meaning (Wilkinson et al. 2007). This realization entails that, if dedicated phylogenetic concepts and tools are developed to handle unrooted gene trees, evolutionists should gain additional information on the variety of relationships and processes affecting the different evolutionary units encountered in such unrooted trees.
Here, we present a novel analytical approach to harvest phylogenetic forests, looking for a greater number of meaningful evolutionary patterns, not only the genealogical groups or genealogical relationships. We implemented some functions that search for clans (sensu Wilkinson et al. 2007), slices, and clips (sensu Lapointe et al. 2010) in unrooted trees to detect partitions of operational taxonomic units (OTUs) showing either functional, environmental, or phylogenetic coherence and evidence of (frequent or rare) LGT between genetic partners. We applied this method to 6,901 gene trees comprising up to 100 prokaryotic genomes (41 archaea and 59 bacteria) and demonstrated that, when truncated into bits and pieces, this forest of unrooted trees offers evolutionary information, which would have been overlooked in a traditional analytical framework. In particular, we identified 1) partitions in the trees that reflected the lifestyle of organisms rather than their genealogy, 2) candidate lifestyle-specific (i.e., adaptive) gene modules, 3) genes that were frequently exchanged over large taxonomic distances. Finally, 4) we proposed a refined description of the network of genetic partnerships among prokaryotes.
Materials and Methods
The data set of 6,901 gene trees, already assigned to functional categories, was kindly provided by Puigbò et al. (2009). Lifestyles and phenotypes were manually recovered from the organismal information in the National Center for Biotechnology Information (NCBI) (http://www.ncbi.nlm.nih.gov/) and the GOLD databases (http://www.genomesonline.org/). Several strategies of tree partitions were implemented in (R Development Core Team 2010) to harvest this phylogenetic forest. The corresponding functions are freely available as part of the Phangorn package (Schliep 2010) available at http://CRAN.R-project.org/package=phangorn.
Partitioning Clans
For every nontrivial split in an unrooted tree, there are two complementary clans (Wilkinson et al. 2007). These clans are identified by the number of distinguishable splits of a tree, that is, the number of internal branches. On the other hand, a trivial split (between just one of the OTUs and all the others) only defines one clan, and these clans are identified by the terminal branches of a tree (singletons). For a binary tree with n leaves, there are 2n − 3 branches, including n − 3 internal branches and n terminal branches. Consequently, there exist 2(n − 3) + n = 3n − 6 clans in unrooted binary trees. The R function getClans returns all nontrivial clans in addition to singletons.
Partitioning Slices
Whereas clans are identified by single splits or bipartitions of an unrooted tree, slices are defined by pairs of splits or tripartitions. In other words, a slice can be obtained by the intersection of two clans. Yet, enumerating the slices of an unrooted tree is not as simple as it seems. Not all tripartitions define slices because the intersection of two clans is sometimes a clan and sometimes a slice (Lapointe et al. 2010). The number of distinguishable slices of an unrooted is thus given by the number of possible tripartitions minus those that are clans. For a binary tree with n leaves, this number is 2n2 − 10n + 12. The R function getSlices returns all slices, excluding those that are also clans.
Partitioning Clips
A clip is a different type of partition, defining groups of OTUs that are related in terms of evolutionary distances and not only topology. Namely, clips are groups of OTUs for which all pairwise path-length distances are smaller than a given threshold value (Lapointe et al. 2010). There exists different numbers of clips for different thresholds, the largest (and trivial) one being the whole tree. In our analyses, we used the R function getClips, which only returns the largest non trivial clip.
Defining Coherent Tree Partitions
In order to define maximally coherent partitions (i.e., clans, slices, and clips) for a given categorical criterion (e.g., taxonomy and environment), OTUs were labeled either as “natives” or “intruders.” A complete partition is one that includes all native OTUs of a given categorical state (e.g., all archaea), whereas an incomplete partition is one that does not include all natives. Namely, a complete partition for a particular state (e.g., archaea) can also include some intruders of another state (e.g., bacteria). Thus, we distinguished homogeneous partition that includes only natives (respectively intruders) from heterogeneous partition that includes both natives and intruders. We defined a perfect partition as one that is both complete and homogeneous for a given category (e.g., clan/slices/clips with all archaea, and only archaea). When the categorical state of some OTUs is “unknown,” they are considered as polymorphic and they can be native or intruder, depending on the context, but so as to maximize the coherence of the partitioning scheme.
Coherent partitions with evolutionary significance were obtained using two approaches, using the R function getDiversity. First, we computed optimal cuts (i.e., bipartitions or tripartitions) that isolate natives from intruders in a tree. It is easy to demonstrate that the parsimony score (p-score) of a tree indicates whether OTUs can be perfectly separated by a single split (p-score = 1, perfect clan) or by a pair of splits (p-score = 2, perfect slice). Higher parsimony scores indicate that the natives and intruders are mixed in the tree such that additional cuts would be required to isolate them from one another. Clips are not explained by the parsimony score because they are based on a different criterion than topology.

Maximum equitability (E = 1) thus corresponds to trees in which the n native OTUs of a given category are in n separate partitions. These diversity indices are not only computed on the whole tree but also apply to partitions defined by clans, slices, and clips. When restricted to these tree partitions, these indices are called intruders–diversity (H*) and intruders–equitability (E*). A null value of E* indicates that all intruders of a given category are falling in a perfect clan (slice and clip) within the smallest complete clan (slice and clip) of natives. As such, these values can be used to quantify the distribution of intruders within partitions of natives, the larger the E* values, the more widespread the intruders (Lapointe et al. 2010).
Functional Analyses
Each tree was assigned to a functional category (COG: Tatusov et al. 1997 or NOG: Muller et al. 2010) according to Puigbò et al. (2009). In order to assess whether some functional categories were significantly enriched for specific sets of genes, the trees of interest were distributed in 20 categories, and the 17 functional categories with more than 70 representatives were retained for further analysis. We computed the hypergeometric test using the R package GOstats (Falcon and Gentleman 2007) to determine whether gene trees with frequent transfers were over- or underrepresented in a functional category with respect to gene trees exclusively with archaea or with bacteria. The P values were adjusted for multiple testing using a Bonferroni correction (Shaffer 1995).
Lifestyle Distances
Lifestyles and phenotypes were manually recovered from the organismal information in NCBI (http://www.ncbi.nlm.nih.gov/) and the GOLD databases (http://www.genomesonline.org/). The eight most frequently documented lifestyle categories corresponding to the 100 taxa under study were retained in our analyses (supplementary material S1, Supplementary Material online). For each category, each OTU was either known to present this lifestyle (1), to be incompatible with this lifestyle (0), or no information was available regarding whether the OTU presented this particular lifestyle (?). For a given category, each OTU thus admitted only one out of three possible character states. Because lifestyle categories were treated independently, when OTUs had multiple lifestyles, they were both reported as 1 if they were known to thrive in both these environments (e.g., some taxa were both aquatic and from soil). For all pairs of OTUs, we computed their average lifestyle distance, defined using a Manhattan distance computed from eight covariables. Organisms with identical lifestyle had a null lifestyle distance, whereas organisms with the most dissimilar lifestyles had a maximum lifestyle distance of eight (the matrix of lifestyle distances is available from ftp://134.157.183.104/ftp_root/Schliep/).
Use of OTU Categories
Categorization in lifestyle and taxonomy classes was essential for the present analysis. Based on these categories, we can describe 1) types of OTUs and 2) how these different types are grouped—or dispersed—in each tree. Consider for instance the category “thermophile”, which defines OTUs that are of the type thermophile. Our diversity indices indicate whether the thermophile OTUs are grouped (in trees, clans, or slices) or whether nonthermophile and thermophile OTUs are mixed in a tree. Therefore, the first use of categories is to sort the trees of the forest, distinguishing those that mix OTUs of a given type (increasingly so, as the equitability value for that category tends toward 1) form those that group OTUs of that category (in clans, slices, etc.). The second use of these categories is to help defining modules, that is, groups of genes that may have been inherited together through a comparison of the grouping/dispersion of taxonomical versus lifestyle categories in the trees. Based on 16 categories, we computed 16 equitability values (E) to describe how, at the tree level, the 16 types of OTUs are grouped or dispersed. We then searched for trees with similar phylogenetic profiles with respect to these 16 categories, that is, similar equitability values of grouping/dispersion for OTUs of the same type. Moreover, the categories were used to make sense of the groups of trees with similar phylogenetic profiles. Typically, trees grouping OTUs with a given lifestyle, even when they are not taxonomically related, suggest that these genes were transferred between OTUs sharing this lifestyle. For example, two gene trees with the same phylogenetic profile, grouping thermophiles but mixing archaea and bacteria, are good candidate genes that may have been transferred to adapt to a thermophilic lifestyle.
Module Identification
We derived covariables from the equitability values (E) of 16 different categories (eight environmental and eight taxonomical; see supplementary material S1, Supplementary Material online) to describe the evolutionary profile of each tree. The covariables were coded as follows: A score of zero (0) was given when the OTUs belonging to the category were present and perfectly grouped in the tree (E = 0); a score of one (1) was given when OTUs belonging to the category were messy in the tree (E > 0); a score of two (2) was given when no OTUs belonging to the category were present in the tree. The 6,901 profiles are thus not just based on the presence and absence of putative orthologs in the data set, but on the way, these putative orthologs group in the trees. These profiles were sorted out using hierarchical clustering (UPGMA; Sneath and Sokal 1973). Groups of genes presenting the same profile were further classified in three types of modules:
(i) adaptive lifestyle modules: at least one coherent environmental partition but no coherent taxonomical partition,
(ii) lineage-specific lifestyle modules: at least one coherent taxonomical partition matching or including at least one coherent environmental partition, and
(iii) ancient adaptive modules: at least one coherent environmental partition including two unrelated coherent taxonomical partitions (e.g., a perfect group of Cyanobacteria and a perfect group of archaea making up a perfect group of aquatic organisms).
The species composition of these candidate modules was checked to only retain sets of at least two genes with identical evolutionary profiles present in the same species.
Genetic Partnerships
We described the distribution of all possible pairs of archaea and bacteria in gene trees using a frequency histogram. Box plots were also used to investigate the distribution of all pairs of archaea and bacteria co-occurring in trees with a single intruder, as a function of their lifestyle distances. For each distance, values for the first to the third quantile (including 50% of the distribution), for the median, and for the 95% quantile (whiskers) were computed with (R Development Core Team 2010). We tested whether prokaryotes thriving in most similar environments (lifestyle distance < 3) exchanged more genes over long distances than those with most dissimilar lifestyles (lifestyle distance > 4) using the Wilcoxon rank-sum test (Lehmann 1975). Then, we also assessed whether genetic partnerships are dependent on genome size. To do so, regression models were computed with (R Development Core Team 2010) to test the hypothesis that the pairs of archaea and bacteria co-occurring in trees with a single intruder were equally likely, regardless of the genome sizes of the genetic partners.
Network Reconstruction
We quantified the co-occurrence of each pair of archaea and bacteria in trees with a single intruder (transferred only once over long taxonomic distances). Each pair of archaea–bacteria was attributed a “lifestyle distance” as described above. We used Cytoscape 2.6.1 (Killcoyne et al. 2009) to display the main genetic partnerships between archaea and bacteria. These networks were polarized, based on the gene tree topology, by arrows pointing from donor to host lineages.
Results and Discussion
Harvesting the Evolutionary Signal in Trees
When considered as a whole, many prokaryotic gene trees make little taxonomical or environmental sense (i.e., diversity values such as p-scores or equitability values for these categories are high). Trees with such scrambled relationships may be difficult to root and to interpret (Wilkinson et al. 2007; Lapointe et al. 2010; Perry and Beiko 2010). However, the same trees can also be analyzed with more accuracy, as the focus changes to a local search for partitions with evolutionary significance. Accordingly, we analyzed the prokaryotic forest by cutting each of the 6,901 trees into clans, slices, and clips (Lapointe et al. 2010), and we evaluated the coherence of these different types of partitions by computing parsimony scores and equitability values for nine environmental and eight taxonomical criteria. This approach detected multiple “coherent” patterns in the forest (fig. 1). For instance, mesophilic organisms and aerobes were either found exclusively, quasi-exclusively, in perfect clans or in perfect slices, in up to 63% and 59% of the trees, respectively (i.e., OTUs of these categories were never mixed, see table 1). However, some other environmental categories, such as hosts and soil organisms, are mostly occurring in trees with “mixed” patterns (i.e., trees in which the natives and intruders are scrambled). Such differences are not unexpected because LGT ought not to affect all lifestyles to the same degree.
Summary of the Environmental and Phenotypic Patterns Detected in the Phylogenetic Forest of 6,901 Prokaryotic Gene Trees.a
| Environmental/Phenotypic Patternsb | Anae. | Aer. | Hyper. | Ther. | Mes. | Host | Soil | Aqua | GC |
| Pattern A (trees with natives only) | 511 | 1,467 | 259 | 1,047 | 1,429 | 22 | 49 | 517 | 419 |
| Pattern B (trees with natives + one single intruder) | 255 | 1,012 | 329 | 849 | 722 | 117 | 273 | 1,088 | 759 |
| Pattern C (trees with perfect clans) | 346 | 367 | 212 | 152 | 164 | 281 | 613 | 326 | 580 |
| Pattern D (trees with perfect slices of natives) | 374 | 740 | 278 | 408 | 321 | 390 | 749 | 1,046 | 845 |
| Pattern E (trees with mélange of natives and intruders) | 2,541 | 2,489 | 1,562 | 1,844 | 1,565 | 2,801 | 3,676 | 3,541 | 3,268 |
| Number of independent patterns (A + B + C + D + E) | 4,027 | 6,075 | 2,640 | 4,300 | 4,201 | 3,611 | 5,360 | 6,518 | 5,871 |
| Number of coherent patterns (A + B + C + D) | 1,486 | 3,586 | 1,078 | 2,456 | 2,636 | 810 | 1,684 | 2,977 | 2,603 |
| Percentage of coherent patterns | 37% | 59% | 41% | 57% | 63% | 22% | 31% | 46% | 44% |
The trees tagged for the corresponding environmental (and taxonomical) pattens are availale from ftp://134.157.183.104/ftp_root/Schliep/.
Anae: anaerobes; Aer: aerobes; Hyper: hyperthermophiles; Ther: thermophiles; Mes: mesophiles; Aqua: aquatic; GC: GC content average GC content.
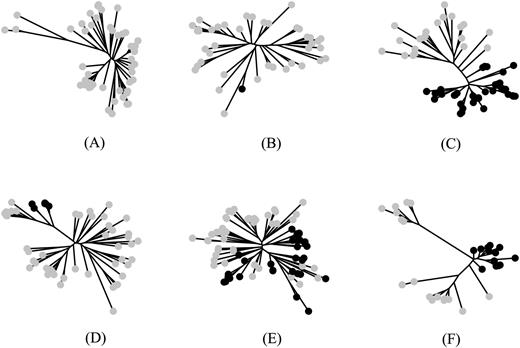
Different types of patterns detected in a phylogenetic forest of 6,901 prokaryotic gene trees. Pattern A: Gene trees including exclusively native OTUs of a single categorical state. Pattern B: Gene trees including quasi-exclusively native OTUs of one categorical state and a single intruder OTU of the other state. Pattern C: Gene trees with perfect clans, neatly separating the natives and intruders (these trees have a p score of 1). Pattern D: Gene trees with a perfect slice, neatly separating natives and intruders (these trees have a p-score of 2). Pattern E: Gene trees mixing the natives and intruders so that no partition can result in perfect clans or perfect slices (the messier the mélange, the higher the p-score). Pattern F: Gene trees for which the largest clip is joining intruder OTUs whose sequences are more conserved and similar than they are to native OTUs in the tree. For all of these patterns, OTUs that could not be assigned to a category were treated as “unknown,” and their categorical state was inferred to be either “native” or “intruder” in order to minimize the p-score of the tree, clan and slice, respectively. Patterns B, D, and E can be explained in terms of taxonomy by invoking at least one LGT. OTUs in gray depict natives, whereas OTUs in black depict intruders.
Interestingly, several hundred gene trees exclusively contained OTUs with a given phenotype and/or thriving in a given environment (fig. 1A). It is tempting to consider such gene trees—mostly environmentally coherent—as comprising adaptive genes required by microbes to occupy a specific environment or to fulfill a particular ecological function (table 1). Importantly, the functional distribution of these environmental/phenotypic genes (except the mesophiles) differs from the functional distribution characterizing the entire prokaryotic forest (supplementary material S2, Supplementary Material online). Known gene ontologies are typically underrepresented in these environmental/phenotypic genes. In other words, the functions of most of the genes that likely allow a microbe to occupy a specific niche are often ignored. Thus, fundamental knowledge of gene functions can not only come from a general comparison of an ever greater number of complete genomes sampled from multiple distant sites, cultured in lab conditions. This classic approach certainly provides an understanding on the core functions of life (e.g., identifying the broadly distributed functions found in various organisms). Yet, it does not teach us about the evolution of functional genes required for specific adaptations in nature, especially those transferred in situ. A sampling focusing on a given environment/phenotype could, however, help better characterizing functional signatures (Dinsdale et al. 2008; Cordero and Hogeweg 2009; Vey and Moreno-Hagelsieb 2010; Wu and Moore 2010) (e.g., by identifying the set of genes that any microbe must have to thrive in one environment and their functions).
Thirty-seven percent of the forest showed partitions more coherent with the taxonomical structure than to the environmental structure (an estimate consistent with Puigbò et al. 2010). Remarkably, this taxonomical signal decreased when gene trees were cuts into bits and pieces (supplementary material S3, Supplementary Material online), which suggests that, at a smaller scale, genealogy matters less. Overall (at the scale of entire trees), and as well as in the details of tree partitions (i.e., in clans and slices), both environmental groupings and taxonomical groupings were equally frequent. Most of the time (59% of the gene trees), lifestyle and taxonomy structured the forest similarly, but 98% of their taxonomical and lifestyle groupings were then different (e.g., for each of these trees, taxonomy was clearly not recapitulating/consistent with lifestyle; supplementary material S3, Supplementary Material online). Finally, we also detected hundreds of gene trees that better reflected the lifestyles of prokaryotes than they retrace their deep phylogenetic origins (e.g., 597 gene families out of 3,185 [19%] trees with hyperthermophiles better discriminate the hyperthermophiles from the nonhyperthermophiles than they separate the two prokaryotic Domains; likewise, 425 gene families out of 4,741 [9%] trees with thermophiles had nicely grouped thermophiles; supplementary material S3, Supplementary Material online). The percentage of such groups of taxa with significant environmental consistency remained very similar for different types of partitions (i.e., entire trees, clans, and slices; supplementary material S3, Supplementary Material online). The potential of our method to pinpoint such candidate adaptive genes (Legault et al. 2006) is of obvious interest for microbial ecology studies as suggested in former studies (Kirzhner et al. 2007; Zhaxybayeva, Swithers, et al. 2009; Coleman and Chisholm 2010; Perry and Beiko 2010). Remarkably, some lineages such as Proteobacteria and Euryarcheota were more impacted by lifestyle than were, for instance, Crenarcheota and Firmicutes. All these results constitute a further testimony of the great plasticity and dynamic of prokaryotic genomes over time (see also Boucher et al. 2003; Rocap et al. 2003; Dagan et al. 2008; Cordero and Hogeweg 2009; Doolittle 2009b; Ragan and Beiko 2009; Halary et al. 2010).
Long Distance LGTs
Genealogy unquestionably shaped a lot of the prokaryotic forest (table 2; Puigbò et al. 2010). However, the identification of long distance LGTs (i.e., gene transfers between distantly related taxa, such as bacteria and archaea; Nelson et al. 1999; Deppenmeier et al. 2002; Mongodin et al. 2005) also provided additional knowledge about the processes effecting prokaryotic evolution. In the forest, three distinctive patterns suggested such long distance LGTs (bolded lines in table 2). First, when a gene tree comprises a diversity of archaea along with a single species of bacteria (or the mirror case), it is quite likely that the intruder acquired its gene from the natives in the other prokaryotic Domain (fig. 1B). This situation concerned 735 trees in the forest. Second, when archaea (or bacteria) are located on a perfect slice, the most parsimonious explanation to reconcile this topology with a tree onto which both prokaryotic Domains are perfectly separated is to invoke one long distance transfer from one native lineage in the slice toward an intruder lineage in one of the two clans bordering the slice (fig. 1D). This pattern was observed in 613 trees. Third, when archaea and bacteria are mixed up in the tree (mélange), multiple long distance LGTs are likely (fig. 1E). They can be rare or frequent as indicated by equitability values (or p-scores). A total of 1147 trees offered such a messy structure. Overall, the number of gene families potentially transferred at least once between archaea and bacteria (36% of the trees), two Domains supposedly genetically isolated for a considerable time period, confirmed that gene acquisition is a major evolutionary force in prokaryotes, one that often bypasses deep taxonomical barriers (Cordero and Hogeweg 2009; Norman et al. 2009; Ragan and Beiko 2009). This conclusion holds at various taxonomical scales. On average, 35% of gene families for the taxonomical categories investigated here had a more complex evolutionary history than predicted by vertical descent only. Proteobacteria were particularly affected by LGT, as 26% of their gene families were repeatedly mixed with that of species belonging to other taxa. Importantly, these proportions of candidate LGTs are not caused by a lack of resolution in the gene trees; these estimates are robust even when a minimal statistical support (bootstrap values > 50%) is used to take slices and clans into account (see supplementary material S3, Supplementary Material online).
Summary of the Genealogical Patterns Detected in the Phylogenetic Forest of 6,901 Prokaryotic Gene Trees.
 |
|
Summary of the Genealogical Patterns Detected in the Phylogenetic Forest of 6,901 Prokaryotic Gene Trees.
|
|
Most interestingly, the genes that were most frequently transferred between Domains over long taxonomical distances belonged to different functional categories than genes that perfectly separated bacteria and archaea (fig. 2). Genes for signal transduction mechanisms, for posttranslational modification, protein turnover, chaperones, for energy production and conversion, for carbohydrate transport and metabolism, for amino acid transport and metabolism, for nucleotide transport and metabolism, for coenzyme transport and metabolism, for inorganic ion transport and metabolism, as well as for replication, recombination, and repair were overrepresented in the genes most frequently transferred over long distance. This observation suggested that some selection likely affects long distance LGT (Nakamura et al. 2004; Puigbò et al. 2010) either by favoring such transfers or by preventing genes belonging to other functional categories from being transferred. Furthermore, our analyses indicated that up to 32% of these long distance transfers fall in the largest clip of their corresponding gene tree. Not only were those genes exchanged over long taxonomical distances, but the transfer did not seem to affect their overall divergence. Indeed, the sequences of natives and intruders mixed up in these clips exhibit a greater conservation than sequences in other parts of the tree, and this suggests that such genes are likely adaptive and functional as is. A pool of these so-called “instantly usable” genes (iu-genes) seems to play an important role in prokaryotic evolution. In particular, the analysis of the 184 trees with only one intruder (and thus one certain long distance transfer) suggests that iu-genes that were successfully transferred between the two prokaryotic Domains pertain to various functional categories (e.g., carbohydrate transport and metabolism). Yet, the vast majority of these iu-genes are of unknown function (supplementary material S4, Supplementary Material online).
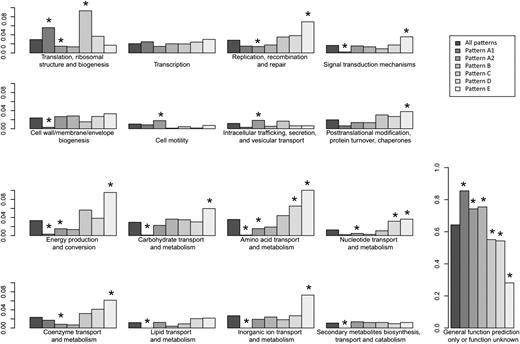
Distribution of the 6,901 prokaryotic gene trees in 17 functional categories based on different tree patterns (see box). Each plot indicates, for a given functional category, the percentage of gene trees associated with this function. Hypergeometric tests indicate (*) when gene trees with frequent transfers are over- or underrepresented in a functional category with respect to gene trees exclusively with archaea or with bacteria. All patterns: the entire forest of 6,901 gene trees; pattern A1: the 927 gene trees including exclusively archaea; pattern A2: the 2,841 gene trees including exclusively bacteria; pattern B: The 735 gene trees including quasi-exclusively archaea and one single bacteria or quasi-exclusively bacteria and one single archaea; pattern C: the 637 gene trees with perfect clans, neatly separating the archaea from the bacteria; pattern D: the 613 gene trees with a perfect slice, neatly separating the archaea from the bacteria; pattern E: the 1,147 gene trees mixing the archaea and bacteria so that no partition can result in perfect clans or perfect slices.
Some Modules and Partners
We derived 16 covariables from the equitability values (E) to describe each of the 6,901 gene trees by an evolutionary profile, and the corresponding vectors were then sorted using hierarchical clustering (see Materials and Methods). Clusters with at least two gene families, shared in a conserved set of species and presenting identical evolutionary profiles on a heatmap (supplementary material S5, Supplementary Material online), were further organized in three categories to identify and predict some remarkable candidate genetic modules (supplementary material S6, Supplementary Material online). First, we determined potential “adaptive lifestyle modules” as suites of genes used by the same set of unrelated organisms to adapt to the same environment (Ochman et al. 2000; Lindell et al. 2004; Perry and Beiko 2010). Namely, we identified two genes (COG1020 and COG3321) shared by mesophiles, involved in secondary metabolites biosynthesis, transport and catabolism, and which belong to the same DtxR-regulated operon (Yellaboina et al. 2004); three genes (COG3352, COG3353, and COG3354), shared by thermophiles, characterized as functional modules of the archeal flagellum (Huynen et al. 2003); three genes (COG3444, COG3715, and COG3716) present in anaerobes, composing the mannose/fructose/N-acetylgalactosamine-specific II component (Santana and Crasnier-Mednansky 2006); and two accessory genes (COG0829 and COG2371) of the urease gene operon shared by aerobes (Kakinuma et al. 2007). Second, we recognized potential “lineage-specific lifestyle modules” as clusters of gene trees grouping OTUs from a given lineage with a particular lifestyle. A set of Proteobacteria shared five genes (COG4669, COG4790, COG4791, COG4789, and COG4794) that compose a type III secretory pathway (Esc) (Merkl 2006). Likewise, a group of Euryarchaeota shared two genes (COG1229 and COG2037) coding for the alpha- and delta-subunits of the formyltransferase/hydrolase complex (Kane et al. 2007). Third, we diagnosed “ancient adaptive modules”, particularly well conserved in at least one lineage and some other distantly related taxonomic groups. We identified a module likely useful for adaptation to aerobic lifestyle, shared by aerobe Cyanobacteria and Proteobacteria (COG4597 and COG4735). These findings are very exciting because they recognized additional evolutionary units in the prokaryotic forest. As such, our approach is not just based on the presence and absence of putative orthologs in the data set (see Gaasterland and Ragan 1998; Pellegrini et al. 1999) but on the way putative orthologs group in the trees. Although some candidate genetic modules confirmed formerly known associations of genes, other suggested novel genetic associations, whose functions are still unknown, but clearly associated with a particular lifestyle (supplementary material S6, Supplementary Material online).
The classification of gene trees based on the distribution of archaea and bacteria also provided some information regarding genetic partnerships between distantly related taxa. Trees including a single intruder (archaea or bacteria) not only identified gene families exclusively transferred once but also suggested a polarization of these transfers. Within such trees, the intruder (i.e., the host lineage) had most likely acquired its gene copy from a taxa belonging to the other Domain (i.e., the donor). Yet, not all pairwise occurrences of archaea and bacteria appear in these trees. Many combinations (2,057 out of the 2,419 possible pairs) were never or rarely (≤5 times) observed (fig. 3A), which suggests privileged genetic connections between host and donor species. We tested whether similarities in lifestyles could explain these results by associating a “lifestyle distance” to each pair of archaea and bacteria co-occurring in these trees. Gene families that were only transferred once between Domains were significantly less numerous for taxa with dissimilar lifestyles (fig. 3B). By contrast, pairs of prokaryotes with similar lifestyles were more likely to co-occur in gene trees with a single gene transfer event (fig. 3B); that is, that pairs with lifestyle distance <3 exchanged significantly more genes over long distances than pairs with lifestyle distance >4 (P < 1.0 × 10⁻⁸; Wilcoxon rank-sum test). This result is notably consistent with previous studies (Hooper et al. 2009; Halary et al. 2010; McDaniel et al. 2010).
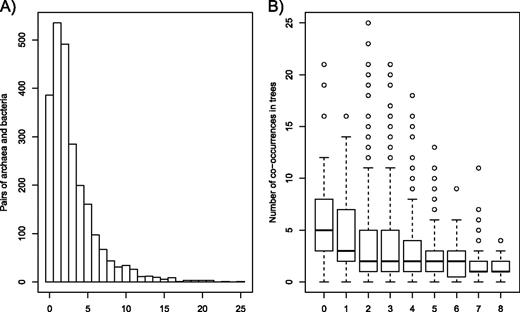
Co-occurrences of pairs of archaea and bacteria in gene trees including quasi-exclusively natives a single intruder (pattern B; see fig. 1). (A) Frequency histogram presenting the distribution of all possible pairs of archaea and bacteria in gene trees with pattern B. (B) Boxplot presenting the distribution of all pairs of archaea and bacteria co-occurring in gene trees with pattern B, as a function of their lifestyle distances (ranging from 0 to 8). For each distance, the length of the box spans from the first to the third quantile (including 50% of the distribution), and the thick line within the box represents the median of the distribution. The whiskers represent a range (95% quantile), and the outliers, corresponding to the most frequent pairs of archaea and bacteria, are represented by open circles.
The classification of trees based on coherent partitions is enough to reconstruct partnership networks. Trees representing pattern B (i.e., the gene trees including quasi-exclusively natives and a single intruder OTU; fig. 1B) were used here because they allow to polarize LGT. The most parsimonious explanation of this pattern is that the intruder OTU received a gene from one OTU of the native type (or one of their ancestors). In these trees, the intruder is the host, and the natives are potential donors. We further focused on the pairs of bacteria and archaea OTUs that were most frequently found in these gene trees to unravel the preferential partnerships between donors and hosts. These polarized networks of genetic partnerships showed that repeated (or massive) unique LGT between archaea and bacteria are not random. We distinguished cases in which archaeal lineages were gene donors (fig. 4A) from that in which archaeal lineages were gene hosts (fig. 4B), suggesting that “highways” of long distance LGTs are largely unilateral. Partners are either the host or the donor for a given partnership, but rarely both at the same time. For instance, figure 4A shows Moorella thermoacetica, a bacteria growing sustainedly on methanol only in coculture with a hydrogen-consuming methanogen, hosted genes from methagenic archaea, possibly as a result of their metabolic coupling (Jiang et al. 2009). Likewise, figure 4A shows that Aquifex aeolicus VF5 frequently hosted genes from the Sulfolobales lineage or that Thermotoga maritima MSB8 frequently hosted genes from Thermoproteales and Thermococcales. The opposite, however, was not true (fig. 4B). Only four partnerships were symmetrical, with both lineages playing the roles of donor and host: Haloarcula marismortui ATCC 43049 and Chloroflexus aurantiacus J-10-fl; Haloarcula marismortuiATCC 43049 and Pseudomonas aeruginosa PAO1; Haloquadratum walsbyi and Chloroflexus aurantiacus J-10-fl; Methanosarcina barkeri fusaro and Myxococcus xanthus DK 1622. Moreover, even though these main partnerships involved species with rather similar ecologies (average lifestyle distance of 2.3), 92% of the highways on these two polarized networks were unique.
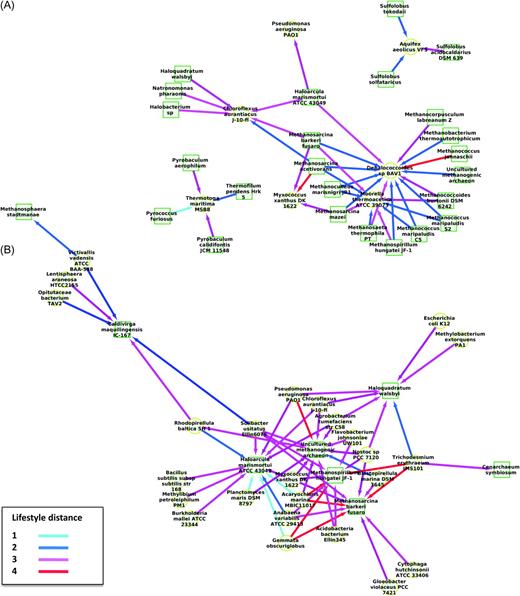
Polarized networks of genetic partnerships between archaea and bacteria in gene trees including quasi-exclusively natives (donors) and a single intruder (host) (see pattern B; fig. 1). (A) Network computed from gene trees including quasi-exclusively archaea and a single bacterial OTU as intruder. (B) Network computed from gene trees including quasi-exclusively bacteria and a single archaeal OTU as intruder. The archaea are represented by green squares, whereas the bacteria are represented by yellow circles. Edges are colored based on the lifestyle distance between the pairs of partners. The networks are polarized by arrows pointing from donors to hosts. The taxon names reported for each node are taken from Puigbò et al. (2009).
We have also assessed whether polarized networks are dependent on genome size. To do so, regression models were computed to test the hypothesis that the pairs of archaea and bacteria co-occurring in trees with a single intruder were equally likely to be connected in our polarized networks, regardless of genome size. This analysis revealed that for the network in which the bacteria are the hosts (intruders), genome size does not affect significantly the frequencies of LGT: Larger archaeal genomes are not more prone to give genes by LGT to larger bacterial genomes (R2: 0.04085, P > 0.05). On the other hand, the test is significant for the network in which the archaea are the hosts (intruders), indicating that larger bacterial genome are more prone to give genes by LGT to larger archaeal genomes (R2: 0.2157, P < 0.001). Thus, in these networks, larger archaeal genomes are better sinks of recent inter-Domain LGT than larger bacterial genomes, whereas not ruling out the possibility of within-Domain LGT. In fact, bacterial genomes of all sizes successfully take up archaeal genes irrespective of the genome size of their donors. This observation further reinforces the hypothesis that LGT of gene families over long distance is an asymmetrical process rather than a random process between any prokaryotes sharing the same environment. Networks with bacterial hosts are unlikely artifacts of genome sizes, but networks with archaeal hosts may reflect a trend already observed in the literature (i.e., higher rates of LGT between larger prokaryotic genomes; see Cordero and Hogeweg 2009), here because larger archaeal genomes seem more porous to gene gains than smaller ones. Yet, because this data set is definitely not an exhaustive sampling of the environmental genes and species, the hypothesis of asymmetry requires further testing with additional data.
Conclusion
We cut trees in different types of partitions (clans, slices, and clips) to quickly detect and propose multiple evolutionary hypotheses. We showed that there is more evolutionary information in gene trees than only the taxonomy, even though genealogy certainly structures a significant part of the forest. We also demonstrated that not a single tree but the entire forest of trees could be worth considering as a novel phylogenetic object. Such a small prokaryotic forest allowed us to improve our knowledge about modules, adaptive genes, long distance LGTs, and putative genetic partners. It is important noting, however, that our present interpretations were dependent on the quality of the source data on habitat/lifestyle, and for that reason, better organismal/ecological descriptions of OTUs should be encouraged because this information can be exploited to improve evolutionary analyses. Finally, this work, largely in agreement with Puigbò et al. (2010), insists on the important claim that genealogical explanations are not isomorphic with evolutionary explanations, at least for prokaryotes there is an extensive decoupling of evolution and genealogy (Doolittle 1999; Boucher et al. 2003; Dagan and Martin 2006; Dagan et al. 2008; Zhaxybayeva, Swithers, et al. 2009). We hope that our contribution will encourage evolutionists to hike through the forest of life, scrutinizing it with their eyes of evolutionary naturalists. Risks to get lost in the phylogenetic woods will then be limited, as new exciting paths are discovered.
This work was funded in part by grant OGP0155251 from the Natural Sciences and Engineering Research Council of Canada to F.J.L. and by a postdoctoral fellowship from the Muséum national d'Histoire naturelle (MNHN) to K.S. The project has been undertaken when F.J.L. was invited researcher at the MNHN in Paris. The authors are thankful to James McInerney and two anonymous reviewers for their comments and suggestions that helped improve this manuscript.
References
Author notes
Associate editor: James McInerney
