


Abstract
A grand challenge in the post‐genomic era is a complete computer representation of the cell and the organism, which will enable computational prediction of higher‐level complexity of cellular processes and organism behavior from genomic information. Toward this end we have been developing a knowledge‐based approach for network prediction, which is to predict, given a complete set of genes in the genome, the protein interaction networks that are responsible for various cellular processes. KEGG at http://www.genome.ad.jp/kegg/ is the reference knowledge base that integrates current knowledge on molecular interaction networks such as pathways and complexes (PATHWAY database), information about genes and proteins generated by genome projects (GENES/SSDB/KO databases) and information about biochemical compounds and reactions (COMPOUND/GLYCAN/REACTION databases). These three types of database actually represent three graph objects, called the protein network, the gene universe and the chemical universe. New efforts are being made to abstract knowledge, both computationally and manually, about ortholog clusters in the KO (KEGG Orthology) database, and to collect and analyze carbohydrate structures in the GLYCAN database.
Received September 15, 2003; Revised and Accepted September 25, 2003
INTRODUCTION
KEGG (Kyoto Encyclopedia of Genes and Genomes) is a bioinformatics resource for understanding higher‐order functional meanings and utilities of the cell or the organism from its genome information. It is an integrated resource consisting of three types of database for genomic, chemical and network information, and associated software, which are all developed by the Kanehisa Laboratory (now part of the Bioinformatics Center) in the Institute for Chemical Research, Kyoto University. While KEGG has cross‐references to numerous outside databases, it is intended to be a self‐sufficient system for linking genomes to life at the cellular level, containing a complete set of building blocks (genes and molecules) and wiring diagrams (interaction networks) for cellular functions. Eventually, this self‐sufficient system will become a computer representation of the cell and the organism, and perhaps the biosphere as well, which will enable in silico analysis of biological systems ( 1 ). Even at the current primitive stage, KEGG is widely used for analysis of various types of molecular biological data in order to obtain clues to higher‐order functions.
During the past 2 years we have worked to make the KEGG resource ( 2 , 3 ) more accessible to automated analysis. For example, the XML representation of KEGG pathway diagrams is useful for automatic drawing of potential networks identified by two‐hybrid experiments as an extension to known networks. Access to KEGG can now be made through the KEGG API (SOAP interface to KEGG), which means that the user can write a program to analyze microarray gene expression data or to annotate a newly sequenced genome by automating KEGG queries. In addition, we have released two new database components: KO for ortholog grouping and hierarchical classification of genes and GLYCAN for carbohydrate structures. Here we describe the current status and future plans of the KEGG resource.
THE KEGG DATABASES
Graph representation
To understand the overall architecture, it is useful to know that KEGG consists of three graph objects for representation and manipulation of genomic, chemical and network data. Mathematically, a graph is a set of nodes (building blocks) and edges (interactions or relations). As shown in Table 1 the three graph objects are called the gene universe (GENES, SSDB and KO databases), the chemical universe (COMPOUND, GLYCAN and REACTION databases), and the protein network (PATHWAY database). The gene universe is a conceptual graph object representing ortholog/paralog relations, operon information and other relationships between genes in all the completely sequenced genomes. The chemical universe is another conceptual graph object representing chemical reactions and structural/functional relations among metabolites and other biochemical compounds. In contrast, the protein network is based on biological phenomena, representing known molecular interaction networks in various cellular processes ( 2 ).
Network hierarchy
Another important aspect in the overall architecture of KEGG is network hierarchy. The protein network, which is the most unique data object in KEGG, is stored as a collection of pathway maps in the PATHWAY database, representing wiring diagrams of proteins and other gene products responsible for various cellular functions. Reflecting the map resolution and functional modules at different levels, these pathway maps are hierarchically classified. There are five categories in the top level (metabolism, genetic information processing, environmental information processing, cellular processes and human diseases) and 24 subcategories in the second level. The third level in the hierarchy corresponds to individual pathway maps. When the protein network is linked to the gene universe, the fourth level corresponds to KO (KEGG Orthology) entries. Thus the hierarchy of gene functions in KEGG is based on the hierarchy of the protein network as shown in Table 2 .
GENE UNIVERSE
GENES database
The information about individual genes is stored in the GENES database. As of September 12, 2003 the GENES database contains 572 881 genes in 155 organisms. The GENES entries are generated semi‐automatically by selecting and combining various sources including authors’ submissions to GenBank (ftp://ftp.ncbi.nih.gov/genbank/genomes/), the NCBI RefSeq database (ftp://ftp.ncbi.nih.gov/genomes/), the EMBL database (ftp://ftp.ebi.ac.uk/pub/databases/embl/ genomes/) and publicly available organism‐specific databases. They are then subjected to internal re‐annotation, in which we just assign K numbers for the KO grouping of genes without updating the description of the genes. Our KO assignment appears in the ORTHOLOG line of the GENES entry.
SSDB database
SSDB was originally a sequence similarity database containing precomputed similarity scores by the SSEARCH program with additional information about best hits and best‐best hits in pairwise genome comparisons ( 2 ). We have recently implemented an automatic procedure, based on a graph analytical method, to computationally generate ortholog clusters (OCs) and paralog clusters (PCs) from the huge SSDB graph, currently containing 200 million edges. The resulting ortholog clusters can be examined by clicking on the ORTHOLOG link in the GENES entry.
KO database
When the KEGG project was initiated in 1995, the integration of genomic information and network information was achieved via the EC numbers. The EC numbers were common identifiers for matching genes in the genome and gene products (enzymes) in the metabolic pathway. Then, a new scheme using ortholog identifiers was introduced ( 3 ) to extend the matching procedure to regulatory pathways and to overcome various problems inherent in the enzyme nomenclature. KO is a further extension of this scheme based on computational analysis, as well as manual curation, of SSDB ortholog clusters in order to classify all gene functions and explore unknown pathways. Each KO entry is identified by the K number (accession number) with the previous ortholog identifier as an alternative name. In future releases of KEGG, the KO hierarchy (Table 2 ) will become more complete, and the current ortholog group tables will be part of the KO database.
CHEMICAL UNIVERSE
COMPOUND database
The COMPOUND database contains chemical structures of most known metabolic compounds and some pharmaceutical and environmental compounds. All chemical structures are manually entered, computationally verified and continuously updated. Currently the database contains 10 739 entries, each of which is identified by the C number (accession number). A new feature implemented in the COMPOUND database is the KCF (KEGG Chemical Function) representation of chemical structures shown in Figure 1 and the resulting graph‐ based chemical structure comparison method ( 4 ). The COMPOUND/REACTION databases are being moved from the ISIS system ( 5 ) to the in‐house‐developed relational database system, in order to integrate with the GLYCAN database. Once this is done the substructure search against the database will be performed more rigorously by our graph comparison algorithm rather than the bit string comparison in the ISIS system.
GLYCAN database
GLYCAN is a new addition to the KEGG suite of databases. We have initiated efforts to collect carbohydrate structures because of the lack of a publicly available database after the termination of the CarbBank project ( 6 ). The pathway diagrams for metabolism of complex carbohydrates and metabolism of complex lipids are now linked to individual entries of carbohydrate structures in the GLYCAN database. The reactions catalyzed by glycosyltransferases and other sugar‐related enzymes are represented in the REACTION database in a simpler form of carbohydrate structures (Fig. 1 ) rather than the all‐atom representation. Each GLYCAN entry is identified by the G number (accession number) and the current total is 10 445 entries, among which only a few hundred were manually entered and linked to KEGG pathways. The rest represents unique structures derived from CarbBank. The GLYCAN database is maintained in a relational database with the structure drawing tool in Java. A database search is also made available based on newly developed algorithms for tree structure comparisons.
REACTION database
The REACTION database contains reaction formulas for enzymic reactions, currently totaling 5799 entries. Each entry is identified by the R number (accession number) representing a unique reaction corresponding to sets of reactants and products represented by the C number in the COMPOUND database or the G number in the GLYCAN database. This should be compared with the EC number, which may correspond to multiple reaction formulas. The EC number hierarchy is supposed to represent aspects of enzymatic reactions, but in reality it often contains aspects of enzyme molecules. Within the KEGG resource, these two aspects of EC numbers are clearly distinguished: R numbers for reactions and K numbers for molecules. We are working to develop a new hierarchy, tentatively called RC (Reaction Classification), for understanding chemistry of enzymic reactions.
ENZYME database
The ENZYME database contains enzyme nomenclature with numerous links to KEGG databases. It is generated semi‐automatically from the enzyme nomenclature website ( http://www.chem.qmul.ac.uk/iubmb/enzyme/ ). The role of this database within KEGG has diminished, but the EC number is still the simplest way to link to KEGG from outside resources.
PROTEIN NETWORK
PATHWAY database
The protein network in KEGG is an abstract network of gene products, representing not only the pathway or the complex resulting from direct protein–protein interactions, but also the metabolic network viewed as a network of enzymes, and the gene regulatory network viewed as a network of transcription factors and target products ( 2 , 3 ). The PATHWAY database is a collection of manually drawn diagrams called the KEGG reference pathway diagrams (maps), each corresponding to a known network of functional significance. The PATHWAY database also contains organism‐specific pathways, which are automatically generated by superimposing (coloring) genes in given organisms. The database currently contains 13 457 entries including 235 reference pathway diagrams.
In the past, the pathway diagrams were available only in GIF (or PNG) image files. Although the coordinates of nodes (boxes) could be obtained from the HTML file, it was not possible to reconstruct the pathway because the edge information was not readily available. We have released the KEGG Markup Language (KGML) as a specification of graph objects in KEGG. All metabolic pathways and some regulatory pathways are now available in KGML, enabling computational reconstruction and manipulation of KEGG pathways.
ACCESS METHODS
The primary mode of access to KEGG is through the GenomeNet website at http://www.genome.ad.jp/kegg/ . Different components of the KEGG resource can most conveniently be accessed from the KEGG table of contents page at http://www.genome.ad.jp/kegg/kegg2.html . The four databases for the chemical universe, COMPOUND, GLYCAN, REACTION and ENZYME are collectively called the LIGAND database with a separate home page at http://www.genome.ad.jp/ligand/ . Table 3 summarizes these and other useful URLs including additional databases not covered in the present article.
For computerized access to KEGG, the SOAP server is open to academic users at http://www.genome.ad.jp/kegg/soap/ . All the KEGG databases, except SSDB, are also available to academic users by anonymous FTP at http://www.genome. ad.jp/anonftp/ .
ACKNOWLEDGEMENTS
The computational resource was provided by the Bioinformatics Center, Institute for Chemical Research, Kyoto University. This work was supported by grants from the Ministry of Education, Culture, Sports, Science and Technology of Japan, the Japan Society for the Promotion of Science and the Japan Science and Technology Agency.
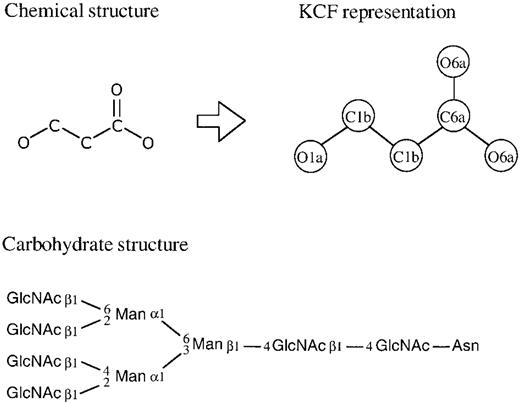
Figure 1. Chemical compound structures in the COMPOUND database and carbohydrate structures in the GLYCAN database are graph objects, where the nodes are either atoms or monosaccharides and the edges are covalent bonds. For the purpose of chemical structure comparison, the chemical structure is converted to the KCF (KEGG Chemical Function) representation where the same atoms are distinguished by their environments.
The three graph objects in KEGG
| Graph | Node | Edge | Main databases |
| Gene universe | Gene | Any association of genes (ortholog/paralog relation, sequence/structural similarity, adjacency on chromosome, expression similarity) | GENES, SSDB, KO |
| Chemical universe | Chemical compound (including carbohydrate) | Any association of compounds (chemical reactivity, structural similarity, etc.) | COMPOUND, GLYCAN, REACTION |
| Protein network | Protein (including other gene products) | Known interaction/relation of proteins (direct protein–protein interaction, gene expression relation, enzyme–enzyme relation) | PATHWAY |
The hierarchy of KEGG orthology (KO)
| 01100 Metabolism |
| 01110 Carbohydrate metabolism |
| 01120 Energy metabolism |
| 01130 Lipid metabolism |
| 01140 Nucleotide metabolism |
| 01150 Amino acid metabolism |
| 00251 Glutamate metabolism |
| .......... |
| 00300 Lysine biosynthesis |
| K00003 E1.1.1.3, thrA; homoserine dehydrogenase |
| K00928 E2.7.2.4, lysC; aspartate kinase |
| K00133 E1.2.1.11, asd; aspartate‐semialdehyde dehydrogenase |
| K01714 E4.2.1.52, dapA; dihydrodipicolinate synthase |
| K00215 E1.3.1.26, dapB; dihydrodipicolinate reductase |
| K00674 E2.3.1.117, dapD; 2,3,4,5‐tetrahydropyridine‐2‐carboxylate N ‐succinyltransferase |
| K00821 E2.6.1.17; N ‐succinyldiaminopimelate aminotransferase |
| K01439 E3.5.1.18, dapE; succinyl‐diaminopimelate desuccinylase |
| K01778 E5.1.1.7, dapF; diaminopimelate epimerase |
| K01586 E4.1.1.20, lysA; diaminopimelate decarboxylase |
| .......... |
| 00310 Lysine degradation |
| .......... |
| 01160 Metabolism of other amino acids |
| ......... |
| 01200 Genetic information processing |
| 01300 Environmental information processing |
| 01400 Cellular processes |
| 01500 Human disease |
URLs for the KEGG resource
| Database/content | URL |
| KEGG table of contents (PATHWAY, GENES, GENOME, KO, etc.) | http://www.genome.ad.jp/kegg/kegg2.html |
| SSDB | http://www.genome.ad.jp/kegg/ssdb/ |
| LIGAND (COMPOUND, GLYCAN, REACTION, ENZYME) | http://www.genome.ad.jp/ligand/ |
| EXPRESSION | http://www.genome.ad.jp/kegg/expression/ |
| BRITE | http://www.genome.ad.jp/brite/ |
| KGML | http://www.genome.ad.jp/kegg/xml/ |
| KEGG API | http://www.genome.ad.jp/kegg/soap/ |
| Anonymous FTP | http://www.genome.ad.jp/anonftp/ |
| KEGG home page | http://www.genome.ad.jp/kegg/ |
| DBGET home page | http://www.genome.ad.jp/dbget/ |
| GenomeNet home page | http://www.genome.ad.jp/ |
References
Kanehisa,M. and Bork,P. (
Kanehisa,M., Goto,S., Kawashima,S. and Nakaya,A. (
Kanehisa,M. and Goto,S. (
Hattori,M., Okuno,Y., Goto,S. and Kanehisa,M. (
Goto,S., Okuno,Y., Hattori,M., Nishioka,T. and Kanehisa,M. (

Comments