


Abstract
Well-defined relationships between oligonucleotide properties and hybridization signal intensities (HSI) can aid chip design, data normalization and true biological knowledge discovery. We clarify these relationships using the data from two microarray experiments containing over three million probes from 48 high-density chips. We find that melting temperature (Tm) has the most significant effect on HSI while length for the long oligonucleotides studied has very little effect. Analysis of positional effect using a linear model provides evidence that the protruding ends of probes contribute more than tethered ends to HSI, which is further validated by specifically designed match fragment sliding and extension experiments. The impact of sequence similarity (SeqS) on HSI is not significant in comparison with other oligonucleotide properties. Using regression and regression tree analysis, we prioritize these oligonucleotide properties based on their effects on HSI. The implications of our discoveries for the design of unbiased oligonucleotides are discussed. We propose that isothermal probes designed by varying the length is a viable strategy to reduce sequence bias, though imposing selection constraints on other oligonucleotide properties is also essential.
INTRODUCTION
Microarray technologies have become widely used in genome-wide gene expression studies. However, the interpretation of microarray data can be challenging because of technical and biological variation (1) and bias introduced by differences in probe sequences. Mounting evidence (2–6) has shown that sub-optimally designed probes are widely used in common microarray platforms. Presently, the noise resulting from biological and technical variation can be largely removed by using a number of different controls and proper preprocessing methods. Removing the sequence-biased signals is more difficult due to insufficient knowledge of the basis and components of noise caused by sequence bias. It is generally beneficial to minimize sequence similarity among probes, minimize the likelihood of secondary structure formation, achieve melting temperatures with a limited target range, maximize local complementarity and maintain a reasonably fixed oligonucleotide length (7,8). However, a comprehensive study of the relative importance of each of the factors for HSI has not been conducted, partly because of the cost to perform large-scale experiments for studying how oligonucleotide properties affect hybridization. Currently, most experiments performed to explore design criteria are small scale and can cover only a few oligonucleotide properties (4,7,9–11). Small-scale experiments can be well designed and controlled; however, they typically do not comprehensively evaluate a multitude of attributes that affect HSI or investigate interactions among these attributes.
Tm is known to be crucial for nucleic acid hybridization, but to what degree Tm affects HSI is unknown. Microarray signal intensity has been shown to increase monotonically with increasing negative free-energy change (12), implying that HSI increases positively with Tm (because the change of free energy is Tm based). A relationship between HSI and Tm is implicated in earlier melting experiments (13). In addition to Tm, the relationship between length and HSI for long oligonucleotides has not been comprehensively studied. One study covering oligonucleotides with lengths of 25, 50, 70, 100, 150 and 500 nt (14) concluded that longer probes generally yield better signal intensity. However, lengths of 100 nt or longer are rarely used in existing microarray technology because of difficulties in synthesis. Signals change radically from 25 to 50 nt and also from 70 to 100 nt, but there is very little change between 50 and 70 nt. With a few widely spaced lengths, it is difficult to accurately assess a relationship between length and HSI. SeqS has been a major concern since the advent of microarrays; however, only a few studies (7,15,16) have addressed the effects of SeqS on HSI, and the results from these studies are limited to homology beyond which cross-hybridization can occur. The effect of secondary structures on HSI has been implicated in multiple studies (4,17–20); however, the probes that were studied are exclusively of short oligonucleotides. Only one study (21) covered long oligonucleotides, but the effect of secondary structure can be observed on only 23 of 54 chips, suggesting nothing more than a weak and inconsistent relationship between secondary structures and HSI.
In this study, we explore a large quantity of expression and expression tiling microarray data to define relationships between oligonucleotide properties and HSI to assist in the design of unbiased probes or in the normalization of raw data that arise from biased probes. We calculate several oligonucleotide properties including Tm, SeqS, longest polyN, repeats, and others, and then perform a comprehensive study of these properties using regression tree analysis. We provide a ranking of the various oligonucleotide properties with regard to their effect on HSI, and show evidence for interactions among different oligonucleotide attributes. The possible mechanism for the effect of each oligonucleotide property on HSI is discussed.
MATERIALS AND METHODS
Microarray and data preprocessing
Two datasets were used in this study. Dataset I contains 39 high-density human gene expression arrays manufactured by NimbleGen Systems (www.nimblegen.com), each with 388 486 probes from ∼36000 human locus identifiers from the HG17 assembly. All probes are 60-mers with a varying melting temperature between 45°C and 76°C, according to the formula shown in the next section. All chips were hybridized to genomic DNA (gDNA) that was extracted from human embryonic stem cells (hESCs) and then sonicated into fragments with an average length of 300 base pairs (bp) before being labeled with Cy3. Raw data were extracted using NimbleScan software v2.1. The signal intensities from these arrays were normalized with the Robust Multiple-chip Analysis (RMA) algorithm (22). Dataset II is a set of nine expression-tiling arrays with a resolution of 22 nt, each containing about 385 000 probes to interrogate the expression of 32 424 regions throughout the genome. All probes have a design target Tm of 56°C according to the formula provided in the next section. The actual Tm varies between 46°C and 63°C and the length ranges from 45 to 75 nt. All of these nine chips were hybridized to cDNAs that represents mRNAs extracted from undifferentiated hESCs. The expression raw data were extracted using NimbleScan software v2.1. To correct for systemic bias caused by sample labeling and other sources, we applied qspline normalization to this tiling array data (23). We then conducted median normalization for the log probe intensities across chips based on the control sets that were tiled on the chips. All arrays used to produce Dataset I and Dataset II were manufactured by NimbleGen Systems, using their Maskless Array Synthesis technology (24). There was a 5-nt thymidine linker between each probe and the glass surface of each chip.
While we are using an expression tiling array design in Dataset II, we do not utilize target level analysis (e.g. evaluating the probes as a probe set for one cDNA) in this article, as this article focuses on the properties of the oligonucleotide probes.
Calculation of oligonucleotide properties
Previous work (16) suggests that oligonucleotide probes having >75% identity with nontargets cause cross-hybridization. There are other studies with slightly different results, e.g. 70% homology to 60-mer probes (15) and 85% homology to both 50- and 70-mer probes (7). We chose 70% homology as a cutoff for calculating SeqS after studying our datasets. We found that the HSI declines to ∼12% when SeqS drops to 70% and does not drop significantly further with SeqS below 70% (see Supplementary Data).
Marginal analysis of individual oligonucleotide properties
The impact of individual oligonucleotide attributes on the hybridization signal can be observed by performing a marginal analysis. To that end, we classified each oligonucleotide attribute into very small bins. The signals in each bin were averaged and the difference between two adjacent bins can be viewed as a marginal change. Plotting this marginal change in terms of the median and average HSI allows us to view the marginal effect of an oligonucleotide attribute on HSI. We classified each attribute into very small bins so that the effect of even a very small change on an oligonucleotide property can be observed. To reduce the biases that may be introduced from a small number of oligonucleotides, all the bins containing more than 200 oligonucleotides are displayed except one bin (LSL = 2) in LSL versus HSI (Figure 1).
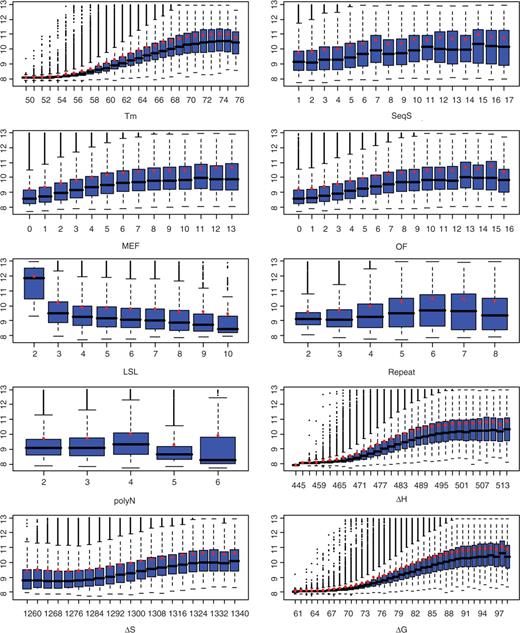
Marginal analysis of each oligonucleotide property on HSI. All boxplots shown were generated from Dataset I (genomic DNA hybridization) and the number of probes in each bin > 200 except LSL = 2, which contains 11 samples. For display, log base 2 transformation was applied before the data was plotted (except for averages). Red circles represent the log base 2 averages of untransformed data in each bin, not the average of log base 2 transformed data. This allows the fold change to be viewed in the original scale. MEF, OF, ▵S, ▵H and ▵G are all of negative values.
Analysis of positional effect
Removal of sequence-biased signals
We used the average intensities of the random probes across the 39 chips in Dataset I to further explore how much bias of oligonucleotide properties of HSI is removable. Random probes are considered negative controls in which any signals arising from these probes are due to nonspecific hybridization. The random probes are divided into a training set and a test set. A regression tree was built on the training set to study the effect of oligonucleotide attributes on probe intensities. We used this regression tree to predict the bias of intensities on the test set. Since the test set is not used in constructing the regression tree, the corrected probe intensities obtained by subtracting the predicted intensities from the observed intensities will reflect the significance of the effect of oligonucleotide attributes. To measure the extent of removal of the bias in the observed intensities due to oligonucleotide properties, we used a clustering algorithm package in R (mclust) (29) to predict the number of Gaussian distribution components that best explain the observed intensities. In an ideal case, we expect the mclust algorithm to predict a single Gaussian component that represents the noise distribution on the log base 2 transformed intensities of the random probes.
Regression tree analysis of multiple oligonucleotide properties
A regression tree is a piecewise linear estimate of a regression function, which is constructed by recursively partitioning the data and sample space. In this study, we employed the GUIDE (Generalized, Unbiased, Interaction Detection and Estimation) algorithm to build the piecewise linear regression models with univariate splits. Compared to other algorithms, (such as AID, CART and FIRM), GUIDE can control bias more effectively by integrating chi-squared analysis of residuals and bootstrap calibration of significance probabilities. More importantly, GUIDE allows for direct detection of local two-variable interactions (30).
GUIDE works by recursively partitioning the data into subsets such that the deviance is the smallest among all possible partitions. We kept partitioning the data, i.e. growing the tree until the number of probes in each subset is below a certain threshold to obtain a maximal tree structure. To avoid over-partitioning the data, i.e. over fitting, the regression tree was pruned back so that the deviance of the final tree is within an assigned standard error of the original maximal tree. Choosing a reasonable standard error for pruning would result in a tree of moderate size that is sufficient enough to differentiate the contribution of different oligonucleotide attributes on HSI without losing predictive power. An oligonucleotide property that appears higher on the tree as a splitting variable has a more significant effect on HSI. Here is a brief illustration of how GUIDE works.
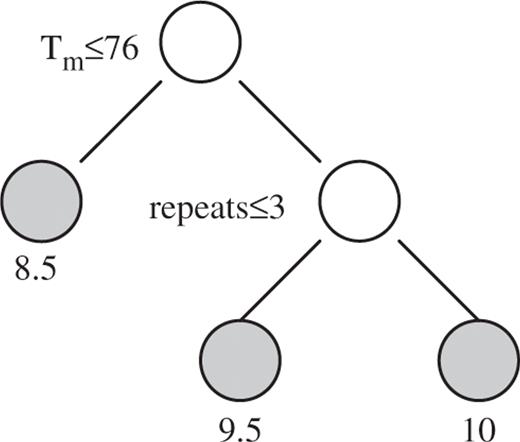
This regression tree partitions the data into three subsets. Probes that have Tm ≤ 76°C have mean intensities of 8.5. Probes with Tm > 76°C and a repeat score ≤ 3 have mean intensities of 9.5. Probes with Tm > 76°C but a repeat score >3 have mean intensities of 10.
For large datasets such as those used in this study, regression trees have the potential to demonstrate relatively complex forms of data structure, which may not be detected with conventional regression modeling. In addition, regression trees are capable of capturing nonadditive effects from large datasets like interaction between different predictors (31).
Match fragment extension (MFE) and match fragment sliding (MFS) experiments
We designed two experiments to test HSI variation with respect to the position (MFS) and length (MFE) of a subsequence that matches a target (Figure 2). In the MFE experiment (Figure 2A), 1145 probes of 60-mer length were randomly selected from Dataset I. Then each of these 1145 probes served as a template to generate nine oligonucleotides with an identity length of 15, 20, 25, 30, 35, 40, 45, 50 or 60-mer at the protruding end (5′ end). The rest of the sequence was filled with random bases from [A, T, C, G]. In total, 10 305 probes were generated. The MFE experiment thus tests the effect of longer and longer matching probes starting from the 5′ end. In the MFS experiment, 155 template probes were randomly drawn from Dataset I. For each template, 36 oligonucleotides were generated, each with a 25-mer fragment identical to the original template starting at a position between 1 and 36. The rest of the sequence was filled with random bases from [A, T, C, G]. In total, 5580 probes were generated. The MFS experiment thus tests the importance of position for the matching 25-bp fragment. The hybridization conditions were the same as described (32) and there were four replications for both MFE and MFS experiments.
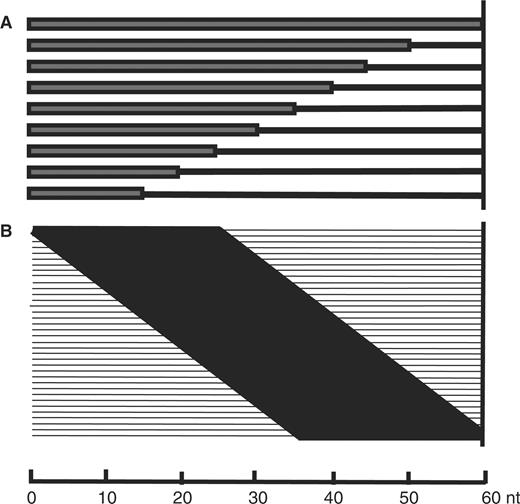
(A) MFE. The matched fragment has a starting length of 15 and extends 5 nt each time until the length reaches 50 nt (original full-length template was added as control). (B) MFS. Length of the sliding fragment is 25 nt. Matching regions are shown in black bars, while nonmatched regions are shown in lines. The sliding step is 1 nt. The positions of nonmatched were filled with a random base from A, T, C and G.
RESULTS
Melting temperature (Tm)
The marginal analysis of Tm on HSI (Figure 1) shows that Tm is one of the most important factors, as minor changes in Tm can cause a substantial change in HSI. The probes with a Tm between 50 and 57°C have low HSI while probes with Tm between 58°C and 76°C show increasing HSI with Tm. Probes with higher Tm tend to have higher HSI. Under our experimental conditions, a probe with a Tm of 74°C exhibits an average HSI of 8-fold of that of a probe with a Tm of 50°C and a median HSI of more than 6-fold of that of a probe with a Tm of 50°C.
The significant impact of Tm on hybridization signal can be easily explained. The probes with higher Tm also have higher annealing temperature, Ta. Tm is the temperature at which 50% of DNA double-helix molecules become denatured to single strands, while the annealing temperature is the temperature at which probes anneal to the complementary DNA strands and form stable helices. Ta is estimated empirically to be 5–10°C lower than Tm (33,34). Therefore, oligonucleotides with higher Tm should have a higher Ta accordingly, and they can easily form more stable double strand polynucleotides at a lower hybridization temperature owing to the formation of more hydrogen bonds between the two strands.
The conspicuous relationship between Tm and HSI is in agreement with the observation that signal intensities increase monotonically with the increasingly negative free energy changes (12) because the change of free energy is Tm based (▵G = −RT ln K). Tm and ▵G are highly correlated (r = −0.98) in our dataset. The relationship between Tm and HSI is also consistent with melting experiments in which the degree of hybridization is a function of temperature (13).
Length and hybridization
A relationship between HSI and probe length was inspected with microarray data expression tiling arrays containing a total of ∼3.4 million probes. All HSIs were plotted with boxplots (Figure 3A). It is obvious that most probes of a variety of lengths have nearly equal median and average HSI. Probes with length of 71 nt have nearly the same median as adjacent lengths but a higher average; this is caused by outliers (Figure 3A). Thus, if we are able to explain the two other exceptions of 45 and 49 nt, we then can conclude that the influence of length on HSI is limited.
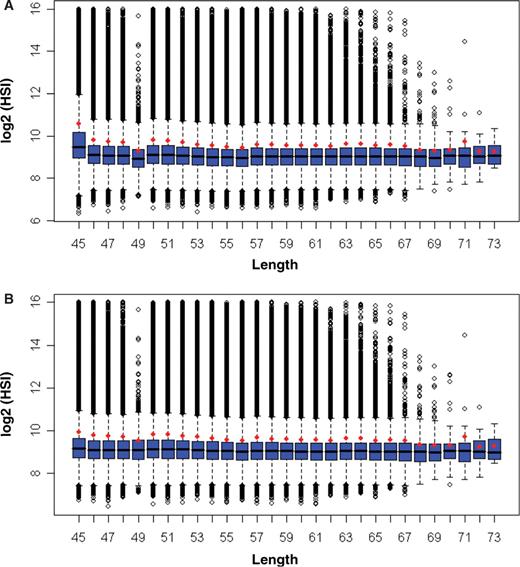
Boxplots of length versus HSI. (A) All probes. (B) Probes with Tm from 53 to 63°C. The average HSI for each length was added to the figures in red circles. For display, log base 2 was applied before the data was plotted. Red circles represent the log2 of the averages of untransformed data of each bin. Length 74 and 75 nt were not shown because of the small number of probes in these two bins.
As we have just shown, Tm has a significant influence on HSI, the higher median and average HSI of the 45 nt and lower average and median HSI of 49 nt are likely to be caused by the higher and lower Tm of these two groups respectively. The 45-nt oligonucleotides have a median Tm of 62.1°C and an average Tm of 62.7°C. 49-nt oligonucleotides have a median Tm of 53.9°C and an average Tm of 53.7°C. The oligonucleotides of other lengths have a median Tm between 55.6°C and 57.7°C and an average Tm between 55.3°C and 57.6°C. If Tm is primarily responsible for the HSI difference seen in oligonucleotides of 45 and 49 nt, we should observe approximately the same HSI for all lengths once the probes with higher and lower Tm in these two lengths are excluded. To test this, we removed the probes with Tm < 53°C and Tm > 63°C for all sizes. We then re-plotted length versus HSI (Figure 3B). Probes of 45 and 49 nt now have approximately the same median as probes of other lengths, implying that higher and lower Tm is primarily responsible for stronger and weaker signals observed for 45 and 49 nt lengths, respectively.
Sequence similarity
The propensity for homologous sequences to cross-hybridize has clearly been demonstrated in Southern, northern and in situ hybridization, and it is for this reason that some researchers and chip vendors have attempted to design oligonucleotides with low SeqS. The effect of SeqS on HSI has not been comprehensively studied. Our results suggest that influence of SeqS on HSI can be classified into three distinct types. HSI increases nearly linearly with SeqS from 1 to 16 (Figures 1 and 4). HSI is relatively uniform between SeqS of 17–39. A surge of hybridization signals was observed when SeqS is >39 (Figure 4). In this case, HSI can reach 11-fold in median and 5.4-fold in average of their values at SeqS of 1. The median/average HSI fluctuates dramatically with SeqSs above 39 due to the small number of observations at each SeqS. Nevertheless, the median/average HSI is much higher with SeqS above 39 than it is with lower SeqS values. From the definition shown earlier, a SeqS of 40 means there are 40 copies of 100% match or 57 copies of 70% match to the oligonucleotide probes in the human genome. In this sense, we are able to conclude that the use of probes that have more than 40 perfect matches in the genome significantly increases the sequence-biased signals. Although only ∼0.5% probes have a SeqS > 39, the genes represented by these probes have a high chance of being called expressed, or highly expressed when in fact they are not.
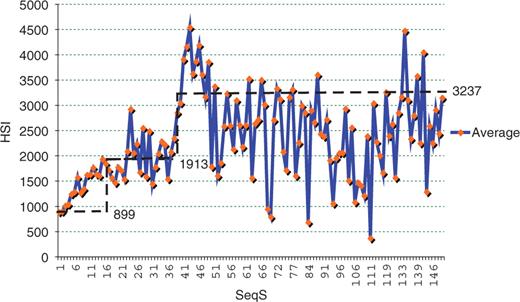
The effect of SeqS on HSI. Each HSI value shown within SeqS ≤ 49 is the average of at least 30 probes from the chips, and each HSI value within SeqS > 49 is the average of at least two but less than 29 probes. Note that number of probes in each point above a SeqS of 39 is small, explaining the fluctuations seen in the large SeqS. The horizontal dashed lines are the average of all samples within SeqS of 1–16, 17–38 and 38–150 respectively.
Secondary structure
Three oligonucleotide attributes that represent secondary structure were analyzed. They are MEF, OF and LSL. MEF and OF are highly correlated (r = 0.987) and the correlation coefficient between MEF and HSI and the correlation coefficient between OF and HSI are identical (r = −0.30). Their effects on HSI are very similar (Figure 1), which is also suggested by regression tree analysis (Figure 9). Therefore, using either one of them to represent secondary structure is equally sufficient. Compared to LSL, MEF and OF appear to be better attributes to represent secondary structure than LSL (Figure 7A and B). The scaled importance of either MEF or OF from regression tree analysis is slightly larger than that of LSL (28.1 versus 22.8) for expression tiling and much larger than that of LSL (34 versus 17.8) for gDNA hybridization. In addition, the correlation coefficient between LSL and HSI (0.1) is much smaller than that between either MEF and HSI or OF and HSI.
Oligonucleotides that have LSL ≤ 2 tend to have much higher HSI than the oligonucleotides that have LSL ≥ 3 (Figure 1). The average and median HSI with LSL ≤ 2 is 3.4- and 5.1-fold more than these with LSL ≥ 3, suggesting that intramolecular pairings of 3 nucleotides can form a secondary structure that significantly reduces hybridization.
Other oligonucleotide attributes
The impact of polyN on HSI is difficult to determine because the polyN only ranges from 2 to 6 in this study. HSI increases slightly with polyN from 2 to 4 and then starts to decline with higher polyN (Figure 1). The same pattern was still observed when probes within a narrow range of Tm(55° ≤ Tm ≤ 55.5°) were plotted (not shown). Nevertheless, although the relationship between polyN and HSI is not monotonous, polyN stretches can indeed cause the HSI to change up to twofold in median and 1.6-fold in average in the data we analyzed.
Position-dependent effects on HSI
DNA probes immobilized on a solid surface at high density exhibit different hybridization dynamics than DNA in solution, as shown by several studies (10,35–41). Protruding ends of probes are postulated to have a larger role in hybridization than the tethered-ends in hybridization, likely due to steric effects. We employed linear regression models to investigate the ranking of importance of positional effect along the probes. The result is shown in Figure 5. We found that the bases contribute to the HSI in descending order of G > C > T > A within the position 0–40 from the protruding end. This order was in agreement with the order concluded from a previous study (42) on Affymetrix 25-mer oligonucleotides but slightly different from the order concluded from NimbleGen 36-mer oligonucleotides, in which C > G > T > A was observed (42). Our results suggest that the relative contribution of nucleotides becomes indistinguishable after position 40 in 60-mer probes. As anticipated, protruding ends contribute more to HSI than tethered ends. The contribution of nucleotides to HSI reaches a peak around position 10 from the protruding ends.
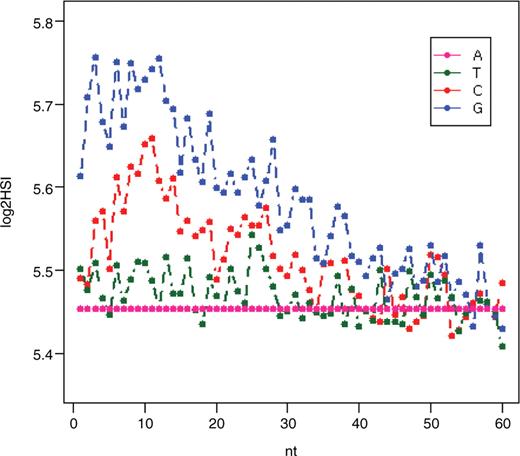
Contribution of oligonucleotide composition to HSI at different positions.
To confirm that protruding ends produce more signal, we designed MFS and MFE experiments to test this, and results from these two experiments are in agreement with above analysis. The result from the MFS experiment clearly showed that the protruding ends contribute more to the HSI with match fragments at the protruding end having 1.77-fold more signal than match fragments at the tethered end (Figure 6A). Results from the extension experiment showed that the first 40 nucleotides near the protruding ends on average produced 99.3% signal of that of a 60-mer probe (Figure 6B), suggesting that the 20 nucleotides near the tethered ends do not contribute to the signal.
(A) The expression levels (log base 2) measured by 25-mer perfectly matched sliding fragments within 60 nt oligonucleotides. For each start position, 620 probes (155 template oligonucleotides × 4 replicates) were used for computation. (B) Extension of the matched fragment from the protruding end to the tethered end of oligonucleotide. The number preceding the ‘M’ is the length of matched fragment and the number preceding the ‘R’ is the length of random sequences. For each matched length, data harvested from 1145 template oligonucleotides × 4 replications were used for computation.
Regression tree analysis of all studied oligonucleotide properties
Marginal analysis provides us a way to assess the impact of individual oligonucleotide properties on HSI. A more comprehensive statistical approach is needed to look at the relationships between various oligonucleotide properties and HSI. Regression trees with GUIDE can fulfill this purpose not only because GUIDE trees provide a good compromise between comprehensibility and predictive accuracy, but also because they provide unbiased prediction and are more sensitive to the local interaction during the split selection (30). A regression tree comprises a hierarchy of nodes. At each node except the bottom ones, a logical test is performed on one of the predictor (input) variables. The leaves of the tree contain the average prediction of the model. Each test has the form Variable Operator Value (e.g. Temperature <45.7), and has two possible outcomes, true or false. Any path from the top node to a leaf can be seen as a conjunction of logical tests on the predictor variables. The trees grown with the recursive partitioning algorithm are typically postpruned to ensure a better compromise between comprehensibility, predictive accuracy and to prevent over-fitting.
We applied the regression tree GUIDE algorithm to our microarray datasets with HSI as the predicted attribute and oligonucleotide properties as input attributes or regressors. The results from Dataset I and Dataset II suggest that Tm is the variable that has the most significant impact on HSI, and that all other properties have less than 40% the impact on HSI that Tm does (Figure 7A and B). Small differences in the ranking of different properties in genomic DNA and cDNA hybridization were observed. Repeats contribute threefold more in whole genomic DNA hybridization (Figure 7A) than in cDNA hybridization (Figure 7B). ▵S also plays a more important role in genomic DNA hybridization than in cDNA hybridization (Figure 7A and B). polyN contributes slightly more in genomic DNA hybridization than in hybridization of cDNA. LSL has an equivalent effect in either genomic DNA or mRNA samples. Consistent with the marginal analysis, cross-hybridization does not play a significant role in genomic DNA hybridization, and length contributes very little to the HSI compared to other oligonucleotide attributes.
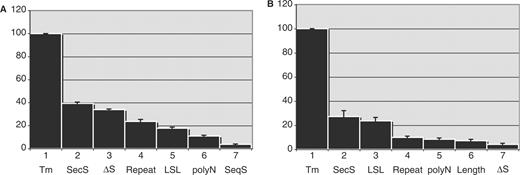
Scaled scores of different oligonucleotide properties resulted from regression tree analysis on six randomly partitioned subsets of datasests. (A) Dataset I: genomic DNA hybridization. (B) Dataset II: cDNA hybridization. SecS: secondary structure represented by MEF or OF.
The interaction among different oligonucleotide properties on HSI can be observed in Figure 9. The interaction seems to be more complicated as Tm increases. When Tm is low, Tm shows occasional interaction with secondary structure represented by MEF or OF. When Tm is moderate, Tm has a stronger interaction with MEF or OF and occasional interaction with R (repeats). When Tm is high, Tm interacts more intensively with polyN, repeats and LSL. The regression tree analysis suggests that repeats, polyN and LSL contribute more sequence-biased noise in oligonucleotides with higher Tm while MEF or OF contributes more sequence-biased noise in oligonucleotides with a moderate Tm.
Correction of sequence-biased signals
Since random probes are negative control probes, the log base 2 transformed intensities should obey a Gaussian distribution, analogous to noise. Therefore we expect the mclust algorithm (29) to predict a single Gaussian component on the intensities of random probes in an ideal case. However, as evidenced in panel A of Figure 8, the mclust algorithm predicted five Gaussian mixture components on the intensities of these random probes, demonstrating the presence of bias in the observed signals. Figure 8B shows the same analysis on the corrected probe intensities by removing the effect of oligonucleotide properties. This again illustrates the majority of the bias of oligonucleotide properties on HSI can be removed, as shown by the reduction in the predicted number of Gaussian mixture components on an independent test set. Moreover, the distributions of the probe intensities become more symmetrical after the correction as would be expected for random probes. Similar results are observed when the analysis was implemented on the probes in Dataset I as given in the bottom two panels (C and D) of Figure 8.
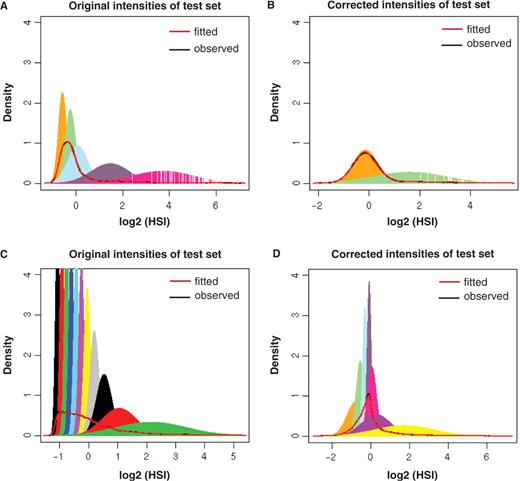
Comparison of original sequence-bias contained data (left) with sequence-bias corrected data (right). Results from random probes are shown in the upper panel and the results from Dataset I (genomic DNA hybridization) are shown in the lower panel.
DISCUSSION
Although microarray technology has been employed for more than ten years, concern over the quality of microarray data persists because the technology involves multiple complicated processes that are very difficult to control or fully understand. The design of unbiased probes is one of the most crucial steps of these processes, and studying and understanding the behavior of oligonucleotides on a solid surface at high density is the first step to designing unbiased probes. In this study, we determine the importance of oligonucleotide properties in affecting hybridization signals by investigating a large volume of high-density microarray datasets, covering both expression chips hybridized with DNA and expression tiling chips hybridized with cDNA reverse transcribed from mRNA samples. This information is useful for guiding the design of sequence unbiased oligonucleotides or in normalizing data from chips with biased oligonucleotides.
The probes that have the potential for strong sequence-biased signals are those that have higher Tm (Figure 9). Higher Tm probes are capable of capturing nonspecific targets, mainly due to their stronger affinities arising from more G/C in their sequences which is augmented by the presence of polyN stretches and repeats, both enhancing the generation of sequence-biased signals on higher Tm probes. The bias of HSI by secondary structures seems to be favored in the probes with modest Tm, suggesting that a partial duplex is probably formed before the melting of secondary structures. As a result, the secondary structure strongly impedes the hybridization. This result is in agreement with a recent observation that secondary structure is not the rate-limiting factor at high temperature (43). In general, high Tm probes show more interaction with other attributes (such as LSL, polyN and secondary structure) than do probes with low Tm.
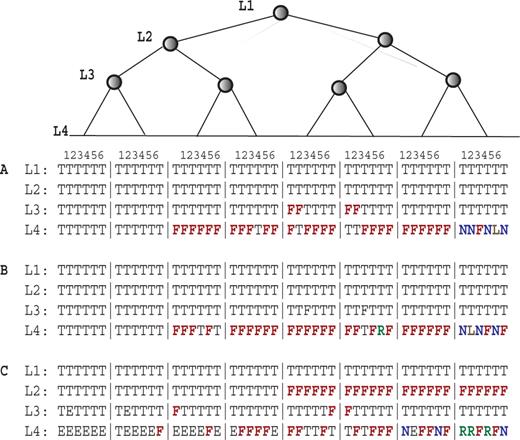
Complete paths extracted from regression tree analysis of six subsets of data. Each vertical column is a path on the regression tree and only four depths are displayed. (A and B) are from Dataset I (genomic DNA hybridization). (C) is from Dataset II (cDNA hybridization). For 9A, MEF was used for analysis. For 9B, OF was used for analysis. L1–L4 represent the depths of the regression trees, T, Tm; F, MEF/OF; L, LSL; N, polyN; R, repeat; E, leaf node. Eight branches of the tree are displayed. Each branch is comprised of six paths derived from six sub-datasets. For each node, the left child is less than the right child.
For the first time, we provide evidence that length in long oligonucleotides plays a minor role in influencing HSI. One earlier study (14) involving only 56 probes of 50 nt length and 56 probes of 70 nt length reported that the signal intensities changed very little at the two different lengths. Intermediate length probes were not studied, making interpretation difficult. In our report, length was studied at 1 nt increments between 45 and 75 nt, and our results were derived from more than 3 million probes. Based on the fact that Tm has the largest marginal effect on HSI and length has the smallest marginal effect on HSI, we suggest designing isothermal probes by relaxing the constraint imposed on length. NimbleGen was one of the first microarray vendors to take the isothermal approach and many vendors are following suit. Unfortunately, vendors often impose constraints on the shortest or longest length allowed. These limitations may confound results because of effects on HSI caused by variant Tm values in the length-limited cases. Although other oligonucleotide properties, including SeqS, polyN, repeat, LSL and entropy (▵S), usually have 40% or less impact on HSI compared to the effect of of Tm, their effect on HSI cannot be neglected because the change of HSI caused by these attributes can reach a few fold which is enough to change the interpretation of microarray data results.
It is easy to imagine that HSI is proportional to SeqS. Our results demonstrated that the impact of SeqS on HSI is small but complex. One possible explanation is that the hybridization of targets to probes is competition-based and the displacement of imperfectly-matched targets by perfectly matched targets happened to some degree when hybridization is performed for a sufficiently long time. This explanation is seemingly supported by the evidence acquired by employing real-time dual-color fluorescence technology and quartz microscopy (39), in which two phases of hybridization are observed. During the first phase, the targets that are in higher abundance dominate the hybridization, whereas during the second phase, the targets with high affinity displace those with low affinity. The surge observed at SeqS equal to ∼39 is hard to explain, but indicates SeqS can potentially give rise to significant bias for high values of SeqS. Although the probes with SeqS > 39 are only about ∼0.5% of all probes, the genes represented by these probes have a high chance of being called expressed, or highly expressed when in fact they are not. Due to the significant enhancement, these false-positives may be selected by biologists for downstream analysis. We show this phenomenon, as it may be worthy of further study. The relatively larger variance based on SeqS (Figure 1) may result from the complicated interactions of perfect matched oligonucleotides and partially matched oligonucleotides. Certainly, we could not rule out the possibility that the SeqS is not a sufficient index to reflect these complicated interactions during this process that involves the whole genome. Although we know of some studies attempting to evaluate cross-hybridization using relative free energy of match and mismatch duplex formation (10,44), the models proposed are still not mature. These models are suitable for evaluating probes and specifically designed targets and are not robust enough to be used for evaluating probes and the whole genome.
We speculate that intended targets present in complementary strands in hybridization buffer can trigger the formation of complicated hybridization aggregates when they reach a threshold concentration, at which the association of a probe to multiple targets or a target to multiple complement targets become facile and dominating. In any case, the results shown here suggest that HSI strongly depends on not only the relative richness of the targets, but also the concentration of the targets. Therefore, caution must be taken when more than adequate quantities of targets are used in hybridization, which may result in the dramatic increase of HSI for those probes that have higher SeqS.
We believe this is the first time that thermodynamic approaches such as MEF/OF have been directly compared with LSL using large-scale microarray data. Thermodynamic approaches such as MEF or OF represent secondary structures much better than LSL. Secondary structures predicted with internal base-pairing approaches are still widely used. The lower accuracy of LSL in representing secondary structures suggests that the probes may not necessarily fold to form a typical stem-loop structure with maximal stem length. Nevertheless, we have observed higher HSIs for oligonucleotides with LSL ≤ 2 than we do for oligonucleotides with LSL ≥ 3, indicating that LSL should be considered in oligo design. In addition, secondary structure represented by MEF/OF is one of the higher-ranking oligonucleotide properties in affecting the HSI (Figure 7A and B), and thus, they should receive much more attention in oligonucleotide design. This conclusion is in agreement with a prior study (4), which indicates that secondary structures affect probe binding efficiency noticeably and should receive more attention.
Our results from MFS and MFE experiments clearly imply there is a penetrable layer for hybridization, and the depth of this layer is 40 nt for 60-mer oligonucleotides. Coincidently, oligonucleotides tend to have the same average HSI when they are more than 45 nt long. Steel's flexible coil configuration model (38) is probably not valid for long oligonucleotides because the phenomenon was not observed on high density arrays, and it cannot explain the reduced influence of probe length on HSI when probes are more than 45 nt long. We propose an alternative scenario based on our results from studying the length–HSI relationship, and MFS as well as MFE experiments: We speculate that probes, when synthesized at very high density, take on a ‘coil-like’ configuration. The persistent length of ssDNA is ∼10 bases or ∼4 nm (45), suggesting that the first ten bases near the surface is stiff and the rest is flexible and presumably forms a coil-structure. In addition, the radius of gyration in hybridization phase (ssDNA) is 15–20 nm (45), which is larger than the average distance between two adjacent probes in NimbleGen high-density chips (NimbleGen high-density chips contain ∼106 probes in 15 × 15 μ). In this case, the depth of the penetrable ‘layer’ for hybridization depends more on probe density than on length. Prior data implicates the density of probes as a factor affecting target-capture rates (36). In addition, length is a confounding factor and the impact of length on other attributes e.g. Tm becomes insignificant when the oligonucleotides are >40 nt long. For example, when length is between 25 and 30 nt long, one base change in length can cause Tm to change ±0.8°C. This impact is decreased to ±0.27°C for oligonucleotides with a length between 41 and 45 nt and ±0.1°C for oligonucleotides with length between 76 and 80 nt, implying that the same length change in shorter oligonucleotides can cause more dramatic changes in the resulting HSI. As protruding ends produce more signals, we suggest that probe selection criteria should attach more weight to the protruding ends of oligonucleotide candidates.
Differences in the ranking of different properties in genomic DNA and cDNA hybridization can be explained in the context of a biological scheme. For example, repeats contribute 2.5-fold more in genomic DNA hybridization than in cDNA hybridization. Although the mechanism for this is not clear, repetitive sequences present in the probe sequences may result in more nonspecific signals when targets are genomic DNAs, as in situ hybridization experiments show that the stringency wash is crucial for getting rid of nonspecific signals (5). ▵S also plays a more important role in genomic DNA hybridization than in cDNA hybridization (Figure 7). This may be caused by the formation of more dsDNA during hybridization that demands more change in entropy for hybridization (43). polyN contributes slightly more in genomic DNA hybridization than in hybridization of cDNA, probably because there are more nonspecific targets in the genomic DNA samples. LSL is an intramolecular pairing structure, and once formed, it probably challenges genomic DNA or cDNA samples similarly. We indeed observe relatively invariant contribution of LSL in genomic DNA hybridization and cDNA hybridization. However, the folding properties as represented by MEF and OF do play different roles when targets are genomic DNA and cDNA derived from mRNA. Folding ability plays a more important role in enhancing target-probe formation or stability when targets are genomic DNAs. We thus observed more impact of MEF and OF in genomic DNA hybridization.
The analysis performed on Dataset II did not take into account SeqS, because Dataset II is derived from hybridization of cDNAs that represents mRNAs. It is impossible to calculate SeqS of oligonucleotides for transcripts given the unknown number of transcripts and their abundance in the genome. New technologies have revealed an unprecedented number of transcripts, which include polyA− mRNA species, an extensive repertoire of siRNA, and numerous previously unidentified RNA species resulting from alternative promoter usage and intron splicing (46–49). Nevertheless, given that the impact of SeqS on HSI is limited and that there is no significant correlation between SeqS and other oligonucleotide properties, we assert that the general ranking and importance of the oligonucleotide properties concluded from Dataset II are correct.
When two channels are used, some sequence bias can be removed by taking a ratio of the two channels. However, the quantity of sequence bias removed is not well documented. In addition, two-color labeling has been shown to introduce its own sequence bias and complicate normalization (50,51). Finally, two channels are not employed in many large-scale expression and tiling experiments owing to the increased cost. Removing or minimizing sequence bias at design time avoids these issues.
Many other factors such as type of hybridization buffer, type of solid surface, length of stilt, probe density (36), as well as target concentration and target properties (52), may affect the relationships within oligonucleotide properties and between oligonucleotide properties and HSI found in this study. Therefore, the results we present require further study on other platforms and other experimental conditions. Nonetheless, we believe that the results presented here are useful for the design of sequence-unbiased probes, allowing for more accurate representations of biological phenomena via microarrays.
ACKNOWLEDGEMENTS
We thank members of Dr James A. Thomson's lab at the University of Wisconsin for providing DNA and RNA samples for hybridization, Karen Jenny Heidarsdottir and Bryndis Krogh Gisladottir for producing microarray data and Deborah J. Faupel for critical reading of the manuscript. We also thank Dr Michael Zuker at Rensselaer Polytechnic Institute for the usage of the OligoArrayAux package and Dr John SantaLucia at Wayne State University for sharing the parameters of the nearest neighbor model for long oligonucleotides. This study was supported by National Institutes of Health (HG03747 to P.F.K. and S.K., RR000167 to J.A.T.): phRMA Foundation Research Starter Grant to P.F.K. and S.K.; UW Foundation grant to P.F.K. Funding to pay the Open Access publication charges for this article was provided by NIH grants HG03747 and RR000167.
Conflict of interest statement. None declared.
REFERENCES
Author notes
The authors wish it to be known that, in their opinion, the first two authors should be regarded as joint First Authors

Comments