


Abstract
Genome3D, available at http://www.genome3d.eu, is a new collaborative project that integrates UK-based structural resources to provide a unique perspective on sequence–structure–function relationships. Leading structure prediction resources (DomSerf, FUGUE, Gene3D, pDomTHREADER, Phyre and SUPERFAMILY) provide annotations for UniProt sequences to indicate the locations of structural domains (structural annotations) and their 3D structures (structural models). Structural annotations and 3D model predictions are currently available for three model genomes (Homo sapiens, E. coli and baker’s yeast), and the project will extend to other genomes in the near future. As these resources exploit different strategies for predicting structures, the main aim of Genome3D is to enable comparisons between all the resources so that biologists can see where predictions agree and are therefore more trusted. Furthermore, as these methods differ in whether they build their predictions using CATH or SCOP, Genome3D also contains the first official mapping between these two databases. This has identified pairs of similar superfamilies from the two resources at various degrees of consensus (532 bronze pairs, 527 silver pairs and 370 gold pairs).
INTRODUCTION
Knowledge of a protein’s 3D structure can provide critical insights into aspects of its biological function: from catalytic mechanisms and protein–protein interactions to the reasons that specific gene mutations cause harmful disruptions.
Genome3D collates and presents data from resources that use the domain structures from the Structural Classification of Proteins (SCOP) and CATH classifications to provide predictions on sequences for which a structure may not yet have been solved. The SCOP and CATH databases classify protein domains derived from structurally characterized proteins deposited in the Protein Data Bank (PDB) (1). Domains are classified into homologous superfamilies and fold groups (see ‘Materials and Methods’ for more information on SCOP and CATH).
Although both resources combine automated methods with manual curation to detect homologous domains, SCOP relies more heavily on manual curation. For CATH, homologs are automatically recognized using in-house structure comparison methods [SSAP (2), CATHEDRAL (3) and Hidden Markov Model (HMM)-based strategies (4)]. In addition to differences in protocols for structure classification, SCOP and CATH use somewhat different criteria for recognizing domain boundaries in multi-domain structures. SCOP only recognizes domains that have been observed to recur in different multi-domain contexts, whereas CATH also use physical considerations such as globularity and compactness.
Although all five domain prediction methods in Genome3D exploit homology-based approaches to predict domain structures in uncharacterized protein sequences, different strategies are used (see ‘Materials and Methods’ section). Some (Gene3D, SUPERFAMILY) exploit HMM-based strategies for recognizing relatives of SCOP or CATH superfamilies. Others use more sensitive threading-based strategies, which detect much more remote homologues to SCOP (FUGUE, Phyre) or CATH (FUGUE, pDomTHREADER) superfamilies.
All five resources are widely used by the biology community to obtain structure predictions and annotations for their sequences. However, it is clear that, especially in the cases of remote homologues, none of the methods is guaranteed to provide the correct answer. Therefore, a major aim of the resource is to display predictions from all the groups so that users can identify regions that are more likely to be correct because there is extensive agreement between the resources. This information is displayed in a highly intuitive fashion. Furthermore, users can easily follow links from Genome3D to any of the individual resources if they need more information.
Thus Genome3D is analogous to InterPro in providing comparisons between domain family annotations supplied by different resources. A major difference with InterPro, however, is the fact that Genome3D provides structural annotations for very remote homologues in domain families (i.e. predictions from FUGUE, pDomTHREADER, Phyre). These annotations are not provided in InterPro. Furthermore, <50% of the structure annotations provided by Gene3D/SUPERFAMILY are displayed in InterPro, and no predicted 3D models are provided by InterPro. Instead, it focuses mainly on sequence-based family resources. Thus, Genome3D is an important complementary resource.
Structure data, and in particular the 3D models provided by Genome3D, are important in understanding the mechanisms by which proteins function. For example, 3D structure can help identify highly conserved residues clustering in active site regions. It is becoming increasingly important in interpreting the impacts of genetic variants identified by the next generation sequencing projects. These correspond to non-synonymous single nucleotide polymorphisms (nsSNPs) and alternative splice variants that can affect the structure of the protein and its ability to perform its function. For example, mutations of residues in or close to the active site have been found to be implicated in some cancers (5). By providing 3D models and information on regions of high and low confidence in the domain predictions, Genome3D can help biologists and biomedical researchers determine whether genetic variations, e.g. nsSNPs, are likely to damage the structure and thereby affect the proper functioning of the protein.
EXAMPLE OF USE
Investigating structure-based predictions for a sequence
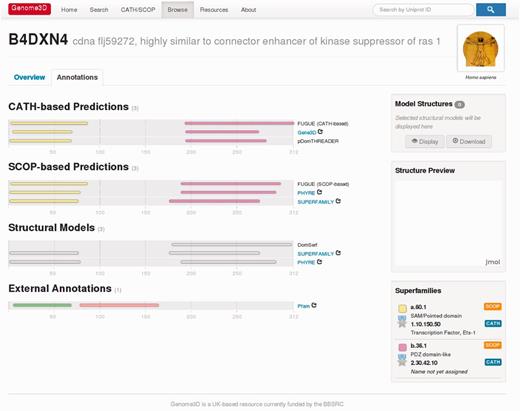
Genome3D can be demonstrated most effectively by using a specific example, for instance the sequence with UniProt accession B4DXN4 (and gene name CNKSR1). Genome3D’s pages can be found at http://www.genome3d.eu. This sequence’s Genome3D page can be found by using the search box at the top-right of any Genome3D page (or by using the Search page, accessible from the top menu). The user can currently search for a sequence using identifiers such as its UniProt accession, gene name or description. On searching for B4DXN4, the user is taken to a page giving an overview of the sequence. Switching from the Overview tab to the Annotations tab gives the page shown in Figure 1. The diagrams on the left of this page show the sequence locations of predictions; the bottom of each diagram displays the residue numbering, running left to right. Resting the mouse over any of the predictions produces a dialogue box that offers more detail as illustrated in Figure 2a.
The Genome3D annotations page for the sequence with UniProt accession B4DXN4.
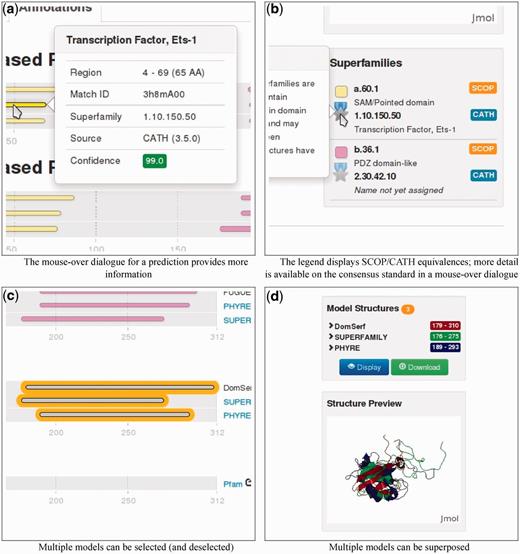
Details illustrating specific parts of the functionality of the Genome3D annotation page shown in Figure 1.
The colored strips in the CATH-based Predictions and SCOP-based Predictions panels indicate the location of domains predicted for the sequence by the Genome3D resources based on its similarities with domains from SCOP or CATH. Each resource’s name is shown at the right end of its predictions; for some resources, this name also acts as a clickable link to the resource’s page for the sequence. In the case of B4DXN4, we see that all six resources have predicted domains over similar stretches of the sequence. The legend at the bottom-right of the page translates the strips’ colours to the SCOP or CATH superfamilies they represent, as illustrated in Figure 2b.
In the case of B4DXN4, equivalent domains from each primary data source (SCOP or CATH) have all been predicted based on matches to the same superfamily (more specifically, all the first SCOP-based domain predictions are based on a.60.1 and all the first CATH-based domain predictions are based on 1.10.150.50). This can be seen from the consistent use of the same colour within each group of equivalent domains. Further, this page automatically uses the consensus data from the CATH/SCOP mapping (described later in the text) to use the same colour for equivalent CATH and SCOP superfamilies. The superfamily legend reflects this by grouping equivalent superfamilies and indicating their standard of equivalence with a bronze, silver or gold medal, as shown in Figure 2b. In the case of B4DXN4, all six resources have produced similar predictions based on equivalent SCOP and CATH superfamilies, and this can be seen from the same colour being consistently used within each group of six equivalent domains.
Annotations from outside Genome3D are displayed at the bottom of the page. This section currently shows Pfam-predicted domains. Comparing B4DXN4’s structure-based Genome3D predictions with its sequence-based Pfam predictions shows how the two approaches are complementary: whereas Pfam predicts domains in the early and middle sections of the sequence, the Genome3D resources predict domains in the early and late sections. In the case of the Genome3D predictions, the details of each prediction’s source give helpful information to better understand these decisions.
This page also includes a Structural Models panel containing predictions of the domains’ 3D structures based on the domain structures in SCOP and CATH. Each of these structural models can be selected or deselected with a mouse click; selected models are highlighted with an orange halo, shown in Figure 2c. A listing of the selected structures is displayed in the Model Structures panel on the right side of the page. The structures can be viewed using either the Display button below (which displays the structures within the Jmol Structure Preview panel, shown in Figure 2d) or the Download button (which downloads a PDB file to be viewed with the user’s preferred software). If multiple models are selected when the Display or Download buttons are clicked, the structures are automatically superposed before being sent for viewing. Groups of models can only be superposed where there is suitable overlap between their equivalent residues; therefore, the Display or Download buttons will only activate when a suitable set of models has been selected. When an incompatible group of structural models is selected, a warning message is displayed.
Investigating equivalent SCOP/CATH superfamilies
Genome3D also presents data on equivalent superfamilies between SCOP and CATH, based on a mapping that has been conducted between them as part of an ongoing analysis. This mapping has involved two stages: comparing SCOP domains with CATH domains and then aggregating these results to compare SCOP superfamilies with CATH superfamilies.
Mapping between SCOP domains and CATH domains involves finding all pairs of SCOP/CATH domains that share residues in common and analysing the extent of this overlap. For each such pair, the number of residues in common and the number of residues of each domain is stored in the Genome3D database. Mapping between SCOP and CATH superfamilies involves aggregating the results from the domain comparisons to analyse pairs of superfamilies with any non-trivial domain overlaps. The comparison was performed using all 2626 superfamilies from CATH v3.5.0 and 1962 superfamilies from SCOP v1.75 (because the non-true SCOP classes h, i, j and k were excluded from the comparison).
The Genome3D pages currently use this data to present a list of equivalent superfamilies between SCOP and CATH, referred to as consensus superfamily pairs. This list is presented on the CATH/SCOP Superfamily Pairs page, shown in Figure 3, which may be viewed by selecting the CATH/SCOP Mapping section of the Resources page, linked to at the top of all the Genome3D pages. There are 1429 consensus superfamily pairs between CATH v3.5.0 and SCOP v1.75, and these are grouped into ‘Bronze Standard’ (532 pairs), ‘Silver Standard’ (527 pairs) and ‘Gold Standard’ (370 pairs) according to their degree of similarity.
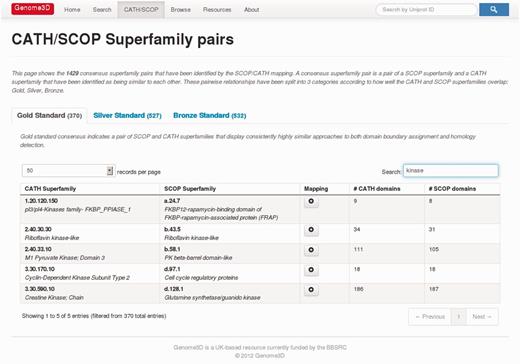
Viewing the Gold Standard consensus pairs on the CATH/SCOP Superfamily Pairs page while searching for ‘kinase’ to restrict the display to superfamilies with that word in their name.
The full details of these categories are beyond the scope of this article and will be described in a future publication but an overview is provided here. A Bronze Standard consensus indicates a pair of SCOP and CATH superfamilies that
are more similar to each other than to any other superfamily.
Such a pair may still involve substantial dissimilarities. A Silver Standard consensus indicates a pair of SCOP and CATH superfamilies that:
meet that Bronze Standard criterion,
each have at least 80% of their domains mapping to the other, without penalization for differences in domains not yet classified and
each have domains that map to domains in the other over an average of at least 80% of their residues.
A Gold Standard consensus indicates a pair of SCOP and CATH superfamilies that:
meet that Bronze Standard criterion,
each have at least 80% of their domains mapping to the other, with penalization for differences in domains not yet classified and
each have domains that map to domains in the other over a minimum of at least 80% of their residues.
The tables presented on the CATH/SCOP Superfamily Pairs page are searchable by superfamily identifier or superfamily name using the Search box at the top right of the table. Figure 3 shows the Gold Standard table displaying only those rows containing the word ‘kinase’. As seen above, the annotations Genome3D provides for B4DXN4 include highly similar domains for the CATH superfamily 1.10.150.50 and the SCOP superfamily a.60.1. Searching in these tables for 1.10.150.50, reveals that this pair is a Silver Standard consensus pair, and clicking on the mapping link gives a page that shows the superfamilies’ domain boundaries on their chains (for a set of chains that is non-redundant according to the section of UniProt sequence they represent).
MATERIALS AND METHODS
SCOP and CATH
The SCOP (6) hierarchy comprises seven levels: protein Species, representing a distinct protein sequence and its variants; Protein, grouping together similar sequences with the same functions that either originate from different biological species or present different isoforms within the same organism; Family, organizing proteins of related sequences but distinct functions; Superfamily, bringing together protein families with common structural and functional features. At the root of the hierarchy, structurally similar superfamilies are grouped into Folds, which are further arranged into Classes based on their secondary structural content.
CATH (7) classifies domains into homologous superfamilies (H) and organizes these according to the fold or topology (T) of the core structure common to the majority of relatives in the superfamily. Fold groups are then organized into architecture levels (A), which reflect the 3D orientation of the supersecondary structures, regardless of their connectivity. Finally, the class (C) of the domain is described, all-α, all-β or α-β. Within each superfamily, relatives are sub-classified into functional families (FunFams) if they share similar structures and functions. CATH also clusters relatives according to sequence similarity (35, 60, 95 and 100% sequence identity). The CATH update protocol uses a combination of automated and manual procedures: structures with very high similarity to structures already present in CATH are automatically chopped into domains and/or assigned to the correct superfamily; all other structures are processed manually using the evidence generated from automatically performed scans.
Predictive resources
The predictive resources involved in the Genome3D collaboration are listed in Table 1 and summarized in the following subsections.
The predictive resources involved in the Genome3D collaboration
| Resource | Principal Investigator | Prediction type | Classification source |
|---|---|---|---|
| DomSerf | Jones | Models | CATH |
| FUGUE | Blundell | Annotations | Both |
| Gene3D | Orengo | Annotations | CATH |
| PDomTHREADER | Jones | Annotations | CATH |
| Phyre | Sternberg | Both | SCOP |
| Superfamily | Gough | Both | SCOP |
DomSerf and pDomTHREADER
DomSerf is a fully automated homology modelling pipeline based on the BioSerf methodology previously developed by the UCL Computer Science Bioinformatics Group (8). DomSerf integrates multiple common tools for protein fold analysis and modelling; including pDomTHREADER (9), PSI-BLAST (10), DomainFinder (11) and MODELLER (12).
The DomSerf process begins by running PSI-BLAST and pDomTHREADER against a library of CATH domain families. Valid homologous matches are selected using conservative cut-offs. The PSI-BLAST step matches sequences against a library of CATH domain sequences. Hits are regarded as homologous only where the PSI-BLAST E-value is ≤5 × 10⁻⁵, and the sequence identity is >40%. Alongside this, pDomTHREADER attempts to match the query sequence against a library of threading templates based on CATH domains. Again, hits are only regarded as homologues given strict cut-offs, where they score in the pDomTHREADER ‘Certain’ and ‘High’ categories and where the match has >40% sequence identity.
All the homologous hits are then compiled to determine the multi-domain architecture (i.e. the sequential domain assignment) of each query sequence. DomainFinder is used (with default settings) to resolve potentially overlapping domains and provide a single multi-domain architecture, per protein, consisting of the highest scoring set of homologous domains identified by pDomTHREADER and PSI-BLAST.
Finally, MODELLER is used (default settings) to build a homology model for each domain identified in every chain, given the alignments, which were produced by either PSI-BLAST or pDomTHREADER.
FUGUE
The FUGUE (13) approach for domain annotation relies on the newly developed TOCCATA database of protein structures (manuscript in preparation). FUGUE makes use of substitution tables specific to the structural environment of residues, such as secondary structure, solvent accessibility and hydrogen bonding, together with structure-dependent gap penalties to identify and score probable homologues using an adaptive global/local dynamic programming algorithm.
The TOCCATA database aims to group all PDB chains classified under CATH version v3.5.0 or SCOP v1.75A for the generation of alignments and FUGUE search profiles, superseding HOMSTRAD (14) as its underlying database. Single domain chains are categorized under their paired SCOP-CATH classifications or whichever one is available. Consensus SCOP-CATH groupings are established whenever all the single domain members from a family (in the case of SCOP) or superfamily (for CATH) are uniquely associated with another one of the counterpart resource. Unassigned proteins on either of the resources are then attached to the resulting paired groupings, if possible. Individual domains of multi-domain proteins are split into their respective groups, although the full chains are also preserved in multi-domain profiles. The structures in each grouping are clustered at different levels of sequence similarity, and a sample of a maximum of 25 representative structures for each grouping, selected by completeness and crystallographic quality, is aligned using the FUGUE in-house program BATON [based on COMPARER (15)]. After enrichment with homologous sequences from the UniProt database using PSI-BLAST, the resulting alignments are used to create FUGUE search profiles. Query sequences are searched against the resulting set of profiles with a modified version of FUGUE, giving the range of the sequence best matched by the significant hits. If the significant hit is part of a paired SCOP-CATH profile, it is then correspondingly split for each resource, leading to FUGUE (SCOP) and FUGUE (CATH) results.
The VIVACE pipeline incorporates the FUGUE procedure as described in its section and follows up by utilising the recognised domains to generate homology models. If likely domains have been detected for more than one region of the sequence by FUGUE, indicating a likely multi-domain structure, a further search is performed against the set of multi-domain profiles containing those domains to identify templates of potentially greater coverage. Non-redundant members of any relevant TOCCATA groups are first screened for percentage identity (PID) and FUGUE substitution score to the target sequence to filter out significantly inferior templates (PID < PID max-20). The best template is determined according to substitution score and the highest quality templates from each non-redundant cluster that are conformationally compatible with it (as judged by a pre-computed RMSD-based clustering) are then pruned to a maximum of five by iteratively discarding the worse of the two most similar ones of the set by sequence identity, with the aim of maintaining some conformational diversity. This final set of templates is aligned with BATON and FUGUE is then used to incorporate the query sequence. The alignment is fed into MODELLER (16) to generate a full-atom model, which is then rated by MODELLER’s internal quality estimators DOPE (17) and GA341 (18), as well as MolProbity (19) and an implementation of predicted/observed secondary structure agreement, in order to assess the confidence of the model.
Gene3D
Gene3D is a database of predicted structural domains based on the CATH protein domain family classification. Domain predictions are provided for most major sequence resources, including UniProt, RefSeq and Ensembl and a search facility is provided for researchers' own sequences. The predicted domains are identified using a sensitive, accurate and fast homologue recognition process (11,20).
The first step of the annotation process is the creation of a library of representative statistical models—profile HMMs—to represent the superfamilies in CATH. Each superfamily is sub-clustered using an automatic process at the 35% sequence identity level and a representative selected. On average, each superfamily contains four representative sequences, though a small number contain many more, whereas many only have a single representative. Each representative is then used to seed an iterative homology search [SAM Target 2K; Karplus et al (21)] against a large non-redundant database to build a profile of related sequences. In each round of the iterative search, newly identified homologues are aligned against the previously identified sequences and used to create a new profile model. At the end of the process, the final alignment is converted to an HMM using the HMMER3 package, and a library created that can be used to accurately recognise highly dissimilar homologues.
The second step of the annotation process deals with searching against the HMMs and resolving the resulting matches into a single non-overlapping set of domain predictions. The HMMER software is also used to carry out the searches and is now extremely fast, comparable in speed with PSI-BLAST while being significantly more sensitive. The database size is set to the size of the HMM library to provide consistent scoring within a release, and an E-value threshold of <0.0001 is used to ensure a low number of false positives in genome-scale searches.
For most proteins, several models will match the sequence, either from different superfamilies or predicting different boundaries for a domain compared with another model. DomainFinder3, an in-house method based on a weighted network representation and maximally weighted clique-finding (22), is used to generate the final predicted domain architecture. Each node in the graph is a match, weighted by the inverse log of the E-value (to create a positive whole number); edges link nodes that conform to the overlap criteria—principally that <30 residues overlap. The maximally weighted clique can be considered to be the combination of matches with the highest combined score, and hence the most likely to be correct. Trivial overlaps are then removed. The entire process can easily be run over large genomes with a modest computer.
Phyre
Phyre (Protein Homology/analogY Recognition Engine) is a web-server for protein structure prediction with >350 submissions per day (http://www.sbg.bio.ic.ac.uk/phyre2/). A detailed description of the methodology may be found in Bennett-Lovsey et al. (23), and a protocol for using the web server and interpreting its output is provided in Kelley and Sternberg (24). Phyre predicts the 3D structure of a protein sequence based on HMM–HMM alignment techniques for remote homology detection. For a given sequence, it detects known homologues based on PSI-BLAST, constructs an HMM of the sequence based on the detected homologues and scans this HMM against a database of HMMs of known protein structures. This database is updated weekly and is based on the SCOP database and latest depositions in the PDB. The top 20 highest scoring matches of the query to known template structures are used to construct 3D models of the query. Insertions and deletions (indels) are modelled using a loop library where possible. Indels of <15 amino acids are scanned against a loop library using profile–profile matching, fitted to the model using cyclic coordinate descent (25) and selected using an empirical energy function. Finally, side chains are modelled using an in-house version of the R3 algorithm (26) coupled to a side-chain rotamer library (27).
In Genome3D, the list of the top 20 matches is converted to a unified annotation along with the corresponding structural models. As all annotations and models in Genome3D are based solely either on SCOP or CATH templates, PDB based matches are discarded. All matches with extremely low confidence (<50%) are also ignored. The post-processed list is traversed in decreasing order of confidence, and non-overlapping templates are added in the annotation using a greedy approach. Matches that have significant overlap (>30 residues or >50% of the length of the smallest template) with previously selected matches are discarded.
Phyre results as presented in the Genome3D portal are not necessarily in agreement with the original results. The unified Phyre-based annotation and models can be partially correct or even blank owing to having mostly or solely PDB-based templates and/or templates of low confidence among the top 20 highest scoring matches. For example, inactive ribonuclease PH (P0CG19) has no annotation according to Phyre in Genome3D, whereas this protein is fully modelled and with 100% confidence by the single highest scoring PDB template in Phyre. For this reason, a link to the original Phyre results is always provided even in absence of annotation in Genome3D.
SUPERFAMILY
The SUPERFAMILY resource (28) provides sequence annotations of domains according to SCOP. Domain annotations are provided at the superfamily and family levels of the hierarchy and applied to >2400 sequenced genomes, >120 meta genomes and other gene collections such as UniProt. The sequence search method uses an automatically generated but partially hand curated library of HMMs representing the 1962 SCOP v1.75 superfamilies (29). Each superfamily is represented by a group of HMMs. Sequences are scanned against the library, using the HMMER3 model-scoring software, to detect domains and classify them at the superfamily level. Overlapping or multiple redundant domain hits to the same sequence are resolved using the SUPERFAMILY domain assignment procedure described in (30). Subsequently domains are sub-classified into their respective families using a hybrid pairwise-profile method (31).
The confidence scores produced by SUPERFAMILY are per-sequence E-values, and only high-confidence predictions are provided to Genome3D, with an threshold of E < 0.0001, although higher coverage (lower confidence) predictions can be explored via the SUPERFAMILY website. A byproduct of the hybrid sub-family classification procedure (above) is the allocation to each domain of the best structural template. The 3D structural models for Genome3D are created by using the HMM alignment of the sequence to the best template, and then resolved using MODELLER (12). In addition to annotations in connection with Genome3D SUPERFAMILY also provides the following additional services/products: a fully resolved species tree of sequenced organisms; reconstructed ancestral genomes for eukaryotes; domain-centric Gene Ontology and 14 other ontologies, including disease/phenotype/anatomy/pathway/drug, multiple sequence alignments, comparative genomics tools, coiled-coil annotation of all genomes (32) and predicted regions of intrinsic disorder in genomes.
IMPLEMENTATION
The implementation of Genome3D involves a wide spectrum of technologies. Structural models are submitted as PDB files with pre-agreed tags providing additional meta-data. Structural annotations are submitted in InterPro XML format (www.ebi.ac.uk/schema/interpro/interpro-5.0.xsd).
The data are loaded into a PostgreSQL database, and this is supplemented via data extracted from an Oracle database using Ora2Pg. The code is written and tested in ‘Modern’ Perl, particularly using the Moose postmodern object system, the Catalyst web application framework and the DBIx::Class flexible object-relational database mapper.
The site’s resources are laid out with a RESTful API, and this is also used to serve JSON data to AJAX-style Javascript calls from the pages. The visualization of the pages is handled with the help of the Bootstrap front-end framework, which provides a consistent and responsive look and feel across a range of browsers and display sizes from hand-held devices to desktop monitors. The domain-drawing code is heavily influenced by InterPro’s elegant approach using only HTML and CSS.
The web server is implemented as a virtual machine configured using the Puppet open-source configuration management tool. The Varnish web application accelerator is used to cache page loads.
CONCLUSION
Genome3D is an exciting new resource that harnesses the world-leading expertise of UK-based protein structure resources.
By using insights only available through knowledge of protein structure, it provides biologists with a unique perspective into target sequences. By collating data from these complementary resources into a single portal, it offers a broader perspective on the context of each prediction and acts as a gateway to each resource. The unique value of Genome3D is the integration of major domain structure resources in a single portal, which allows users to contrast predictions and identify those regions more likely to be accurately predicted because multiple resources agree. Genome3D is complementary to InterPro, another portal displaying integrated protein family data, because InterPro concentrates mainly on sequence data whereas Genome3D provides predicted structural annotations and 3D models.
Genome3D has also conducted an analysis of the similarities and differences between the SCOP and CATH structural classifications. This has identified a set of 1429 consensus superfamily pairs between the two resources, categorized into bronze, silver and gold standard according to each pair’s degree of similarity.
Areas of development for Genome3D in the near future are likely to include:
Including and displaying data from other sources, such as InterPro
Extending coverage to other genomes and
Extending the analysis of the similarities between SCOP and CATH
FUNDING
This project has been funded with federal funds (in part) from the National Institute of Allergy and Infectious Diseases, National Institutes of Health, Department of Health and Human Services [HHSN272201200026C]; BBSRC (to A.C., I.F., T.E.L., F.M., B.O-M., O.J.L.R., J.S.); Wellcome Trust (to I.S.); NIH (to C.Y.). Funding for open access charge: BBSRC.
Conflict of interest statement. None declared.
ACKNOWLEDGEMENTS
The authors wish to gratefully thank the Biotechnology and Biological Sciences Research Council (BBSRC) and the Wellcome Trust for funding this resource and InterPro for their help in developing our domain-drawing display tool.
REFERENCES
Author notes
The authors wish it to be known that, in their opinion, the first two authors should be regarded as joint First Authors.

Comments