


Abstract
Conventional approaches to target labelling for expression microarray analysis typically require relatively large amounts of total RNA, a serious limitation when the sample available is small. Here we explore the cycle‐dependent amplification characteristics of Template‐Switching PCR and validate its use for microarray target labelling. TS‐PCR identifies up to 80% of the differentially expressed genes identified by direct labelling using 30‐fold less input RNA for the amplification, with the equivalent of 1000‐fold less starting material being used for each hybridisation. Moreover, the sensitivity of microarray experiments is increased considerably, allowing the identification of differentially expressed transcripts below the level of detection using targets prepared by direct labelling. We have also validated the fidelity of amplification and show that the amplified material faithfully represents the starting mRNA population. This method outperforms conventional labelling strategies, not only in terms of sensitivity and the identification of differentially expressed genes, but it is also faster and less labour intensive than other amplification protocols.
Received as resubmission July 29, 2003; Revised August 22, 2003;. Accepted September 24, 2003
INTRODUCTION
Microarray technology is delivering profound insights into numerous biological processes. Conventional target labelling protocols however, need relatively large amounts (>20 µg) of input total RNA per hybridisation. The need for replicate hybridisations increases the demand for RNA further still. In circumstances where the sample available is limited, such as in the case of clinically derived material or the need to focus the analysis on specific cell populations, there is often too little RNA available to perform the analysis using conventional labelling strategies.
In order to circumvent this issue, a significant amount of effort has been focused on approaches to reduce the RNA requirement per hybridisation through the use of either signal or RNA amplification technologies. Various approaches to signal amplification have been described and in some cases have brought down the requirement for RNA by as much as 10‐fold ( 1 – 5 ), but these protocols are problematic and expensive to perform. Furthermore, even with this improvement, the amounts of RNA required are still often unobtainable. With respect to RNA amplification strategies, T7 polymerase in vitro transcription (IVT) is currently the most commonly used and well documented amplification protocol ( 6 ). Although successful in significantly reducing RNA requirements, IVT‐based amplification procedures have several notable shortcomings. Protocols are time‐consuming, labour‐intensive and costly. Moreover, if RNA is very limiting, consecutive rounds of IVT amplification are required to generate sufficient material for hybridisation ( 7 , 8 ), which further adds to the complexity of the procedure and reduces the linearity of the amplification.
PCR has a number of potential advantages; it is faster, more cost effective and offers an almost unlimited degree of amplification. A number of variations on PCR labelling have been described ( 9 – 12 ), including those using template switching PCR (TS‐PCR) ( 13 , 14 ), commercialised by Clontech in their SMART PCR cDNA synthesis kit ( 15 – 17 ). While these studies demonstrated the potential of the approach, they focused little attention on the relationship between the degree of amplification and the fidelity of the amplified material with respect to the starting mRNA population. It has however been these very understandable concerns about the faithfulness of PCR amplification that have held back the widespread adoption of the approach by the microarray community. We therefore set out to perform the first in depth examination of the potential for TS‐PCR to generate high fidelity labelled target for expression microarray analysis.
MATERIALS AND METHODS
Construction of spotted oligonucleotide arrays
Oligonucleotide probes (60mers; Sigma‐Genosys) representing 9332 human sequence clusters were rearrayed into 384‐well plates at a concentration of 200 ng/µl, and spotted onto Surmodic 3‐D link slides (Motorola) using a MicroGrid TAS arrayer ( Bio Robotics). Control oligonucleotides (50mers) representing ubiquitously expressed or tissue‐specific genes, as well as bacterial spike sequences, were also incorporated onto the array. Following printing, slides were processed according to the manufacturer’s protocol.
Cell culture, RNA isolation and quality assessment
This study employed three distinct human cell lines, two of glioma origin, T98G and U118, and one of breast cancer origin, SKOU3. All cell lines were cultured in F12 medium containing 10% FCS (Gibco‐BRL). When 80% confluent, the cultures were harvested, pelleted and washed with PBS. RNA was extracted using guanidine isothiocyanate ultracentrifugation as described previously ( 18 ). RNA concentration and integrity were assessed spectrophotometrically and on an Agilent Bioanalyzer 2100.
Preparation of directly labelled cDNA targets
Directly labelled cDNA targets were prepared as follows. 300 pmol of oligo(dT) 17 V primer were mixed with 30 µg of total RNA in a final volume of 15.4 µl. The reaction mixture was incubated at 70°C for 10 min, quenched on ice for 2 min and then 14.6 µl of labelling mix [1× first strand cDNA synthesis buffer (Invitrogen), 10 mM DTT, 0.5 mM each of dATP, dGTP and dTTP, 0.2 mM dCTP, 3 µl Cy3‐ or Cy5‐dCTP (Amersham Pharmacia Biotech) and 2 µl Superscript II (Invitrogen)] were added and the reaction incubated at 42°C for 2 h in the dark. Labelled cDNA was purified on an AutoSeq G‐50 column (Amersham Pharmacia Biotech); the Cy5 and Cy3 samples were then pooled and precipitated with EtOH.
Preparation of amplified labelled cDNA targets
TS‐PCR amplified ds cDNA was prepared using the SMART cDNA synthesis kit (BD Clontech) as follows. Total RNA (1000–50 ng) was mixed with 10 pmol 3′ SMART CDS primer IIA (5′‐AAGCAGTGGTATCAACGCAGAGTACT 30 VN‐3′) and 10 pmol template switching primer [5′‐d(AAGCAGTGGTATCAACGCAGAGTACGC)r(GGG)‐3′] in a volume of 5 µl; the reaction mixture was incubated at 70°C for 2 min and then quenched on ice for 2 min. The following reagents were then added, 2 µl 5× first strand buffer, 1 µl 20 mM DTT, 1 µl 10 mM dNTPs and 1 µl PowerScript RT, and the reaction incubated at 42°C for 1 h. A 2 µl aliquot of the first strand cDNA was then used as template for the second strand amplification reaction. The following reagents were added, 80 µl dH 2 O, 10 µl 10× Advantage 2 PCR Buffer (BD Clontech), 2 µl 10 mM dNTPs, 4 µl PCR primer (5′‐AAGCAGTGGTATCAACGCAGAGT‐3′) and 2 µl 50× Advantage 2 polymerase mix and the reaction mixture was subjected to the following cycling programme, 95°C for 1 min and then a variable number of cycles (5–21) of 95°C for 5 s, 65°C for 5 s and 68°C for 6 min. Labelled target was prepared as follows: 21 µl of ds cDNA was mixed with 20 µl of 2.5× random prime reaction buffer (Invitrogen), incubated at 100°C for 5 min and placed on ice. The following reagents were added, 5 µl of Low‐C dNTP mix (5 mM dATP, 5 mM dGTP, 5 mM dTTP, 2 mM dCTP), 3 µl Cy3 or Cy5‐dCTP (Amersham) and 40 U Klenow polymerase and the reaction incubated at 37°C for 2 h in the dark. The reaction was terminated with the addition of 5 µl stop buffer (Invitrogen) and the labelled products were purified as described for the directly labelled targets above.
Spotted oligonucleotide microarray hybridisation and scanning
For each set of conditions tested, triplicate hybridisations were performed. These included a dye‐swap hybridisation, which was always performed in the same dye direction. Labelled targets were resuspended in 35 µl of hybridisation buffer (40% formamide, 5× SSC, 5× Denhardt’s solution, 1 mM sodium pyrophosphate, 50 mM Tris pH 7.4, 0.1% SDS), denatured at 95°C for 5 min, incubated at 50°C for 5 min and then centrifuged at 13 000 r.p.m. for 5 min before being applied to an array. Hybridisations were performed under a coverslip at 50°C in a humidified oven for 16 h. Following hybridisation, slides were washed twice in 2× SSC for 10 min, twice in 0.1× SSC/0.1% SDS for 5 min and finally twice in 0.1× SSC for 5 min; all washes were performed at RT. After washing, slides were dried by centrifugation at 1000 r.p.m. for 2 min, and then scanned on an Agilent G256B scanner. Raw image data were extracted using Imagene Version 5.0 software (BioDiscovery).
Validation of TS‐PCR amplification using Affymetrix Genechip technology
T98G and U118 cell line total RNA (7 µg) were used to synthesise biotin‐labelled cRNA, which were then each hybridised onto Affymetrix HG‐U133A arrays according to the manufacturer’s instructions. Following hybridisation and washing, the arrays were scanned using a GeneArray scanner (Agilent Technologies). Data analysis was performed using Microarray Analysis Suite (MAS) Version 5.0 software (Affymetrix).
Data analysis
Features whose mean signal intensity was less than four times the standard deviation of the local background pixel intensity were automatically flagged in Imagene. Manual flagging was also used to remove irregularities such as scratches and dust particles. Data were imported into GeneSpring 5.0 (Silicon Genetics) for analysis. Normalisation was performed using the Loess algorithm. Unless otherwise stated, only genes with data in all three replicates of all conditions examined were used (‘present’). Genes with no data above background data in any of the three replicates for each condition were called ‘absent’. Identification of genes with ratios statistically significantly different from 1 was performed using a t ‐test at the 95% confidence level.
For assessment of the effects of amplification on the representation of transcripts of different lengths, transcript lengths corresponding to each feature on our array were queried against the EMBL and REFSEQ databases using the program Infoseq. This program is part of the freely available open source software package, European Molecular Biology Open Software Suite (EMBOSS, http://www.hgmp.mrc.ac.uk/Software/EMBOSS ). All data will be made available on the HGMP Microarray website and through ArrayExpress.
RESULTS
General amplification characteristics of TS‐PCR
Experiments were designed to examine the amplification characteristics of TS‐PCR ( 13 , 14 ), in comparison to direct labelling of RNA using reverse transcriptase, by microarray analysis of labelled cDNA generated by these approaches. For all assays described here, 1 µg of total RNA was used for first strand synthesis. This represents an amount of RNA obtainable in the majority of studies and under the conditions described here is sufficient to generate enough labelled cDNA for a minimum of 20 hybridisations. However, the technique can also be used with lower amounts of input RNA and has been employed successfully with as little as 50 ng total RNA (data not shown). The entire protocol, from RNA to hybridisation, can be performed in a single day and is readily compatible with high throughput plate formats.
TS cDNA synthesis was initially designed as a method maximising full‐length transcript representation in cDNA library construction ( 13 , 19 ). Electrophoretic characterisation of TS‐PCR generated cDNA showed detectable transcript sizes ranging from 0.2 to 7 kb (Fig. 1 A). This is as expected for mammalian full‐length cDNA and is in agreement with previously published observations ( 13 , 17 , 20 ).
Effect of cycle number on representation of amplified cDNA
Total T98G and U118 glioma cell line RNA (1 µg) was reverse transcribed and aliquots of first strand cDNA were amplified through 13, 15, 17, 19 or 21 cycles of long distance PCR. Spectrophotometric assessment of the overall mass of the amplified material at different cycle numbers indicated that amplification was exponential up to 17 PCR cycles, with the mass of amplified material plateauing after 19 cycles. Similar findings have also been found by analysis of a number of individual transcripts by quantitative PCR on amplified material (data not shown).
To test the fidelity of amplification, we sought to validate TS‐PCR using high‐density oligonucleotide microarrays. Experiments were designed to investigate whether expression differences identified by conventional direct labelling of RNA (‘true differentials’) were maintained with hybridisations using Klenow‐labelled TS‐PCR amplified cDNA. Initially, T98G and U118 cell line RNAs were used. Both are glioma‐derived adherent cell lines with very similar genomic aberrations (K.Ichimura, personal communication). All hybridisations were performed in triplicate and included a dye‐reversal hybridisation. In all cases the dye reversal was in the same orientation for each experiment. Qualitatively, hybridisations using labelled TS‐PCR products were characterised by higher signal intensities in both channels, which directly correlates with the increased mass of cDNA available for labelling, particularly at higher cycle numbers (Fig. 2 A). Associated with this is an increase in the number of features with an observed signal above background (Fig. 2 B). Moreover, correlation coefficients between replicate hybridisations were seen to increase with amplification number (Fig. 2 C). Direct labelling demonstrated the poorest correlation between replicate hybridisations (Fig. 2 C). For statistical analyses, only genes present in all three replicates of all direct labelling and amplified target hybridisations were used. The percentage of differentially expressed genes identified by direct labelling that were also identified by TS‐PCR hybridisations was seen to increase with cycle number, reaching a maximum (76%) after 19 cycles, then falling off (Fig. 2 D, Table 1 ).
Log ratio values of the genes identified as being significantly differentially expressed between samples decreased with amplification cycle number (data not shown). Principal component analysis (PCA) corroborated these results (Fig. 2 E). Compression effects of PCR amplification on log ratios have been observed previously ( 10 ).
An additional set of hybridisations was performed comparing T98G glioma versus SKOU3 breast cancer cell line RNAs (Fig. 3 ). As with the T98G versus U118 experiment, TS‐PCR consistently produced more reproducible data, with less noise and higher signal intensities than direct labelling (Fig. 3 ). The ‘true’ differential identification success for the amplified target was comparable using these more distinct RNA samples, with 80% of direct labelling differentials being successfully identified by 15 cycle amplified material compared to 71% in the U118 versus T98G experiment at the same cycle number.
This study (Fig. 1 A) and those by others ( 13 ) have suggested that TS‐PCR generates high molecular weight transcripts. We wished to corroborate the effect of amplification on the representation of genes with different transcript lengths in the microarray data. The genes represented on the oligonucleotide array were categorised according to their transcript length. For both direct labelling and TS‐PCR, the percentage of total genes that fell into each transcript length category remained remarkably constant demonstrating no bias towards the amplification of short transcripts (Fig. 1 B).
A number of genes were seen as being discordant between hybridisations using amplified and non‐amplified cDNA preparations. Some genes were consistently above background in TS‐PCR but found to be absent in direct labelling hybridisations. The number of TS‐PCR‐specific genes above background was seen to increase with cycle number (Fig. 2 B). In both the T98G versus U118 and T98G versus SKOU3 hybridisations, genes that were present only in hybridisations using TS‐PCR amplified material were almost entirely clustered at the low intensity, high variance end of the data in the direct incorporation dataset. This observation is consistent with increased assay sensitivity with amplification.
In addition, a number of genes were identified as being differentially expressed only in hybridisations performed using TS‐PCR amplified cDNA and not in direct labelling hybridisations. In the majority of these cases, while the discordant gene set failed to reach statistical significance in directly labelled hybridisations, its expression pattern showed a trend in the correct direction, that is genes found to be up‐regulated by TS‐PCR have ratios >1 by direct labelling and vice versa (data not shown).
In an attempt to validate genes that were identified as differentially expressed in TS‐PCR but not direct labelling hybridisations, the expression profiles of T98G and U118 total RNA were also assessed using Affymetrix HG‐U133A GeneChips (Table 1 ). Of those genes found to be differentially expressed only by TS‐PCR, approximately 70% showed concordance in the direction of differential expression in the Affymetrix dataset (Table 1 ).
DISCUSSION
Amplification strategies represent the most promising approach currently being pursued to reduce the microgram quantities of RNA required to perform a single microarray hybridisation. At present, the most commonly used amplification method is IVT ( 6 ). This method uses T7 RNA polymerase amplification where quantitative biases within the amplified RNA population are generally accepted to be kept within an acceptable range. However, the protocol does have a number of drawbacks: it is time consuming, labour intensive and costly. In addition, a single round of amplification is not usually sufficient when dealing with sub‐microgram quantities of RNA. Another feature of IVT is a shortening of the amplified cRNA compared to the parent mRNA population, and this 3′ bias is further accentuated by multiple rounds of IVT ( 7 , 21 ).
Other proposed amplification protocols utilise PCR‐based exponential amplification ( 9 – 12 , 15 ). The widespread adoption of such protocols has been held back by the concern that the exponential nature of the PCR step will introduce a serious representational bias into the amplified material and thereby prevent quantitative analyses. Balanced against this question of linearity are the potential advantages PCR‐based methods might offer over IVT‐based amplification protocols, namely speed, ease of use and applicability to high‐throughput situations. One PCR‐based amplification method that has been used to generate labelled targets for microarray analyses is TS‐PCR ( 15 – 17 ). However, none of these studies has systematically addressed the relationship between degree of amplification and the fidelity of the amplified cDNA.
In the present study, we have used a two‐colour high density oligonucleotide microarray platform to examine this crucial question. Spectrophotometric and electrophoretic assessment of the amplified cDNA product indicates that, under the conditions described here, the amplification process is exponential up to 17 cycles and generates products with a size distribution between 0.2 and 7 kb. In addition, the distribution of transcript sizes identified by microarray analysis reveals no evidence that amplification favours the detection of shorter transcripts even at high cycle numbers. Therefore, in contrast to IVT methods, 5′ representation is likely to be good in the TS‐PCR amplified cDNA allowing much greater flexibility when designing array probes for the detection of alternative splice variants.
From a qualitative perspective, arrays performed using amplified targets were consistently brighter than those hybridised with directly labelled targets. Quantitatively this is reflected in an increase in the number of features called present. Indeed, there is a strong correlation between fold amplification and the number of features called present, at least across the exponential phase of the reaction. This is almost certainly due to the increased mass of cDNA produced by PCR that is available for labelling. A significant proportion of total cellular mRNA is comprised of low abundance transcripts ( 22 ), the majority of which are expressed at levels below the sensitivity of current direct labelling protocols. The increased sensitivity offered by TS‐PCR amplification brings this pool of RNAs into the detection range of microarray technology. In disagreement with Puskas et al. ( 16 ), we observed a much better correlation between replicate arrays hybridised with amplified targets compared to those hybridised with direct labelled targets. The correlation between replicates increases with the degree of amplification; this increased precision most probably reflects the increase in signal intensities seen with increasing degrees of amplification. One difference between the protocol described here and that of Puskas et al., is that they used Taq polymerase to label their PCR products whereas we used random primed Klenow labelling. In our experience, Taq polymerase gives much poorer incorporation of Cy dyes, resulting in much weaker signal intensities and as a result higher inter‐array variability.
An examination of differentially expressed genes revealed a high concordance between those identified using amplified and unamplified targets, indicating that relative transcript abundance is preserved during amplification. The level of concordance between genes identified as differentially expressed reported in the present study is in good agreement with those reported previously for both IVT and other PCR‐based amplification protocols ( 10 , 16 , 23 ). Greater concordance was observed with increasing cycle number, which most likely reflects the decreased variance between replicates associated with increased signal intensity. Analysis of the set of genes only identified as differentially expressed using direct labelling revealed no correlation with signal intensity, transcript length or failure to amplify. In fact, no gene identified as present using directly labelled targets was consistently absent in hybridisations performed with amplified targets. In contrast, the tighter replicate data generated with amplified targets provides a good explanation for genes only identified as differentially expressed using amplified targets. Amplified targets demonstrate a compression in the ratio values of differentially expressed genes, a feature that has been reported previously for exponentially amplified targets ( 10 ). Compression, however, does not affect the ability to identify differentially expressed genes. It is associated with lower variance between replicates and as a consequence improved statistical resolution of differentials. Indeed, as shown in Figure 2 , cycle numbers at which the observed compression was greatest showed the highest rates of ‘true’ differential identification.
TS‐PCR is both the fastest (RNA to hybridisation performed easily within a day) and lowest cycle number PCR amplification protocol described to date. It is entirely 96‐well compatible and bypasses the requirement for complex enzymatic steps, lengthy incubations and laborious purifications. Furthermore, each amplification generates a cDNA library for every sample processed, providing a resource for future hybridisations and/or quantitative PCR validation. In contrast to other PCR protocols ( 10 ) and IVT amplification methods ( 23 ), this method is capable of producing high molecular weight transcripts that allow the design of microarray probes complementary to sequences distal to their 3′ end.
The development of better labelling strategies is essential to unlock the power of microarray technology for studies where sample is limiting. This is crucial when using clinically derived samples, purified cell populations, microdissected material and single cells. These data suggest that whilst exponential amplification using TS‐PCR affects relative transcript abundances, these effects are minimal over a wide range of PCR cycles and do not inhibit the ability to identify differentially expressed genes. Furthermore, enhanced signal intensities generate data that is significantly more reproducible and allow sampling of genes whose expression is below the sensitivity of direct labelling protocols. We suggest TS‐PCR offers an economical, reproducible and robust alternative to other labelling technologies and recommend its use for microarray target preparation.
ACKNOWLEDGEMENTS
P.A.L. is funded by a joint grant from the Wellcome Trust and the Juvenile Diabetes Research Foundation. T.C.F. is funded by the Medical Research Council. T.C.F. and P.A.L. jointly directed this study.
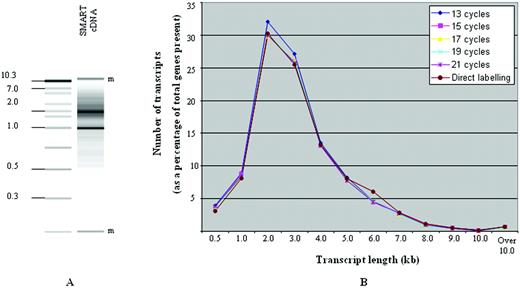
Figure 1. ( A ) Electrophoretic assessment of T98G cDNA, produced by 13 cycles of TS‐PCR. Ladder sizes shown in kb. Bands designated ‘m’ correspond to markers introduced into the assay. ( B ) Effect of transcript length on efficiency of amplification. Transcripts were grouped into 12 categories by length, ranging from 0.5 to over 10 kb. For each SMART cycle and for direct labelling, the number of genes in each transcript category was expressed as a percentage of the total number of genes present.
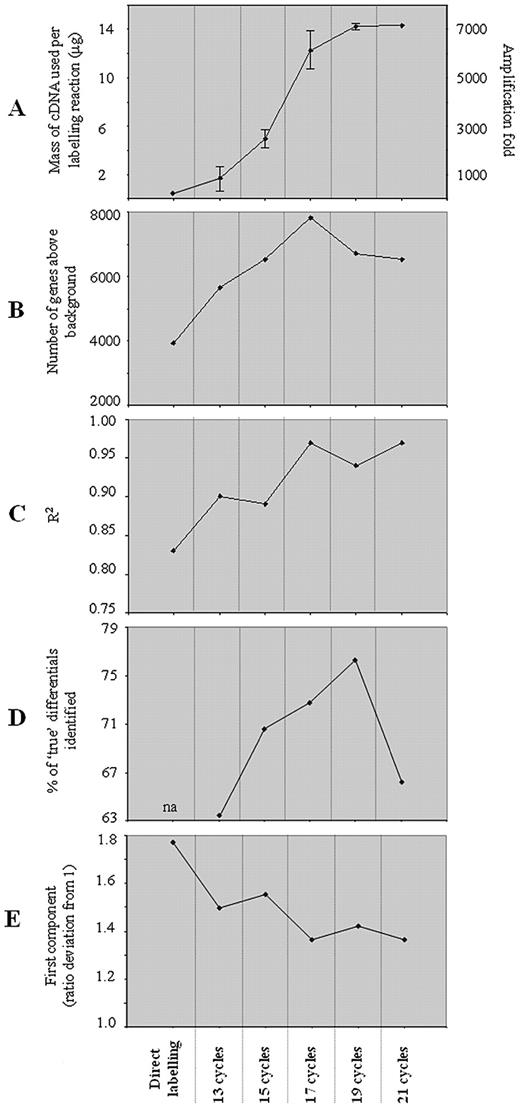
Figure 2. Summary of trends across amplification cycle number. ( A ) Mass of cDNA used per labelling reaction. Means from two distinct amplifications shown. For comparison, the theoretical maximum mass of cDNA produced by reverse transcription of 30 µg of total RNA is also shown. The value was calculated assuming 100% efficiency of the reverse transcription reaction. Amplification‐fold and direct labelling cDNA mass estimation were calculated assuming mRNA as 1% of total RNA used. ( B ) Number of genes consistently above background in all three replicate hybridisations performed per condition. ( C ) Correlation coefficients between replicate hybridisations. Genes with replicate signal intensities that were less than 5‐fold apart were used. This removed 44 genes (from 3925 in total) from direct labelling and none from the SMART amplified replicate sets. ( D ) Percent of direct labelling (‘true’) differentials successfully identified by hybridisations using SMART amplified cDNA. ( E ) Plot of the first principal component of the entire dataset. All genes present in any of the replicate hybridisations using SMART and direct labelling were included in the analysis. The pattern defined by the first principal component reflects genes whose ratio values converge towards one with increasing amplification cycle number.
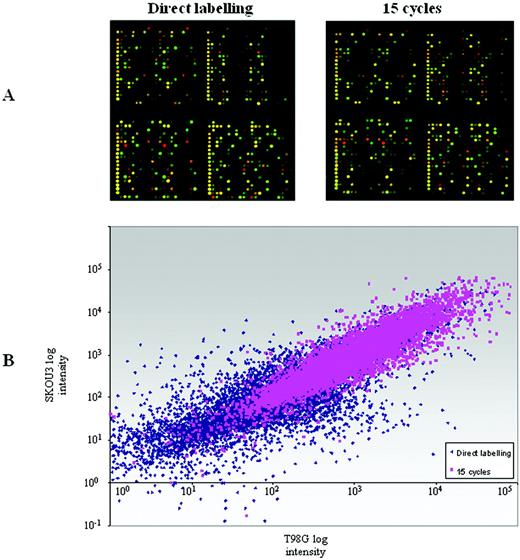
Figure 3. ( A ) T98G versus SKOU3 hybridisations. Detail from an array hybridised with direct labelled cDNA using 30 µg of starting total RNA per colour (left) and from the same section of an array hybridised with amplified cDNA after 15 cycles of PCR using the equivalent of 40 ng total RNA per colour (right). ( B ) Superimposition of log intensity scatter‐plots from T98G versus SKOU3 hybridisations generated by direct labelling (blue scatter) and 15 cycle PCR amplified cDNA (pink scatter) target preparations. Mean intensity values derived from three separate hybridisations are shown. Only genes with negative background‐subtracted intensity values were excluded from the plot.
Assessment of differentials identified by TS‐PCR as compared with direct incorporation and Affymetrix GeneChip
| No. of differentials a | Overlap (%) b | Unique to TS‐PCR c | Present on U133 d | Differential on U133 e | ||
| Up‐regulated | Down‐regulated | |||||
| Direct labelling | 393 | – | – | – | – | – |
| 13 cycles | 684 | 249 (63.4) | 435 | 260 | 68.4 | 67.1 |
| 15 cycles | 775 | 278 (70.7) | 497 | 294 | 67.8 | 68.9 |
| 17 cycles | 906 | 286 (72.8) | 620 | 367 | 66.7 | 69.0 |
| 19 cycles | 1011 | 300 (76.3) | 711 | 409 | 65.9 | 67.6 |
| 21 cycles | 800 | 260 (66.2) | 530 | 307 | 70.4 | 69.1 |
a Total no. of differentials identified by each protocol/cycle number.
b Overlap between direct incorporation and TS‐PCR differential data sets.
c Differentials unique to TS‐PCR.
d Number of unique TS‐PCR differentials represented on Affymetrix HG‐U133A chip and called present by MAS 5 software.
e Percent concordance in direction of differential expression between genes found to be differentially expressed by TS‐PCR and represented and present on Affymetrix HG‐U133A chips.
References
Karsten,S.L., Van Deerlin,V.M., Sabatti,C., Gill,L.H. and Geschwind,D.H. (
Nallur,G., Luo,C., Fang,L., Cooley,S., Dave,V., Lambert,J., Kukanskis,K., Kingsmore,S., Lasken,R. and Schweitzer,B. (
Salin,H., Vujasinovic,T., Mazurie,A., Maitrejean,S., Menini,C., Mallet,J. and Dumas,S. (
Stears,R.L., Getts,R.C. and Gullans,S.R. (
Yu,J., Othman,M.I., Farjo,R., Zareparsi,S., MacNee,S.P., Yoshida,S. and Swaroop,A. (
VanGelder,R.N., von Zastrow,M.E., Yool,A., Dement,W.C., Barchas,J.D. and Eberwine,J.H. (
Baugh,L.R., Hill,A.A., Brown,E.L. and Hunter,C.P. (
Baugh,L.R., Hill,A.A., Slonim,D.K., Brown,E.L. and Hunter,C.P. (
Makrigiorgos,G.M., Chakrabarti,S., Zhang,Y., Kaur,M. and Price,B.D. (
Iscove,N.N., Barbara,M., Gu,M., Gibson,M., Modi,C. and Winegarden,N. (
Aoyagi,K., Tatsuta,T., Nishigaki,M., Akimoto,S., Tanabe,C., Omoto,Y., Hayashi,S., Sakamoto,H., Sakamoto,M., Yoshida,T. et al. (
Smith,L., Underhill,P., Pritchard,C., Tymowska‐Lalanne,Z., Abdul‐Hussein,S., Hilton,H., Winchester,L., Williams,D., Freeman,T., Webb,S. et al. (
Chenchik,A., Zhu,Y.Y., Diatchenko,L., Li,R., Hill,J. and Siebert,P.D. (
Matz,M., Shagin,D., Bogdanova,E., Britanova,O., Lukyanov,S., Diatchenko,L. and Chenchik,A. (
Wang,E., Miller,L.D., Ohnmacht,G.A., Liu,E.T. and Marincola,F.M. (
Puskas,L.G., Zvara,A., Hackler,L.,Jr and Van Hummelen,P. (
Seth,D., Gorrell,M.D., McGuinness,P.H., Leo,M.A., Lieber,C.S., McCaughan,G.W. and Haber,P.S. (
Ekstrand,A.J., James,C.D., Cavenee,W.K., Seliger,B., Pettersson,R.F. and Collins,V.P. (
Endege,W.O., Steinmann,K.E., Boardman,L.A., Thibodeau,S.N. and Schlegel,R. (
Zhao,H., Hastie,T., Whitfield,M.L., Borresen‐Dale,A.L. and Jeffrey,S.S. (
McClintick,J.N., Jerome,R.E., Nicholson,C.R., Crabb,D.W. and Edenberg,H.J. (
Soares,M.B., Bonaldo,M.F., Jelene,P., Su,L., Lawton,L. and Efstratiadis,A. (

Comments