-
PDF
- Split View
-
Views
-
Cite
Cite
Tara McMorrow, Michelle M. Gaffney, Craig Slattery, Eric Campbell, Michael P. Ryan, Cyclosporine A induced epithelial–mesenchymal transition in human renal proximal tubular epithelial cells, Nephrology Dialysis Transplantation, Volume 20, Issue 10, October 2005, Pages 2215–2225, https://doi.org/10.1093/ndt/gfh967
Close - Share Icon Share
Abstract
Background. Tubulointerstitial fibrosis is a relatively common and sinister complication of cyclosporine A (CsA) therapy that limits its clinical use. CsA may have direct effects on renal tubular epithelial cells by promoting epithelial–mesenchymal transition (EMT). EMT plays an important role in embryonic development and tumourigenesis and has been described in organ remodelling during fibrogenesis. In this study, we investigated the effects of CsA on a human renal cell line as a model system to test the hypothesis that CsA can induce renal EMT.
Methods. Human renal proximal tubular cells were treated with CsA (0.42–42 µm) for periods up to 72 h. Viability was assessed by the Alamar Blue assay. Morphological changes were assessed by phase contrast microscopy. The effects on epithelial adherens molecule, β-catenin and stress fibre protein, F-actin were analysed by indirect immunofluorescence. Reverse transcription––polymerse chain reaction was performed to measure the mRNA levels of extracellular matrix components. Expression of transforming growth factor-β was measured by western blotting. Expression and activity of matrix metalloproteinases were measured by gelatin zymography.
Results. CsA induced striking morphological changes in epithelial cells, including changes in cellular morphology, F-actin stress fibre formation, delocalization of the adherens junction protein β-catenin and increased levels of collagen IV and fibronectin. In addition, CsA-induced EMT was associated with increased TGF-β1 protein levels and EMT was markedly attenuated in the presence of anti-TGF-β1 antibody. CsA-induced EMT was also associated with increased expression of connective tissue growth factor (CTGF) suggesting that this molecule may serve as downstream mediator of TGF-β1 pro-fibrotic activity in this setting.
Conclusions. In aggregate, these data suggest that CsA is a direct stimulus for EMT in renal tubule epithelial cells and implicate TGF-β1 and CTGF as mediators of this response. The further delineation of the molecular components of this pro-fibrogenic response may suggest novel strategies through which to prevent CsA-induced tubulo-interstitial fibrosis in vivo.
Introduction
Cyclosporine A (CsA) is one of the most important immunosuppressive drugs widely used in transplantation and is increasingly being introduced for the treatment of autoimmune diseases such as psoriasis and rheumatoid arthritis. However, use of CsA is limited by nephrotoxicity which can lead to end-stage renal disease [1]. This nephrotoxicity is mainly characterized by tubulo-interstitial fibrosis and tubular atrophy. Tubulo-interstitial fibrosis is a pathological hallmark of end-stage renal disease in humans and experimental animal models. Many investigators have attempted to elucidate the mechanisms of chronic renal fibrosis induced by CsA and while CsA-induced vasoconstriction and tissue hypoxia has been implicated as an important event in the pathogenesis of CsA-induced tubulo-interstitial fibrosis, there is accumulating evidence that CsA may direct toxic effects on renal cells [2]. Recent work in our laboratory has indicated novel signalling mechanisms for CsA via the extracellular signal-regulated protein kinase mitogen activated protein kinase pathway [3]. This is the first demonstration of this signalling pathway for CsA in renal cells and may explain the basis of direct cell effects by CsA. Understanding the molecular mechanisms of CsA-induced renal damage and its role in the initiation of fibrosis should provide novel therapeutic strategies for the amelioration of the decline in renal function observed in patients with renal fibrosis.
Regardless of the initial cause, renal fibrosis is characterized by interstitial fibroblast activation that is believed to play a central role in the pathogenesis of renal interstitial fibrosis. Although the exact origins of these myofibroblasts remain uncertain, emerging evidence suggests that they may be derived from tubular epithelial cells by an epithelial-to-mesenchymal transition (EMT) process under pathological conditions [4]. Thus it is proposed that the nephrotoxic side effects of CsA may be in part due to induction of EMT [5], possibly through CsA induced up-regulation of TGF-β1 [6,7]. Connective tissue growth factor (CTGF) is a downstream effector of TGF-β and may provide another target for therapy aimed at prevention of CsA-induced nephrotoxicity [8].
In this study the ability of CsA to induce EMT in a human proximal tubular cell line and the possible signalling molecules involved, were investigated. We investigated the effect of CsA treatment on the expression of extracellular matrix (ECM) components (fibronectin and collagen IV), matrix metalloproteinases (MMPs) and tissue inhibitors of matrix metalloproteinases (TIMPs) in the HK-2 cell line. The involvement of TGF-β in the regulation of ECM proteins, the induction of EMT and the downstream activation of CTGF was analysed using TGF-β neutralizing antibodies.
Subjects and methods
Materials
Cyclosporine was a gift from Novartis Pharmaceuticals (Ireland). Antibodies for β-catenin were obtained from Santa Cruz Biotechnology (UK). Rhodamine phalloidin, obtained from Molecular Probes, was used to stain F-actin fibres. The nuclear stain, DAPI, was obtained from Sigma (UK). Neutralizing antibody to TGF-β1 was purchased from R&D systems (UK). PCR primers were supplied by Sigma-Genosys (UK). Dulbecco's Modified Eagle's Medium/Nutrient Mix F12 (DMEM/F12) was obtained from Gibco BRL Ltd (UK). Cell culture dishes and slides were purchased from Falcon (UK).
Cell culture
The experiments were carried out using a human renal proximal tubular epithelial cell line (PTECs). The PTECs (HK-2) were derived from immortalized primary human proximal tubular cells isolated from the normal adult male kidney and were immortalized with the human papilloma virus (HPV 16) E6/E7 genes. The HK-2 cells were obtained from the American Type Culture Collection. They were maintained in DMEM/F12 containing 5 µg/ml insulin, 5 µg/ml transferrin, 5 ng/ml selenium, 36 ng/ml hydrocortisone, 4 pg/ml triiodo-l-thyronine, 10 ng/ml epidermal growth factor, 50 U/ml penicillin, 50 µg/ml streptomycin and 2 mM L-glutamine.
Cell treatment and viability
CsA was prepared as a stock solution (4.2 mM) by dissolving 5 mg of the powder in 1 ml of 100% ethanol. CsA concentrations (420 nM–42 μM) in this study were chosen to approximate the concentration range reached in the kidney in vivo and therefore represent an in vitro nephrotoxic profile that is relevant to the clinical situation [9]. For the neutralizing antibody studies, the cells were pre-treated and subsequently co-treated with a monoclonal (rabbit) anti-TGF-β1 antibody (R&D Systems) at a concentration of 30 µg/ml. Cell viability was measured by the method of Alamar blue uptake.
Phase contrast microscopy
Phase contrast microscopy was carried out using a charge-coupled device (CCD) video camera attached to a Nikon TMS phase contrast microscope. All micrographs were then processed using Adobe PhotoShop software.
Immunofluorescent microscopy
HK-2 cells were grown on eight-chamber (Falcon) glass slides for 24 h and were pre-treated with TGF-β1 neutralizing antibody for 1 h. They were then treated with CsA for various time points up to 72 h. The cells were fixed using 500 μl of 3.7% formaldehyde/PBS for 20 min on an orbital shaker at room temperature. The cells were permeabilized in 0.2% (v/v) Triton X-100/PBS, for 20 min on an orbital shaker at room temperature. The samples were blocked for 20 min in 0.5% BSA/PBS. For the β-catenin stain, cells were incubated with 150 μl per well of primary (1:100) polyclonal goat anti-β-catenin antibody in 0.5% (w/v) BSA/PBS for 1 h at room temperature. The slides were incubated with 150 μl per well of the secondary antibody (1 : 200 dilution donkey anti-goat FITC in 1% BSA/PBS) for 1 h at room temperature on an orbital shaker. For the F-actin stain, 150 μl of a 1:40 dilution in 0.5% BSA/PBS of rhodamine phalloidin was added to each well for 30 min at room temperature on the shaker. 150 μl of a 1:1000 dilution of DAPI was added to each well for 5 min at room temperature. The slides were mounted using the anti-quenching agent Citifluor™ and then analysed using the Zeiss Axioplan II fluorescent microscope attached to a digital camera.
Preparation of cell lysates
Cells cultured on 100 mm Falcon Petri dishes were used to prepare cell extracts. Following the appropriate treatment, cells were washed with PBS and 1 ml of radioimmuno-precipitation assay buffer [20 mM Tris (pH 7.4), 50 mM NaCl, 5 mM EDTA, 5 mM NaF, 20 mM sodium pyrophosphate, 1 mM orthovanadate, 1% (v/v) Triton X-100, 0.1% (w/v) SDS, 1 mM phenylmethylsulfonylfluoride, 1 µg/ml pepstatin, 0.5 µg/ml leupeptin and 0.5 µg/ml aprotinin] was added to each dish. The cells were scraped into 1.5 ml Eppendorf tubes and rotated for 30 min at 4°C, followed by centrifugation at 12 000 r.p.m. (15 000 g) for 7 min at 4°C using an Eppendorf microcentrifuge. The resulting supernatants were stored in aliquots at −20°C until required. Protein concentration in the cellular lysate solution was determined by the Bradford assay.
SDS–PAGE and western blot analysis
The procedure used was that of Laemmli [10]. 15 µg of protein was loaded per well. 15 μl of sample with a 1 µg/μl final protein concentration was added to 5 μl of 3×sample buffer [2% SDS, 10% (v/v) glycerol, 60 mM Tris–HCl, 0.0% (w/v) bromophenol blue, pH 6.8]. Following electrophoresis, the proteins within the gel were then transferred to nitrocellulose membrane (0.2 µm pore size). The blots were blocked for 1 h at room temperature in 5% milk proteins/TBS and were incubated overnight at 4°C with 1 : 1000 monoclonal (rabbit) anti-TGF-β1 antibody (R&D systems). The blots were then washed and incubated with 1 : 2000 anti-rabbit HRP-conjugated antibody secondary for 1 h at room temperature. The presence of bound antibody was detected using a chemiluminescence system with the substrate luminal (Boehringer Mannheim, UK).
Detection of secreted gelatinase activity
HK-2 cells were grown on six-well plates (Falcon). At confluency cells were treated appropriately for various time periods. The conditioned medium was collected and centrifuged at 800 g for 5 min. The cells were trypsinized and counted. Sample volumes were corrected for cell number. The supernatants were then concentrated 20-fold in centricon 30 microconcentrators. Enzyme activity in the culture medium was monitored by gelatin zymography. Briefly, 10 ml aliquots were mixed with an equal volume of non-reducing Laemmli sample buffer [10] and electrophoresed in 7.5% SDS–polyacrylamide gels containing 1 mg/ml gelatin. After electrophoresis, the gels were cleared of SDS by incubating for 1 h with two changes of 2.5% (v/v) Triton X-100. Gels were then incubated overnight at 37°C in substrate buffer (Tris–HCl 50 mM pH 7.5, CaCl2 10 mM, NaCl 50 mM and 0.05% Brij 35). The gels were then stained with Coomasie blue, destained and dried. Proteins with gelatinolytic activity were visualized as areas of lytic activity on an otherwise blue background. Conditioned medium from HL60 cells treated with 3 mM PMA was used as a positive control.
RNA extraction and reverse transcription polymerase chain reaction
Total RNA was extracted from cells using TRIzol reagent (Life Technologies-BRL). The Gibco-BRL RT kit was used to generate cDNA. Briefly, a 5 µg sample of total RNA from each treatment group was placed in individual sterile 0.5 ml PCR tubes to which 1 μl of random primers (200 ng/μl) was added. The volume was brought up to 12 μl with sterile water. The tubes were inserted into the Eppendorf Mastercycler PCR machine. The mixtures were heated to 70°C for 10 min and then quickly chilled on ice. Subsequently, 4 μl of 5× First Strand Buffer, 2 μl of 0.1 M DTT and 1 μl of 10 mM dNTP mix (Promega) were added to each of the tubes. The contents were mixed and the tubes replaced into the PCR machine where they were incubated for 10 min at 25°C, followed by a further 2 min at 42°C. 1 μl of Superscript-reverse transcriptase enzyme (Gibco-BRL) was then added to the mix and the contents of each tube was mixed gently by pipetting up and down. The incubation was allowed to proceed for 50 min at 42°C and the reaction was terminated, by heating the mixture to 70°C for 15 min. This cDNA was used in the PCR. 2 μl of the cDNA was taken from each sample and inserted into 0.5 ml PCR tubes along with 1 μl of forward primer (100 ng/μl), 1 μl of reverse primer (100 ng/μl), 2 μl of 10 mM dNTPs, 5 μl of 10× buffer, 3 μl of 25 mM MgCl2, 0.25 μl of Taq Polymerase (Promega) and 35.75 μl of sterile distilled water to bring the volume up to 50 μl. The number of PCR cycles used was determined to be within the linear range of the reactions. The primers and their sequences used in the PCRs are listed in Table 1.
PCR primer sequences
| Gene . | Primer Sequences . |
|---|---|
| GAPDH | Forward: 5′ACCACAGTCCATGCCATCAC 3′ |
| Reverse: 5′ TCCACCACCCTGTTGCTGTA 3′ | |
| Fibronectin | Forward: 5′ CGAAATCACAGCCAGTAG 3′ |
| Reverse: 5′ ATCACATCCACACGGTAG 3′ | |
| CTGF | Forward: 5′ CCAAGACCTGTGGGATGGGC 3′ |
| Reverse: 5′ TCCACCACCCTGTTGCTGTA 3′ | |
| Collagen IV | Forward: 5′ CCAGGAGTTCCAGGATTTCA 3′ |
| Reverse: 5′ TTTTGGTCCCAGAAGGACAC 3′ | |
| TIMP-1 | Forward: 5′ ATTCCTGTTGTTGCTGTGGCTG 3′ |
| Reverse: 5′ GACTGGAAGCCCTTTTCAGA 3′ | |
| α-SMA | Forward: 5′ GCGTGGCTATTCCTTCGTTAC 3′ |
| Reverse: 5′ CATAGTGGTGCCCCCTGATAG 3′ | |
| E-cadherin | Forward: 5′ TGAAGGTGACAGAGCCTCTGGA 3′ |
| Reverse: 5′ TGGGTGAATTCGGGCTTGTT 3′ |
Statistical analysis
Data was analysed by one-way ANOVA (analysis of variance) and multiple comparisons between treatment groups were made using Dunnet or Bonferroni tests. Results were expressed as the mean±SEM. A probability of 0.05 or less was deemed statistically significant. The following scheme was used throughout *P<0.05, **P<0.01, ***P<0.001.
Results
Effect of CsA on cellular viability and morphology
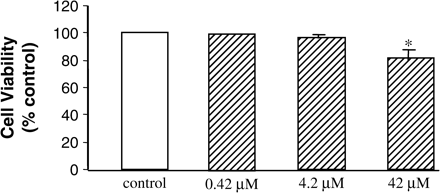
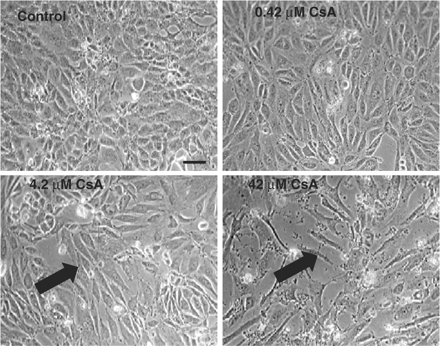
No significant effects on viability were detected at 0.42 or 4.2 μM CsA treatment after 24, 48 or 72 h, data shown for 48 h (Figure 1). CsA treatment of confluent HK-2 cells resulted in a slight decrease in cellular viability (85%) only at the highest doses of 42 μM after 24, 48 and 72 h, data shown for 48 hours (Figure 1). The control cells showed a typical epithelial cuboidal shape, with a cobblestone morphology (Figure 2); however, upon treatment distinct morphological changes could be seen. At 0.42 and 4.2 μM CsA there was evidence of cellular elongation. Cells treated with 42 μM CsA showed evidence of gross elongation with filopodia formation (Figure 2). These findings were more pronounced as the concentration of CsA and the duration of treatment increased (data not shown).
Effect of CsA treatment on HK-2 cellular viability as assayed by the Alamar Blue assay. Cells were grown to confluency and treated with varying doses of CsA for 48 h. Cell monolayers were incubated with Alamar Blue, absorption was measured at 540 nm and viability was expressed as a % of the absorbance recorded for control wells. *P<0.05, **P<0.01, ***P<0.001.
Effect of CsA treatment on HK-2 cellular morphology. Cells were grown to confluency and treated with varying doses of CsA for 48 h. Cell were visualized using phase contrast microscopy. The pictures are representative of at least three independent experiments performed in duplicate. Arrows indicate the presence of elongation/filopodia. Original magnification, 200×. Calibration bar, 10 µm.
Effect of CsA on F-actin arrangement and β-catenin localization within the cell
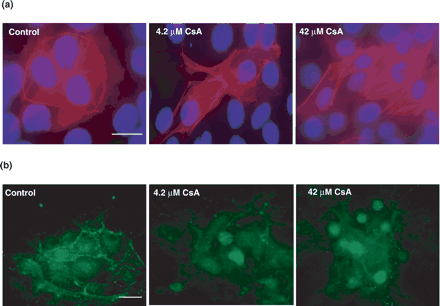
In the control cells, the F-actin could clearly be seen at the junctions of the cell (Figure 3a). Treatment with 4.2 μM CsA for 48 h caused a rearrangement of the F-actin fibres and stress fibre formation was clearly visible (Figure 3a). Treatment with the higher dose of 42 μM CsA for 48 h showed a striking coalescence of the F-actin fibres into stress fibres (Figure 3a). In the control cells, β-catenin was seen predominantly located at the cellular junctions (Figure 3b). Treatment with 4.2 μM CsA resulted in loss of junctional staining and translocation of the β-catenin towards the nuclei of the cells. This nuclear translocation is even more obvious at treatment with 42 μM CsA (Figure 3b).
Immunofluorescent microscopy of F-actin distribution and β-catenin staining in HK-2 cells treated with varying concentrations of CsA. HK-2 cells were grown on glass slides for 24 h and subsequently treated with 4.2 μM cyclosporine A for a further 48 h. (a) The cells were stained with rhodamine phalloidin to highlight F-actin distribution and DAPI for nuclear localisation. Original magnification, 600×. (b) The cells were stained with β-catenin antibody to indicate β-catenin localization in the cells. Original magnification, 400×. The pictures are representative of at least three independent experiments performed in duplicate. Calibration bar, 10 µm.
CsA induces expression of ECM components and modifiers
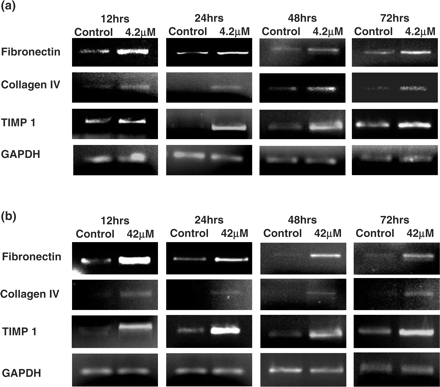
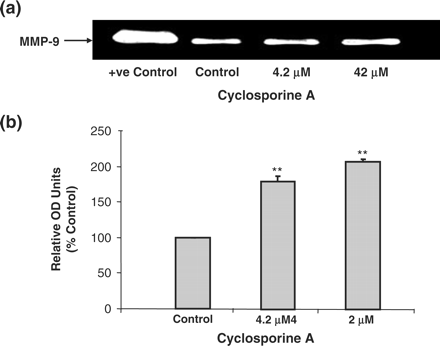
At the treatment doses of 4.2 and 42 μM CsA there were increases in the mRNA expression levels of all of the ECM components (Fibronectin, Collagen IV and TIMP-1) analysed at 12, 24, 48 and 72 h (Figure 4). Similar increases in the mRNA levels of ECM components and modifiers were also observed at 0.4 μM treatment dose (data not shown). The increases in mRNA levels of fibronectin and TIMP-1 were greater than those of collagen IV. At the treatment doses of 4.2 μM CsA and 42 μM CsA, there were also significant increases in the levels of MMP-9 activity as observed by gelatin zymography (Figure 5).
Influence of CsA on extracellular matrix component regulation in HK-2 cells. Cells were grown to confluency on 35 mm Petri dishes and treated with varying concentrations of CsA for varying lengths of time. Fibronectin, Collagen IV, TIMP 1 and GAPDH mRNA levels were analysed in total RNA purified from the treated HK-2 cells. Shown are pictures of ethidium bromide-stained 1% agarose gels containing 10 μl of each PCR after electrophoresis. (a) 4.2 μM CsA treatment. (b) 42 μM CsA treatment. The pictures are representative of at least three independent experiments performed in duplicate.
Gelatin zymography analysis of MMP-9 protein activity in HK-2 cells. Cells were treated with varying concentrations of CsA for 48 h. Proteins were run on a 12% SDS–PAGE gel. (a) Gelatinolytic activity of MMP-9 was detected by electrophoresis in acrylamide gels copolymerized with gelatin. Clear zones of gelatin lysis against blue background, following Coomasie blue staining, indicate the presence of gelatinolytic enzymes. A positive control for MMP-9 activity was also used. The blot is representative of at least three independent experiments performed in duplicate. (b) Clear zones were quantified using densitometry. Results are expressed as relative OD units, which are proportional to the absorbance of the bands and are the mean ± SEM of three independent experiments each performed in duplicate. *P<0.05, **P<0.01, ***P<0.001.
Investigation of the role of TGF-β1 in CsA-induced EMT
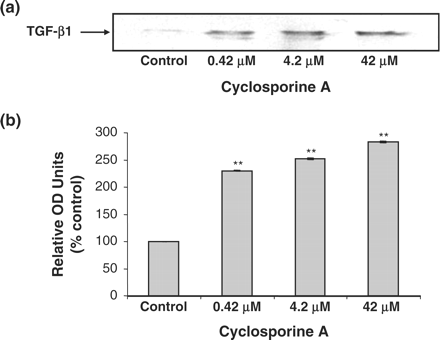
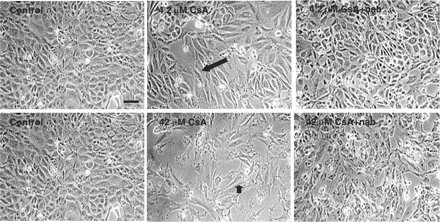
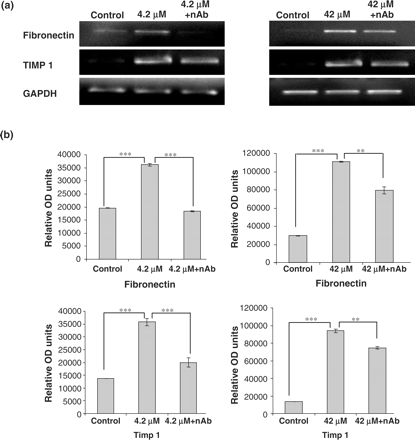
Expression of TGF-β1 following treatment with CsA was analysed by western blotting. The cells were treated with 0.42, 4.2 and 42 μM CsA for 48 h and TGF-β1 levels were detected. Dose dependent increases in TGF-β1 expression were detected after CsA addition (Figure 6). The effects of the addition of TGF-β1 neutralizing antibody on HK-2 cellular morphology was analysed by phase contrast microscopy. A clear protective effect of treatment with TGF-β1 neutralizing antibody, for 1 h prior to the addition of 4.2–42 μM CsA and subsequent co-treatment for 48 h, was demonstrated (Figure 7). This protective effect was demonstrated at both doses (4.2 and 42 μM) of CsA (Figure 7). The effects of TGF-β1 neutralizing antibody on CsA-induced gene expression was investigated using RT–PCR. Pre-treatment of the HK-2 cells with TGF-β neutralizing antibody for 1 h prior to CsA treatment significantly reduced the CsA-induced expression levels of fibronectin in all treatment groups (Figure 8). Pre-treatment of these cells with TGF-β1 neutralizing antibody for 1 h prior to CsA treatment also significantly reduced the expression levels of TIMP-1 in all treatment groups (Figure 8).
Western blot analysis of TGF-β1 protein expression in HK-2 cells. Cells were treated with varying concentrations of CsA for 48 h. Proteins were run on a 12% SDS–PAGE gel. Levels of TGF-β1 were detected by western blotting. Bands corresponding to the molecular weight of TGF β (25 kDa) were detected as shown by arrow. (a) Western blot of TGF-β1. The blot is representative of at least three independent experiments performed in duplicate. (b) Band intensity was quantified using densitometry. Results are expressed as % control at time zero and are given as the mean ±SEM of three independent experiments each performed in duplicate. *P<0.05, **P<0.01, ***P<0.001.
Comparison of the effect of the addition of CsA±TGF-β1 neutralizing antibody to HK-2 cellular morphology. HK-2 cells were treated at confluency for 48 h with 4.2 μM CsA±pre-treatment with 30 µg/ml of TGF-β1 neutralizing antibody. The cells were pre-treated with the neutralizing antibody for 1 h prior to CsA treatment or were treated with CsA alone for various time points. Cells were visualized using phase contrast microscopy. The pictures are representative of at least three independent experiments performed in duplicate. Arrows indicates the presence of elongation/filopodia. Original magnification, 200×. Calibration bar, 10 µm.
Influence of TGF-β1 neutralizing antibody on CsA induced gene expression in HK-2 cells. Cells were grown to confluency on 35 mm Petri dishes and treated with 4.2 and 42 μM CsA with or without TGF-β1 neutralizing antibody. TGF-β1 neutralizing antibody was diluted in culture medium to a concentration of 30 µg/ml. The cells were pre-treated with the neutralizing antibody for 1 h prior to CsA treatment or were treated with CsA alone for 48 h. Fibronectin, TIMP 1 and GAPDH mRNA levels were analysed in total RNA purified from the treated HK-2 cells. (a) Ethidium bromide-stained 1% agarose gels containing 10 μl of each PCR after electrophoresis. Treatments were 4.2 and 42 μM CsA for 48 h. The pictures are representative of at least three independent experiments performed in duplicate. (b) Band intensity was quantified using densitometry. Results are expressed as relative optical density units, which are proportional to the absorbance of the bands and are given as mean ± SEM of three independent experiments, each performed in duplicate. *P<0.05, **P<0.01, ***P<0.001.
CsA induces alterations in E-cadherin mRNA expression
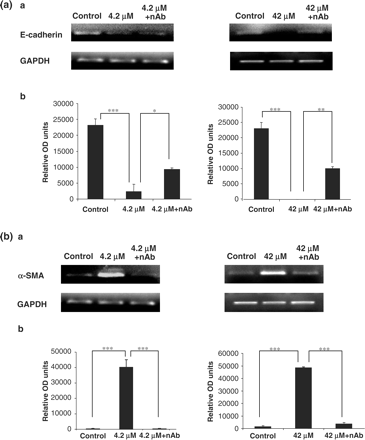
E-cadherin is a marker for the epithelial phenotype [5]. Dramatic decreases in E-cadherin mRNA expression were seen in the cells treated with 4.2 and 42 μM CsA at 48 h (Figure 9a). Pre-treatment of the cells with TGF-β1 neutralizing antibody for 1 h prior to CsA treatment and subsequent co-treatment, significantly restored the expression levels of E-cadherin in all treatment groups (Figure 9a).
(a) Influence of TGF-β1 neutralizing antibody on cyclosporine abrogation of E-cadherin gene expression in HK-2 cells. Cells were grown to confluency on 35 mm Petri dishes and treated with 4.2 μM CsA with or without TGF-β1 neutralizing antibody. TGF-β1 neutralizing antibody was diluted in culture medium to a concentration of 30 µg/ml. The cells were pre-treated with the neutralizing antibody for 1 h prior to CsA treatment or were treated with CsA alone for 48 h. E-cadherin and GAPDH mRNA levels were analysed in total RNA purified from the treated HK-2 cells. (a) Ethidium bromide-stained 1% agarose gels containing 10 μl of each PCR after electrophoresis. Treatments were 4.2 and 42 μM CsA for 48 h. The pictures are representative of at least three independent experiments performed in duplicate. (b) Band intensity was quantified using densitometry. Results are expressed as relative optical density units, which are proportional to the absorbance of the bands and are given as mean ± SEM of three independent experiments, each performed in duplicate. *P<0.05, **P<0.01, ***P<0.001. (b) Influence of TGF-β1 neutralizing antibody on CsA induction of α-SMA gene expression in HK-2 cells. Cells were grown to confluency on 35 mm Petri dishes and treated with 4.2 and 42 μM CsA with or without TGF-β1 neutralizing antibody. TGF-β1 neutralizing antibody was diluted in culture medium to a concentration of 30 µg/ml. The cells were pre-treated with the neutralizing antibody for 1 h prior to CsA treatment or were treated with CsA alone for48 h. α-SMA and GAPDH mRNA levels were analysed in total RNA purified from the treated HK-2 cells. (a) Ethidium bromide-stained 1% agarose gels containing 10 μl of each PCR after electrophoresis. Treatments were 4.2 and 42 μM CsA for 48 h. The pictures are representative of at least three independent experiments performed in duplicate. (b) Band intensity was quantified using densitometry. Results are expressed as relative optical density units, which are proportional to the absorbance of the bands and are given as mean ± SEM of three independent experiments, each performed in duplicate. *P<0.05, **P<0.01, ***P<0.001.
CsA induces expression of α-smooth muscle actin mRNA
α-smooth muscle actin is a marker for the myofibroblast phenotype [5]. Dramatic increases in α-smooth muscle actin mRNA expression were seen in the cells treated with 4.2 and 42 μM CsA at 48 h (Figure 9b). Pre-treatment of the cells with TGF-β1 neutralizing antibody for 1 h prior to CsA treatment and subsequent co-treatment significantly reduced the expression levels of α-smooth muscle actin in all treatment groups (Figure 9b).
CsA induces alterations in connective tissue growth factor mRNA expression
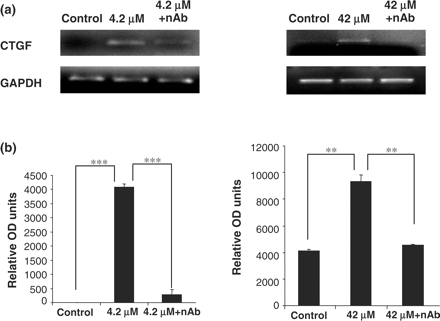
CTGF is a downstream mediator of TGF-β1 [8]. The cells treated with CsA displayed increased expression of CTGF. Pre-treatment of these cells with TGF-β1 neutralizing antibody for 1 h prior to CsA treatment and subsequent co-treatment significantly reduced the expression levels of CTGF in all treatment groups (Figure 10).
Influence of TGF-β1 neutralizing antibody on CsA induced CTGF gene expression in HK-2 cells. Cells were grown to confluency on 35 mm Petri dishes and treated with 4.2 and 42 μM CsA with or without TGF-β1 neutralizing antibody. TGF-β1 neutralizing antibody was diluted in culture medium to a concentration of 30 µg/ml. The cells were pre-treated with the neutralizing antibody for 1 h prior to CsA treatment or were treated with CsA alone for 48 h. CTGF and GAPDH mRNA levels were analysed in total RNA purified from the treated HK-2 cells. (a) Ethidium bromide-stained 1% agarose gels containing 10 μl of each PCR after electrophoresis. Treatments were 4.2 and 42 μM CsA for 48 h. The pictures are representative of at least three independent experiments performed in duplicate. (b) Band intensity was quantified using densitometry. Results are expressed as relative optical density units, which are proportional to the absorbance of the bands and are given as mean ± SEM of three independent experiments, each performed in duplicate. *P<0.05, **P<0.01, ***P<0.001.
Discussion
Our findings show, for the first time, that CsA can induce EMT in human renal epithelial cells. CsA treatment induced a change in the epithelial cell transcriptome and phenotype, leading to an EMT. Our results also indicate that CsA-induced alterations in TGF-β expression are involved in the mechanism of CsA-induced EMT.
Activation of myofibroblasts plays a critical role in the cell adhesion, actin re-organization and enhanced cell progression of chronic renal disease. Emerging evidence suggests that these activated myofibroblasts can derive from tubular epithelial cells by EMT [11,12]. EMT is characterized as the transformation of closely adhered, cuboidal epithelial cells into unanchored, elongated mesenchymal type cells [13]. These transformed cells show evidence of loss of epithelial cell adhesion, actin re-organization and enhanced cell migration and invasion. These alterations in epithelial phenotypes were found in models of renal fibrosis [4,5]. Clinical studies have also recently shown the existence of EMT in human renal biopsies [14].
Numerous cellular changes are associated with EMT. Fibroblasts that originate from epithelial cells through EMT events turn off genes coding for cell adhesion molecules and modify the type of intermediate filaments they express. Normal epithelial cells are cuboidal and are tightly adhered to surrounding cells. They display apical-to-basal polarity and β-catenin and F-actin are found predominantly at the cell junctions [13,15]. Our results clearly show evidence of EMT induced by CsA, where the cells become more elongated, form filopodia, are less adhered and lose their apical-to-basal polarity. Loss of one of the adherens junction proteins is also of interest. β-Catenin is normally found at the junction of the cell, but CsA treatment resulted in the relocation of β-catenin to the nucleus, indicating cell junction breakdown. Interaction between the TGF-β receptor pathway and β-catenin has been suggested to be a key event during adherens junction disassembly, which is an important pathway in the completion of EMT [16].
It was clear from our studies that the increasing doses of CsA resulted in actin re-organization and F-actin stress fibre formation as visualized by immunofluorescence in the renal epithelial cells. This re-arrangment of F-actin from its normal junctional position demonstrated a cytoskeletal re-organization. Previous studies have shown that the presence of α-SMA positivity is a specific myofibroblast marker [5]. Our data suggest that activation of the epithelial cell by addition of cyclosporine A is associated with induction of α-SMA production and a loss of E-cadherin expression.
Cellular changes also associated with EMT include evidence that some cells start synthesizing extracellular matrix molecules such as fibronectin and certain types of collagen. They can also synthesize inhibitors of ECM degradation proteins such as TIMP 1 and 2. We found a significant increase in the production of fibronectin in renal epithelial cells treated with increasing doses of CsA, which is consistent with a more fibroblast-like phentoype [11,13]. We also found collagen IV levels to be elevated. TIMP 1 levels were also significantly elevated in CsA-treated cells. The increased production of TIMP 1 prevents degradation of extracellular matrix components thus allowing accumulation of ECM leading to fibrosis. The ability of the renal epithelial cells to gain a migratory ability is consistent with the increased expression of matrix metalloproteinase, as observed in these cells upon CsA treatment. MMPs are capable of the breakdown of tubular basement membrane, thus allowing cells to migrate and invade surrounding areas [17]. All of these alterations in gene expressions are consistent with the induction of EMTs [5,18].
CsA has also been implicated in an increased incidence of cancer [7,19]. It was previously thought that this cyclosporine-associated cancer results from a failure of the immune system to eliminate cancerous cells, presumably because, when treated with CsA, the immune system cannot detect and respond to proteins associated specifically with the tumours. Hojo et al. [19] suggest a radically different explanation—CsA can induce phenotypic changes, including invasiveness of non-transformed cells, by a cell-autonomous mechanism. They have shown that CsA treatment of adenocarcinoma cells resulted in striking morphological alterations, including membrane ruffling and numerous pseudopodial protrusions, increased cell motility and anchorage-independent (invasive) growth. These changes were prevented by treatment with monoclonal antibodies directed at TGF-β. In T-cell deficient mice, Hojo et al. [19] also examined the effects of CsA on pulmonary metastasis in renal cell carcinoma. They found that CsA did, in fact, increase the incidence of metastasis and this increase in pulmonary metastasis could also be prevented by anti-TGF-β antibodies.
These studies indicate a possible role for CsA and TGF-β in cancer invasion and metastasis. Therefore, we decided to examine if TGF-β was equally as important in EMT induced by CsA in renal PTEC. We analysed the level of TGF-β1 expression in these cells and found it to be significantly elevated. Subsequently, we examined the effect of blocking TGF-β1 expression in the cells by using TGF-β1 neutralizing antibodies. There was a marked reduction in the amount of cell matrix component production caused by the CsA treatment and also inhibition of TGF-β1 expression resulted in a decrease in the elongation and filopodia development in these cells. It has recently been suggested that there are four key events that are crucial in the process of EMT. These include: (i) the loss of epithelial adhesion properties, (ii) de novo expression of α-SMA and actin re-organization, (iii) disruption of the tubular basement membrane and (iv) enhanced cell migration and invasion [5,18]. CsA appears from our studies to be capable of inducing tubular epithelial cells to undergo all of these steps, thereby leading to the completion of the entire EMT course.
Another relevant finding in our own studies was the induction of CTGF by CsA treatment and its complete abrogation by neutralizing antibodies to TGF-β. CTGF has been shown to be a potential downstream target for intervention in TGF-β mediated disease [8]. In human renal fibrosis, its expression appears to correlate closely with the degree of tubulointerstitial fibrosis [20]. These findings, therefore, suggest a future potential role for CTGF as a therapeutic target in CsA-induced renal disease. Future elucidation of CTGF receptors and signalling events could also provide novel anti-fibrotic targets. Other potential targets suggested by this data might include regulators of extracellular matrix production and turnover, such as TIMP-1 regulation. Furthermore, as EMT is a complicated series of events, combination therapies, which can target several key steps in the development of EMT, may prove to be more beneficial than mono-target therapies. Therefore these combination therapies could include the use of BMP-7, which has been suggested to antagonize TGF-β action [18], as well as CTGF inhibitors to target the downstream effects of TGF-β and CTGF signalling.
In conclusion, our data provide the first evidence that CsA can cause an EMT-like event in human renal epithelial cells. The changes in extracellular matrix components and cell morphology indicate that CsA can affect epithelial genotype and phenotype and our results also indicate that alterations in TGF-β expression levels are involved in the mechanism of CsA-induced EMT. These data suggest that CsA-induced EMT is a key event in the development of interstitial fibrosis, which is a frequent complication in CsA long-term treatment.
T.M. and M.G. contributed equally to this work. This project was co-funded by the Conway Institute of Biomolecular and Biomedical Research and the Dublin Molecular Medicine Centre (DMMC), under the Programme for Research in Third Level Institutions (PRTLI) administered by the Higher Education Authority (HEA) This project was also part-funded by the Health Research Board of Ireland and Enterprise Ireland.
Conflict of interest statement. None declared.
References
Bennett WM, Burdmann EA, Andoh TF, Houghton DC, Lindsley J, Elzinga LW. Nephrotoxicity of immunosuppressive drugs.
Esposito C, Fornoni A, Cornacchia F et al. Cyclosporine induces different responses in human epithelial, endothelial and fibroblast cell cultures.
Keane T, Egan D, Ryan MP. Potential mechanisms of CsA-induced renal fibrosis.
Ng YY, Huang TP, Yang WC et al. Tubular epithelial-myofibroblast transdifferentiation in progressive tubulointerstitial fibrosis in 5/6 nephrectomized rats.
Yang J, Liu Y. Dissection of key events in tubular epithelial to myofibroblast transition and its implications in renal interstitial fibrosis.
Shihab FS, Bennett WM, Yi H, Choi SO, Andoh TF. Mycophenolate mofetil ameliorates arteriolopathy and decreases transforming growth factor-β1 in chronic cyclosporine nephrotoxicity.
Maluccio M, Sharma V, Lagman M et al. Tacrolimus enhances transforming growth factor-beta1 expression and promotes tumor progression.
Grotendorst GR. Connective tissue growth factor: a mediator of TGF-β action on fibroblasts.
Mead JC, Brown PA, Whiting PH. The relationship between total kidney cyclosporin A concentrations, trough drug levels and renal function in the rat following withdrawal of treatment.
Laemmli UK. Cleavage of structural proteins during the assembly of the head of bacteriophage T4.
Strutz F, Muller GA. Transdifferentiation comes of age.
Kalluri R, Neilson EG. Epithelial-mesenchymal transition and its implications for fibrosis.
Boyer B, Valles AM, Edme N. Induction and regulation of epithelial-mesenchymal transitions.
Rastaldi MP, Ferrario F, Giardino L et al. Epithelial-mesenchymal transition of tubular epithelial cells in human renal biopsies.
Savagner P. Leaving the neighborhood: molecular mechanisms involved during epithelial-mesenchymal transition.
Tian YC, Phillips AO. Interaction between the transforming growth factor-β type II receptor/Smad pathway and beta-catenin during transforming growth factor-beta1-mediated adherens junction disassembly.
Lenz O, Elliot SJ, Stetler-Stevenson WG. Matrix metalloproteinases in renal development and disease.
Liu Y. Epithelial to mesenchymal transition in renal fibrogenesis: pathologic significance, molecular mechanism, and therapeutic intervention.
Hojo M, Morimoto T, Maluccio M et al. Cyclosporine induces cancer progression by a cell-autonomous mechanism.




Comments