-
PDF
- Split View
-
Views
-
Cite
Cite
Nicolas J. Tourasse, Wen-Hsiung Li, Selective Constraints, Amino Acid Composition, and the Rate of Protein Evolution, Molecular Biology and Evolution, Volume 17, Issue 4, April 2000, Pages 656–664, https://doi.org/10.1093/oxfordjournals.molbev.a026344
Close - Share Icon Share
Abstract
What are the major forces governing protein evolution? A common view is that proteins with strong structural and functional requirements evolve more slowly than proteins with weak constraints, because a stringent negative selection pressure limits the number of substitutions. In contrast, Graur claimed that the substitution rate of a protein is mainly determined by its amino acid composition and the changeabilities of amino acids. In this paper, however, we found that the relative changeabilities of amino acids in mammalian proteins are different for transmembranal and nontransmembranal segments, which have very distinct structural requirements. This indicates that the changeability of a given residue is influenced by the structural and functional context. We also reexamined the relationship between substitution rate and amino acid composition. Indeed, the two kinds of segments exhibit contrasting amino acid compositions: transmembranal regions are made up mainly of hydrophobic residues (a total frequency of ∼60%) and are very poor in polar amino acids (<5%), whereas nontransmembranal segments have frequencies of 30% and 22%, respectively. Interestingly, we found that within a given integral membrane protein, nontransmembranal segments accumulate, on average, twice as many substitutions as transmembranal regions. However, regression analyses showed that the variability in amino acid frequencies among proteins cannot explain more than 30% of the variability in substitution rate for the transmembranal and nontransmembranal data sets. Furthermore, transmembranal and nontransmembranal segments evolving at the same rate in different proteins have different compositions, and the compositions of slowly evolving and rapidly evolving segments of the same type are similar. From these observations, we conclude that the rate of protein evolution is only weakly affected by amino acid composition but is mostly determined by the strength of functional requirements or selective constraints.
Introduction
Since the introduction of gene and protein sequences in evolutionary studies (e.g., Zuckerkandl and Pauling 1965 ), molecular evolutionists have tried to identify the major forces that govern molecular evolution. A widely accepted principle is that the rate of amino acid substitution is determined by the stringency of structural and functional constraints (e.g., Kimura 1983;Nei 1987 ; Li 1997 ). That is, if a protein (or part of a protein) has very stringent structural and/or functional requirements, then the encoding gene is subject to a strong negative selection pressure limiting the number of changes in the gene product. Consequently, such a protein evolves more slowly than a protein with weaker constraints. This argument also explains why, within a given protein, regions or individual sites critical for the function, such as catalytic sites or binding domains, are generally better conserved than the rest of the molecule. Many examples of this constraint-rate relationship have been described (see, e.g., Li 1997 ).
In contrast, Graur (1985) , through an analysis of 60 mammalian protein-coding genes, found a highly significant correlation between the substitution rate and the amino acid frequencies in the protein. He thus proposed that composition is the main factor determining the rate of evolution of proteins, whereas functional constraints have only a minor effect. He showed that, in fact, the substitution rate of a protein can be predicted directly from its composition and the relative changeabilities of the amino acids. That is, slowly evolving proteins contain higher frequencies of stable residues and/or lower frequencies of highly changeable residues than do fast evolving peptides. However, this relation may hold only if the changeability of a particular amino acid is similar among proteins. If it is not, then the frequency of a given amino acid tells us little about the substitution rate. The demonstration by Jones, Taylor, and Thornton (1994) that the changeabilities of amino acids in transmembrane segments of membrane-associated proteins are different from those in globular proteins casts some doubt about the use of composition to infer evolutionary rates.
Using a large amount of sequence data, we reanalyzed the relationships among substitution rate, amino acid composition, amino acid changeability, and functional constraints in mammalian proteins. In particular, we compared the evolutionary patterns of transmembranal and nontransmembranal segments, for which the structural and functional requirements are very different. The conclusion is that the rate of protein evolution is only weakly affected by amino acid composition but is mostly determined by the strength of functional requirements or selective constraints.
Materials and Methods
Computation of Relative Changeabilities of Amino Acids
To compute amino acid changeabilities, a data set consisting of proteins of several mammalian groups was constructed. Nuclear protein-coding genes for which there were orthologous sequences available for at least six species belonging to at least three of the following seven mammalian orders were retrieved from HOVERGEN data bank release 34 (February 1999) (see Duret, Mouchiroud, and Gouy [1994] for a description of the database): primates, rodents, lagomorphs, artiodactyls, carnivores, perissodactyls, and cetaceans. Orthology of sequences was assessed by examination of the phylogenetic tree of each protein provided in HOVERGEN. When multiple sequences were present for a given species, the sequence located on the shorter branch was retained. To minimize the possibility of multiple substitutions at the same site, which may bias the calculation of amino acid changeabilities (see below), only proteins for which the observed amino acid divergence between any pair of sequences was lower than 20% were selected. In addition, only proteins longer than 80 residues were kept in order to limit the effect of sampling errors. The final data set consisted of 101 proteins (757 sequences). For each protein, the selected sequences were aligned by CLUSTAL W (Thompson, Higgins, and Gibson 1994 ); the alignment was then adjusted manually, and ambiguous regions and gaps were removed from analysis.
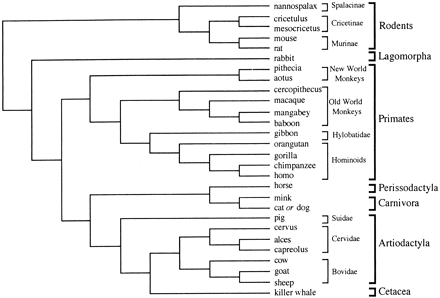
The species sampled and the number of species varied among genes (although human, mouse, and rat sequences were available for most genes). To reduce the possible bias in the computation of substitutions due to incorrect phylogenetic inference, we used branching orders that were known or that had received strong support from different analyses conducted by various authors. Figure 1 gives the overall rooted organismal phylogeny assumed, with the topology for a particular gene constituting only a subtree of this global phylogeny. The relationships between the mammalian orders considered here (or some of them) were obtained using mainly mitochondrial, but also nuclear, proteins (Li et al. 1990 ; Cao, Adachi, and Hasegawa 1994 ; Kuma and Miyata 1994 ; Graur, Duret, and Gouy 1996 ; Janke, Xu, and Arnason 1997 and references therein). The relative position of Cetacea within Cetartiodactyla (Cetacea + Artiodactyla) has been confirmed by recent analyses of mitochondrial sequence data (Gatesy 1997 ; Ursing and Arnason 1998 ) and transposable elements (Shimamura et al. 1997 ). The primate subtree in figure 1 represents the classification of primates suggested by fairly congruent fossil and molecular evidence (reviewed by Shoshani et al. [1996] and Goodman et al. [1998] ). The branching order for the rodent groups in our data set was deduced from phylogenetic analyses of mitochondrial and nuclear genes (see Robinson et al. 1997 and references therein).
First, for each of the 101 proteins, the ancestral amino acid sequences at interior nodes of the phylogenetic tree were inferred using the maximum-likelihood–based method of Yang, Kumar, and Nei (1995) , implemented in the program CODEML of the PAML package (Yang 1999 ). The ancestral reconstruction requires a realistic substitution model (Zhang and Nei 1997 ). We used the substitution matrix of Jones, Taylor, and Thornton (1992) , which was derived from a large database of proteins of various organisms. Also, for each protein, the average amino acid frequencies observed in present-day sequences were used as the equilibrium frequencies. This led to a better fit of the model to the data. The variation of the substitution rate among sites, which is a major property of protein evolution, was accommodated with a gamma distribution. The shape parameter of the distribution was specifically estimated for each protein. Second, the number of observed changes (accepted point mutations) involving each amino acid along each branch of the tree was counted by comparing the sequences at the tips of each branch. The average relative changeability of a given amino acid was the ratio of the total number of times this amino acid had changed along all branches of all protein trees divided by the relative frequency of occurrence of the amino acid in the entire data set (Dayhoff, Schwartz, and Orcutt 1978 ). This frequency was the sum over all branches of all trees of the length of the branch multiplied by the frequency of the amino acid at the internal node from which the branch started. The branch length was measured by the total number of amino acid substitutions in that branch per 100 residues.
In addition, an analysis was done using only the transmembranal segments of the integral membrane proteins present in the data set. Information about the transmembranal nature of the proteins and the limits of the different domains was retrieved from the SwissProt database, release 37 (Bairoch and Apweiler 1999 ). Since transmembranal regions were very short (20–30 amino acids in all proteins examined), all transmembranal segments of a given protein were combined together into a single sequence. Only the 33 proteins (out of 37 available) for which the length of this sequence exceeded 80 amino acids were kept for analysis (225 sequences in total). For this subset, ancestral sequences were inferred by maximum-likelihood using the substitution matrix derived by Jones, Taylor, and Thornton (1994) from a large collection of transmembranal segments combined with the average amino acid frequencies of the present-day sequences and a gamma distribution for rates among sites. For comparison, changeabilities were also estimated from the nontransmembranal regions (totaling more than 80 residues) of those proteins. Actually, only 29 out of the 33 genes were used (192 sequences). The four remaining genes were excluded because the divergence between the nontransmembranal sequences of several species was well above 20%. Here, ancestral states at interior nodes were reconstructed by maximum likelihood using the general model of Jones, Taylor, and Thornton (1992) , combined with observed amino acid frequencies and the gamma distribution.
Correlation Between Substitution Rate and Amino Acid Composition
To study the correlation between substitution rate and amino acid composition, an independent data set was created. It consisted of 230 additional nuclear protein-coding genes that were orthologous between humans and mice. All 99 complete integral membrane proteins for which information about the transmembranal segments was available were retrieved. A random sample of 131 globular proteins was added to construct a relatively balanced data set containing similar numbers of globular and transmembranal proteins. All sequences, which were more than 80 codons long, were extracted from HOVERGEN. For the integral membrane proteins, two subsets were defined. They contained, respectively, the transmembranal and the nontransmembranal regions of 93 proteins for which the total length of transmembranal segments and the total length of nontransmembranal segments were both larger than 80 codons. As above, orthology was checked using the phylogenetic tree of each gene, and the amino acid sequences were aligned by CLUSTAL W. Protein alignments were then manually adjusted and served as templates to construct the corresponding nucleotide alignments.
For each of the three human-mouse data sets (general, transmembranal, and nontransmembranal), 20 simple linear regression equations between the nonsynonymous distance and the mean frequency of each amino acid in a given gene were computed, as in Graur (1985) . The nonsynonymous distance, defined here as the number of nonsynonymous (i.e., amino acid–changing) substitutions per nonsynonymous site in nucleotide sequences, was computed using Li's (1993) method.
Following Graur (1985) , we also fitted multiple linear regression equations between the distance and the frequencies of m amino acids (1 ≤ m ≤ 19). Starting with the residue for which the correlation between its frequency and the nonsynonymous distance was the highest, amino acids were successively introduced in the multiple-regression function (stepwise addition). At each step, the amino acid chosen was the one that gave the largest increase in the proportion of variance (in distance) explained (see Nie et al. 1975 ). Graur (1995) called these equations “empirical indices of mutability” (denoted Im) and suggested that they could be used to predict the substitution rates of proteins.
Results
Relative Changeabilities and Occurrences of Amino Acids
Table 1 gives the relative changeabilities and frequencies of occurrence of the 20 amino acids computed from the general set of 101 mammalian proteins. The results are compared with those obtained by Jones, Taylor, and Thornton (1992) , who used sequences from a larger diversity of eukaryotic and prokaryotic organisms. Overall, the amino acid frequencies and the rankings of changeabilities are similar among the two studies. Isoleucine and serine are slightly less changeable in our data set than in Jones, Taylor, and Thornton's (1992) , while methionine, histidine, and alanine are more changeable. Changeabilities and frequencies calculated for the transmembranal (33 proteins) and nontransmembranal (29 proteins) subsets are shown in table 2 . Even though our data set of transmembranal segments is much more limited than that of Jones, Taylor, and Thornton (1994) (740 and 4,845 accepted point mutations, respectively), we can see that the estimated amino acid frequencies are similar and that the changeability rankings are correlated. The notable differences concern glutamine, cysteine, and leucine. The changeability of glutamine and cysteine deduced from mammalian transmembranal segments is very low (rank 3 and 4, respectively) as opposed to that estimated using a more general set of species (rank 12 and 13) in Jones, Taylor, and Thornton (1994) . On the other hand, leucine switches from higly changeable (rank 15) to intermediate (rank 8). Finally, we notice that the amino acid frequencies and the pattern of changeability in nontransmembranal regions (table 2 ) are similar to those seen in the general data set, which is biased toward nontransmembranal globular proteins (table 1 ).
More importantly, these analyses revealed that the amino acid compositions and the relative changeabilities of the residues in transmembranal segments of integral membrane proteins are different from those in nontransmembranal regions of the same polypeptides (table 2 ). For example, in the latter regions, phenylalanine and arginine are found to be highly stable residues (rank 3 and 6, respectively), whereas they change much more frequently in transmembrane domains (rank 9 and 12, respectively). Conversely, histidine, which is the most changeable residue in the nontransmembranal regions of the proteins examined here (rank 20), is well conserved in segments that cross the membrane (rank 6). The very low changeability of proline is also characteristic of transmembrane domains. These results indicate that the changeability of a particular residue depends on the structural and functional context. Nevertheless, some amino acids have similar changeabilities in all regions. For example, cysteine, tryptophan, and tyrosine are always very stable, while methionine, valine, and isoleucine are highly changeable in any region (table 2 ). As far as amino acid frequencies are concerned, the most remarkable feature is that the composition of membrane-spanning regions is highly biased toward a high content in hydrophobic amino acids and a low content in polar (hydrophilic) residues. Hydrophobic amino acids like leucine, isoleucine, valine, alanine, and phenylalanine combine for about 60% of the total composition of transmembranal segments (with leucine alone accounting for about 17%), while their combined frequency of occurrence is only about 30% in nontransmembranal regions. On the other hand, the large polar amino acids lysine, arginine, glutamine, and glutamic acid are poorly represented in transmembranal domains (total frequency lower than 5% compared with 22% in other regions). These compositional biases were expected from polypeptides integrated in lipid environments.
Correlation Between Substitution Rate and Amino Acid Composition
Using an independent data set of orthologous protein-coding human and mouse genes, we first studied the correlation between the substitution rate of a gene and the frequency of each amino acid. A protein containing high frequencies of stable residues is supposed to evolve slowly, whereas a protein rich in highly changeable residues is supposed to evolve more rapidly. Therefore, as shown by Graur (1985) , we expect a high negative correlation coefficient for the most stable amino acids, a high positive coefficient for the most changeable ones, and nearly no correlation for residues with intermediate changeabilities. The first five amino acids for which the correlation between the frequency and the nonsynonymous distance between humans and mice is the strongest in the general data set (230 genes) and the transmembranal and nontransmembranal subsets (93 genes) are given in table 3 . Although significant correlations were found for many amino acids, the absolute values of the correlation coefficients (r) obtained were smaller than 0.3 in all but two cases. This means that the fraction (r2) of variance in distance explained by the variability in amino acid frequency rarely exceeded 10% in all three data sets. Furthermore, the sign of the relationship was sometimes the opposite of that expected. For example, a positive correlation was found for cysteine, a very stable residue in the general and nontransmembranal sets (r = +0.281 and +0.336, respectively), and a negative correlation was obtained for valine, a highly changeable amino acid in transmembrane domains (r = −0.222).
We then conducted analyses by summing the frequencies of several residues. Following Graur (1985) , we classified the amino acids into three groups according to their changeabilities: (1) highly stable (consisting of residues whose changeabilities were two standard errors above the average changeability), (2) highly changeable (changeabilities two standard errors below the mean), and (3) intermediate. We examined for each group the relationship between the rate of evolution and the sum of the frequencies of all the residues in the group. The correlation coefficients are presented in table 4 . Most of them were very low (|r| < 0.14) and nonsignificant. Significant correlations were obtained only for highly and intermediately changeable amino acids in transmembranal segments. However, the fractions of variance explained (r2) was only about 10% and 12%, respectively. Moreover, the correlation between the nonsynonymous distance and the sum of the frequencies of the five most changeable residues was negative, although a positive relationship was expected. On the other hand, no correlation was expected for amino acids with an intermediate changeability. For the “highly stable” and “highly changeable” groups, using only some of the amino acids of the group instead of all of them gave somewhat higher correlations in some cases, but the absolute values of r were still low. In particular, for the “highly stable” group, the correlation between the substitution rate and the two most stable residues was significant and was the highest, with r2 ∼ 5%, for all three data sets. For the general and nontransmembranal data sets, none of the correlations obtained using some of the most changeable amino acids were significant (highest |r| < 0.12).
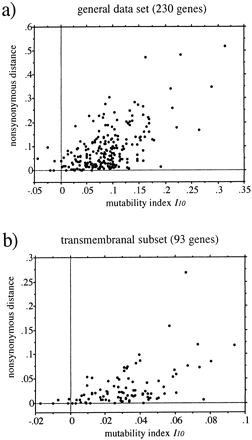
Next, we performed multiple-regression analyses and computed Graur's (1985)Im. In a stepwise addition procedure, the first five amino acids included in the regression equation (i.e., I5) for the general set of 230 human and mouse genes were those having the strongest individual correlations and in the same order (see table 3 ). The multiple-correlation coefficient between I5 and the nonsynonymous distance was r = 0.547. That is, the five residues together explained only r2 = 30% of the total variation in nonsynonymous rate among the 230 proteins. The first 10 amino acids combined explained only 35%, and with 19 residues, the fraction of variance explained was 36%. The relationship between the evolutionary distance and I10 is displayed in figure 2a. Using the transmembranal regions of the 93 integral membrane proteins, the first five residues included in the multiple regression were (in decreasing order) leucine, valine, cysteine, glycine, and lysine. The variability in amino frequencies of these five amino acids accounts for 25% of the total variation in rate. We cannot explain more than 28% with 10 amino acids or more (fig. 2b ). The maximum amount of variance explainable for the nontransmembranal regions is 25%, whatever the number of amino acids considered. Given the weak correlations obtained in the above simple and multiple regression analyses, it is clear that the substitution rate of a gene or of a given region within a gene cannot be inferred from its amino acid content.
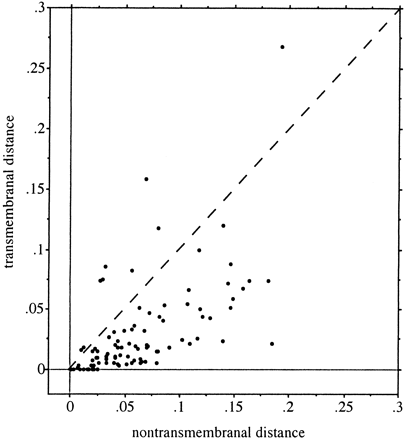
Computation of evolutionary distances indicated that in a given integral membrane protein, transmembrane regions were generally more conserved than regions which did not cross the membrane (fig. 3 ). A higher substitution rate for transmembranal parts was observed for only 9 out of the 93 proteins. Overall, the mean distance between humans and mice was 0.0312 substitutions per nonsynonymous site in transmembranal segments and 0.0639 substitutions per site in other regions. We showed in the preceding section that the two types of regions also had distinct amino acid compositions (table 2 ). It is thus interesting to examine whether the differences in composition can account for the differences in evolutionary rate. To this end, we compared amino acid contents of transmembranal and nontransmembranal segments that showed the same range of substitution rate in different proteins. Two data sets were constructed: (1) a slowly evolving set consisting of all regions (transmembranal or not) for which the nonsynonymous distances between humans and mice were smaller than 0.02 substitutions per site (i.e., less than 4.4% difference at the amino acid level), and (2) a rapidly evolving set consisting of all regions with distances larger than 0.07 substutions per site (protein divergence > 11%). The average distances within each data set were around 0.01 and 0.1, respectively. As can be seen from table 5 , the amino acid frequencies in transmembranal and nontransmembranal segments evolving at the same rate are still fairly different. Conversely, the compositions of slowly evolving and rapidly evolving transmembrane domains are comparable (and similar to the average mammalian composition shown in table 2 ). The same result is observed for nontransmembranal portions. These comparisons lead to the conclusion that the substitution rate in a protein is not determined by its amino acid content.
Discussion
In this paper, we analyzed the pattern of amino acid substitution in mammalian proteins and examined the relationship between evolutionary rate and amino acid composition. First, this study, like that of Jones, Taylor, and Thornton (1994) , which was not limited to mammals, revealed that the relative amino acid changeabilities and the amino acid composition in transmembranal regions of integral membrane proteins are distinct from those in nontransmembranal parts of these proteins (table 2 ). In the latter regions, the pattern is similar to that observed for globular proteins. As explained by Jones, Taylor, and Thornton (1994) , most of these observations can be interpreted in terms of the specific structural requirements imposed on membrane-crossing domains. The effect of constraints on amino acid composition is obvious: being inserted into a lipid environment, these segments contain very high frequencies of hydrophobic residues and very low frequencies of polar (hydrophilic) ones. As far as changeability is concerned, the low changeability of proline in transmembrane domains, compared with other regions, may be explained by the fact that this amino acid plays a major role in kinking transmembranal helices. Similarly, asparagine is more conserved in these segments than in nontransmembranal regions because it is able to create hydrogen bonds that help stabilize the helices (see Jones, Taylor, and Thornton 1994 ). The effects of functional constraints on composition and changeability can also be viewed in nontransmembranal parts. For example, Graur (1985) compared the frequencies of the 20 amino acids in different regions of proteins using a general set close to that of Dayhoff, Schwartz, and Orcutt (1978) . He found that seven amino acids (serine, lysine, glutamic acid, aspartic acid, arginine, cysteine, and histidine) constituted 81% of active sites. In contrast, these amino acids accounted for only 35% in other regions (see table 4 in Graur 1985 ). These residues, except cysteine, have intermediate to high changeabilities in the general data set (rank >7; see tables 1 and 4 ). However, the fact that active sites evolve much more slowly than the rest of proteins implies that the relative changeabilities of these amino acids are lower in active sites than in outer regions. In conclusion, the fact that amino acid changeabilities are influenced by structural and functional context suggests that the overall changeability (i.e., the substitution rate) of a protein cannot be deduced from the amino acid content. We cannot conclude, for example, that a proline-rich protein will evolve more slowly than a proline-poor one if the changeability of proline is different in the two molecules.
A weak relationship between rate of protein evolution and amino acid composition is indeed the second point emphasized in our study. Among human and mouse integral membrane proteins, segments (either transmembranal or not) evolving at different rates maintain similar compositions. On the other hand, transmembranal and nontransmembranal regions of different proteins can manifest similar rates of evolution even if their amino acid contents are distinct (table 5 ). According to the predictions based on amino acid changeability, fast-evolving proteins are supposed to contain large frequencies of highly changeable amino acids and low frequencies of highly stable residues (Graur 1985 ). Some of the results of regression analyses based on orthologous pairs of human and mouse genes presented in tables 3 and 4 contradict those predictions. Low but significant positive correlations between substitution rate and frequencies of stable residues were found, and negative correlations between the rate and frequencies of highly changeable amino acids were also obtained. Significant correlations for residues with intermediate changeabilities were found, although no relationship was expected. Some of these discrepancies may be reconciled with the predictions based on the amino acid changeabilities computed using the index employed by Graur (1985) . For example, in Graur (1985) , arginine and glutamine were classified as highly stable (rank <6) and highly changeable (rank >16) amino acids, respectively (see table 2 in Graur 1985 ). Hence, the negative coefficient r = −0.231 obtained for the former residue and the positive coefficient r = 0.250 obtained for the latter in the general data set (table 3 ) would be in agreement with the expectations. However, the stability index used by Graur was based on the physicochemical distance between two amino acids that are separated by a single nucleotide substitution between codons. This is a theoretical measure that does not depend on sequence data. In particular, a single index would be inappropriate for describing the changeability pattern in both transmembranal and nontransmembranal regions for which the substitution processes clearly differ because of functional constraints. Furthermore, Dayhoff, Schwartz, and Orcutt (1978) found that about 20% of the changes observed in their data set involved amino acids whose codons differed by more than one nucleotide. In contrast, the changeabilities we used were derived from amino acid substitutions observed in real data and therefore give a better representation of the actual evolutionary pattern in protein sequences. Interestingly, most of the correlations between amino acid composition and substitution rate were low. The variability in amino acid frequencies among proteins could not explain more than 30% of the variability in nonsynonymous distance even when several amino acids were considered (fig. 2 and table 4 ). The fraction of variance explained by any individual residue was never higher than 14% and was generally less than 10% (table 3 ). These findings, obtained for a general data set of 230 protein-coding genes from humans and mice, as well as for the transmembranal and nontransmembranal subsets of 93 genes, are in sharp contrast to the results of Graur (1985) . Using a set of 60 mammalian proteins, he found that the frequency of glycine alone could account for 38% (r = −0.619) of the variability in nonsynonymous substitution rate and that almost all variation (97%) was explained with all 20 amino acids. Evidently, these correlations do not hold when additional proteins are included in the analysis. We think that the multiple-regression equations Im cannot be reliably used as mutability or compositional indices to predict the substitution rate of a protein or a particular region within a protein (fig. 2 ).
For many years, it has been observed that functionally important regions within a protein, like catalytic sites or binding domains, accumulate few changes because of intense selective pressure, whereas less important parts evolve faster because of more relaxed constraints. In a particular membrane-associated protein, the rate of substitution in transmembrane domains is usually slower than that in other segments (fig. 3 ). The above results indicate clearly that this difference in rate is not a consequence of the difference in amino acid content. Rather, it is because transmembrane segments are subject to more stringent structural constraints. Jones, Taylor, and Thornton (1994) also noted that multiple-spanning transmembrane segments, which require additional structural features allowing them to cross the membrane several times, evolve more slowly than single-spanning domains. We conclude that the selection associated with structural and functional requirements is really the main factor that determines the rate of protein evolution.
Wolfgang Stephan, Reviewing Editor
Keywords: amino acid composition substitution rate functional and structural requirements selective constraints protein evolution
Address for correspondence and reprints: Wen-Hsiung Li, Department of Ecology and Evolution, University of Chicago, 1101 East 57th Street, Chicago, Illinois 60637. E-mail: whli@uchicago.edu.
Table 1 Relative Changeabilities and Frequencies of Occurrence of the 20 Amino Acids Computed from General Data Sets
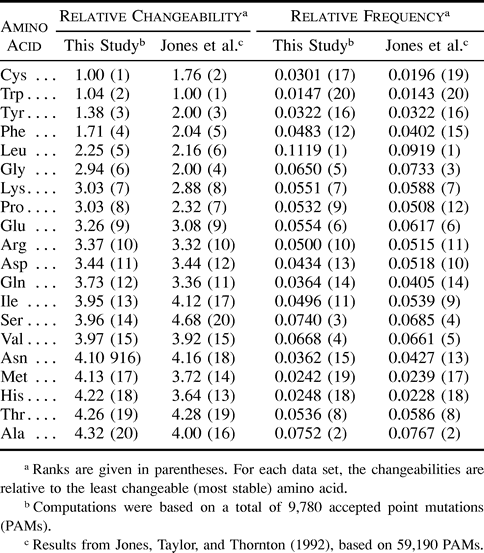
Table 1 Relative Changeabilities and Frequencies of Occurrence of the 20 Amino Acids Computed from General Data Sets

Table 2 Relative Changeabilities and Frequencies of Occurrence of the 20 Amino Acids Computed from Transmembranal and Nontransmembranal Data Sets
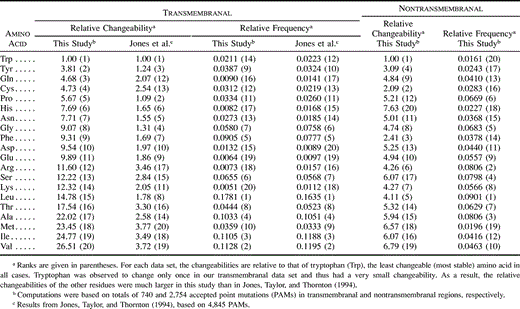
Table 2 Relative Changeabilities and Frequencies of Occurrence of the 20 Amino Acids Computed from Transmembranal and Nontransmembranal Data Sets

Table 3 Correlation Between Nonsynonymous Substitution Rate and Frequencies of Individual Amino Acids

Table 3 Correlation Between Nonsynonymous Substitution Rate and Frequencies of Individual Amino Acids

Table 4 Correlation Between the Nonsynonymous Substitution Rate and the Sum of Frequencies of Several Amino Acids

Table 4 Correlation Between the Nonsynonymous Substitution Rate and the Sum of Frequencies of Several Amino Acids

Table 5 Mean Amino Acid Frequencies in Slow- and Fast-Evolving Transmembranal and Nontransmembranal Regions
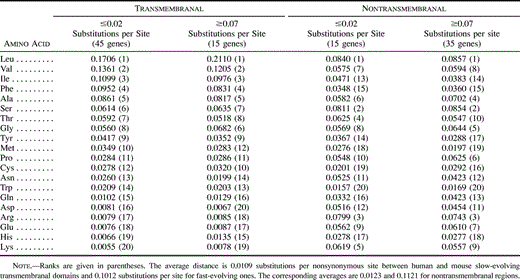
Table 5 Mean Amino Acid Frequencies in Slow- and Fast-Evolving Transmembranal and Nontransmembranal Regions

Fig. 1.—Mammalian phylogeny used to estimate the relative changeabilities of amino acids. Data sets for individual genes constitute only subsets of this global phylogeny. Branch lengths have no meaning
Fig. 2.—Relationship between the nonsynonymous substitution rate and the mutability index I10 for proteins orthologous in humans and mice. The distance between each pair of sequences is the number of nonsynonymous substitutions per nonsynonymous site, computed following Li (1993). I10 is the multiple-regression equation that maximizes the correlation between the distance and the frequencies of 10 amino acids (see Materials and Methods)
Fig. 3.—Comparison of the nonsynonymous substitution rates in transmembranal and nontransmembranal segments of 93 orthologous proteins in humans and mice. The distance between each pair of sequences is the number of nonsynonymous substitutions per nonsynonymous site, computed following Li (1993). If the rates were identical in both types of segments, the points would be distributed along the dashed line
This study was supported by NIH grants. We thank two anonymous reviewers for their very helpful comments on an earlier version of this manuscript.
literature cited
Bairoch, A., and R. Apweiler.
Cao, Y., J. Adachi, and M. Hasegawa.
Dayhoff, M. O., R. M. Schwartz, and B. C. Orcutt.
Duret, L., D. Mouchiroud, and M. Gouy.
Gatesy, J.
Goodman, M., C. A. Porter, J. Czelusniak, S. L. Page, H. Schneider, J. Shoshani, G. F. Gunnell, and C. P. Groves.
Graur, D.
Graur, D., L. Duret, and M. Gouy.
Janke, A., X. Xu, and U. Arnason.
Jones, D. T., W. R. Taylor, and J. M. Thornton.
Kimura, M.
Kuma, K., and T. Miyata.
Li, W.-H.
Li, W.-H., M. Gouy, P. M. Sharp, C. O'hUigin, and Y.-W. Yang.
Nie, N. H., C. H. Hull, J. G. Jenkins, K. Steinbrenner, and D. H. Bent.
Robinson, M., F. Catzeflis, J. Briolay, and D. Mouchiroud.
Shimamura, M., H. Yasue, K. Ohshima, H. Abe, H. Kato, T. Kishiro, M. Goto, I. Munechika, and N. Okada.
Shoshani, J., C. P. Groves, E. L. Simons, and G. F. Gunnell.
Thompson, J. D., D. G. Higgins, and T. J. Gibson.
Ursing, B. M., and U. Arnason.
Yang, Z.
Yang, Z., S. Kumar, and M. Nei.
Zhang, J., and M. Nei.


