


Abstract
Objective. To determine the efficacy of a 12-week individualized home-based exercise programme on physical functioning, pain severity and psychological distress for women with fibromyalgia (FM).
Methods. Seventy-nine women with a primary diagnosis of FM were randomized to a 12-week individualized home-based moderate-intensity exercise programme or to a usual care control group. Outcomes were functional capacity (Fibromyalgia Impact Questionnaire), pain severity and psychological distress. Outcomes were measured at study entry, at the end of the 12-week intervention, and at 3 and 9 months following completion of the intervention.
Results. On the basis of intention-to-treat analyses, a significant improvement in functional capacity at 3 and 9 months following treatment for participants in the exercise group who were more functionally disabled at study entry was observed. At both 3 and 9 months post-treatment, the mean estimated benefit of the intervention was more than 10 points [−12.3 (95% CI, −21.9 to −2.8); −10.8 (95% CI, −21.5 to −0.2)]. Compared with the control group, statistically significant improvements in upper body pain were evident in the exercise group at post-treatment. These between-group differences in upper body pain were maintained at 3 and 9 months post-treatment. No statistically significant group differences on lower body pain and psychological distress were found.
Conclusions. Home-based exercise, a relatively low-cost treatment modality, has the potential to improve important health outcomes in FM.
Fibromyalgia (FM) is a musculoskeletal disorder characterized by widespread pain and tenderness at a number of anatomical locations [1]. Fatigue, sleep disturbance and depressed mood are also common. North American studies suggest that the prevalence estimate of FM is 3.4% for women and 0.5% for men, increasing to 7.1 and 1.1%, respectively, in the 60–69 yr age range [2]. Currently, no treatment for FM is consistently successful. Tricyclic antidepressants provide for some relief of sleep difficulties, but offer limited help for pain and stiffness [3]. Exercise has become increasingly recognized as an important component for the comprehensive management of FM [4, 5].
Since McCain et al.'s seminal study [6] showing improvements in FM symptoms with supervised aerobic exercise, a number of randomized clinical trials (RCTs) have followed, reporting some benefits with several forms of supervised exercise-based programmes in this patient population [7–10].
Previous RCTs evaluating the effects of exercise on FM have been limited by high dropout rates [7], varying exercise intensities [7–11], lack of comparability with respect to outcomes and the absence of longitudinal follow-up to determine if benefits persist. The high dropout rates (up to 40%) in studies of supervised group-based exercise programmes in FM [7] have led researchers to examine alternative exercise approaches, including home-based interventions. The few RCTs conducted to evaluate the efficacy of home-based exercise in FM have yielded mixed results [12, 13]. To date, an individualized home-based programme, delivered and monitored by an exercise specialist, has not been studied.
Our RCT evaluated the efficacy of a 12-week individualized home-based exercise programme on physical functioning, pain severity and psychological distress for women with FM. It was hypothesized that subjects in the home-based exercise group would demonstrate significant improvements in physical and psychological health outcomes compared with those in the control group receiving their usual care. The follow-up period was extended to 1 yr following study entry to determine maintenance of any change.
Methods
Subjects
Women with a confirmed diagnosis of primary FM were recruited from two sources: (i) from hospital or community rheumatologists, directly or through letters of invitation and (ii) through newspaper advertisements. Exclusion criteria were: (i) concomitant diseases which precluded participation in exercise, (ii) contraindication to exercise identified by the examining physician, (iii) recent change in medication (in the previous 2 weeks) and (iv) regular participation in moderate-intensity exercise (more than 30 min three times per week) at the time of study entry [14]. This trial was carried out from June 1999 until November 2002. Approval from the McGill University Health Centre Montreal General Hospital Research Ethics Committee was obtained. All subjects signed informed consent.
Primary outcome measure
The Fibromyalgia Impact Questionnaire (FIQ) [15] is a disease-specific participant-rated measure of global health status developed and validated for use in patients with FM. This widely used instrument uses 10 cm visual analogue scales (VAS) to assess physical functioning, work status, pain, stiffness, fatigue, restfulness on waking, anxiety and depression. Total scores range from 0 to 100, with higher scores indicating more severe symptoms and disability.
Secondary outcome measures
Pain intensity over the past week was assessed by self-report using 10 cm VAS (0 = no pain to 100 = severe pain) [16] in six areas of the body including neck and shoulders, chest, upper/lower back, arms, buttocks and legs. The scores were averaged across body sites to reflect upper and lower body pain intensity (range 0 to 100) with higher scores indicating greater pain.
The Symptom Checklist 90-Revised (SCL-90-R) [17] is a 90-item self-report questionnaire reflecting psychological symptom patterns in the past week. The nine dimensions assessed can be combined into the Global Severity Index (GSI) that reflects the number and intensity of symptoms and is considered the best single indicator of psychological distress [17]. Higher scores on the SCL-90-R indicate greater psychological distress (range 30 to 81), with 50 as the norm and scores above 63 indicative of significant distress [17].
Procedures
All consenting subjects were examined by a rheumatologist to confirm diagnosis of FM [18] at study entry. Subjects were re-examined by the same rheumatologist (blinded to randomization status) 9 months post-treatment. Eligible participants completed a graded maximal exercise stress test, using the Bruce protocol [19], prior to randomization. This test was used to screen participants, determine baseline fitness and individualize the exercise prescription for participants assigned to the exercise group. Fitness was evaluated using time on test and maximal metabolic equivalents (METs) capacity.
All participants were required to complete questionnaires at baseline, post-treatment and at 3 and 9 months post-treatment. All measures (previously described) were administered at each follow-up with the exception of the SCL-90-R, which was not included in the first post-treatment assessment, to ease participant burden. Following the initial test battery and the physician examination, participants were randomly assigned to the exercise group or to a usual care control group using blocked randomization, with random block size. A randomization list was computer generated and kept in the office of one of the investigators (DD) who had no contact with the study participants. The project coordinator was responsible for enrolling participants and was blinded to the allocation sequence. At the point of group assignment for each participant, the project coordinator was provided with the participant's group assignment by the investigator (DD). Participants were then informed of their group allocation by the project coordinator.
Intervention
Exercise group
During the 12-week training phase, participants met four times with the same exercise physiologist. The first visit was approximately 90 min with 30 min follow-ups scheduled at 1, 3, and 9 weeks following the initial visit. The first visit included a review of the results of the cardiovascular fitness test, an overview on the benefits of exercise, an individualized exercise prescription and a supervised exercise session. Principles of warm-up and cool-down, and general exercise precautions were reviewed to minimize the risk of injury.
The exercise prescription was individualized and followed guidelines from the American College of Sports Medicine (ACSM) for developing and maintaining cardiorespiratory fitness [20]. These guidelines suggest that individuals perform 60–120 min/week of aerobic exercise within their target heart rate zone (60–85% of maximal heart rate). Duration is dependent on the intensity of the activity. Programmes were tailored to the individual depending on severity of FM, accessibility to equipment, time constraints and enjoyment of various activities. The intensity of the exercise began at 60–70% of maximal heart rate for all individuals and was gradually increased to as high as 75–85%, depending on the subject's adaptation to the exercise. Stretching and strength exercises were also prescribed, with the amount of each depending on the needs of the subject. The follow-up sessions with the exercise physiologist during the 12-week training phase consisted of providing guidance and support to the subjects, solving any difficulties and gradually increasing the amount and intensity of the exercise.
Participants assigned to the exercise group were provided with a heart rate monitor to ensure proper intensity of training. All subjects were required to maintain an exercise log for the duration of the study and to monitor FM symptoms (i.e. pain) weekly during the 12-week training phase and monthly thereafter. Following each exercise session, participants completed exercise logs which included information pertaining to the type of exercise performed (i.e. stretching, cardiovascular), frequency, duration and heart rate. This methodology has previously been validated [21, 22]. If the logs were not promptly returned the project coordinator telephoned subjects to encourage continued participation. Average weekly adherence rates across the 12-week exercise training phase were calculated as the ratio of the number of exercise sessions reported to the number of sessions prescribed.
Usual care control group
Following randomization, these subjects were contacted by the coordinator to review the questionnaire battery to be completed. Participants were asked to complete an FM symptom measure and to record exercise activity (in case they had engaged in exercise outside study protocol) weekly during the 12-week intervention phase and monthly thereafter.
Statistical analyses
Descriptive statistics used to compare the two trial arms with respect to baseline values included mean, median and standard deviations for quantitative variables and proportions for categorical variables.
We a priori expected that the intervention may have different effects at different assessment times. Therefore, separate analyses were carried out for each of the three post-baseline evaluations (immediately post-treatment, except GSI, and at 3 and 9 months’ follow-up). At each assessment period, separate analyses investigated changes from baseline for the primary outcome (FIQ) and each of the three secondary outcomes (lower and upper body pain and GSI). The main study hypotheses were tested using the intention-to-treat approach. For subjects who were not assessed at a given follow-up, we imputed their last available value for a given outcome (using a last observation carried forward approach).
For each outcome and each assessment time, the estimated effect of the intervention was reported in terms of the unadjusted or adjusted between-groups difference in the mean change from baseline, together with the corresponding 95% confidence interval. Preliminary analyses indicated that the distribution of the post-baseline changes met the normality assumption, which justified the use of parametric statistical tests and models. Several analyses were conducted for each outcome in order to prevent confounding and to assess the robustness of the results. First, a simple independent-groups t-test was carried out to allow an unadjusted comparison of the mean differences for the two groups. Next, the between-groups comparison was adjusted for the baseline value of the respective outcome measure, using the multiple linear regression model, equivalent to a one-way ANCOVA model, with the baseline outcome score and the binary indicator of the treatment group (reduced model). Next, the model was extended to include the baseline values of a priori selected potential confounders: age, body mass index (BMI), physician-scored disease activity (MDVAS), baseline fitness level (MET) and the baseline values of the outcome measure (full model). Additionally, the models for the secondary outcomes were adjusted for the baseline FIQ values, because preliminary analyses indicated a discrepancy between mean pre-treatment FIQ values in the two groups.
Finally we investigated if the effect of the intervention on a given outcome depended on its baseline value by testing a group-by-baseline interaction in both the reduced and the full model. If the interaction was not statistically significant at the 0.05 level, we concluded that there was no evidence of effect modification, and models without the corresponding interaction were used to report and interpret the results. On the other hand, a statistically significant interaction indicated that the response to the intervention varied systematically depending on the initial value. In such cases, we re-ran the analyses addressing a given outcome separately for the subjects with baseline values, respectively, lower than the median and equal to or higher than the median, and reported the effect of the intervention separately for each subgroup.
All primary hypotheses were tested using two-tailed tests with a 0.05 significance level. A total sample size of 80 subjects was determined to ensure 80% statistical power to reject the null hypothesis of no effect of the intervention on the primary outcome (change from baseline FIQ) under the assumption that intervention alone could account for at least 10% of the total variance in this outcome [23]. This sample size also ensures more than 80% power to detect the difference of 10 points between mean changes from the baseline in the two groups, assuming the within-in group standard deviation of changes equals about 15 points (which is consistent with data given in Table 2). No interim analyses were planned. All analyses were done using SAS statistical software.
Results
Table 1 shows that the two trial arms were similar on most baseline characteristics, except that the mean initial FIQ was higher in the exercise group and the proportion of participants who were divorced or separated was lower in the exercise group. To avoid the risk of confounding the between-groups comparisons by this imbalance, all our multivariable analyses were adjusted for baseline FIQ. Figure 1 summarizes participation flow and trial retention. Eighty patients met study criteria and were randomized: 39 to the home-based exercise and 41 to the usual care group.
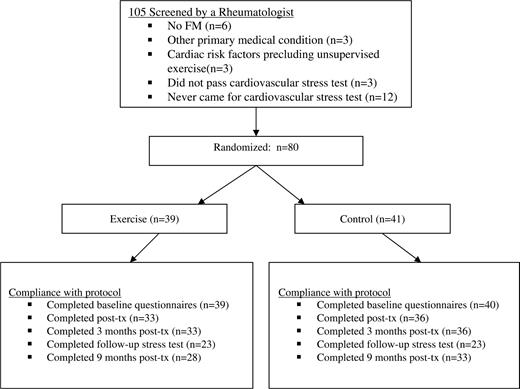
Patient recruitment and randomization.
Patient characteristics at study entry
| Exercise group (n = 39) | Control group (n = 40) | |||
|---|---|---|---|---|
| Demographics [mean (s.d.)] | ||||
| Age (yr) | 49.2 (8.7) | 52.3 (10.8) | ||
| Education (yr) | 14.0 (2.8) | 14.5 (2.6) | ||
| Marital status [n (%)] | ||||
| Single | 9 (23.1%) | 4 (9.7%) | ||
| Married/cohabiting | 25 (64.1%) | 19 (46.3%) | ||
| Divorced/separated | 4 (10.3%) | 16 (39.0%) | ||
| Widowed | 1 (2.6%) | 2 (4.9%) | ||
| Disease-related factors [mean (s.d.)] | ||||
| Disease duration (yr) | 10.5 (8.4) | 11.2 (7.6) | ||
| Time since diagnosis (yr) | 3.8 (4.5) | 4.9 (4.1) | ||
| Physician global assessmenta | 49.3 (18.3) | 46.0 (20.6) | ||
| Tender points | 12.8 (4.6) | 12.6 (4.6) | ||
| BMI | 28.0 (6.0) | 28.1 (6.7) | ||
| METS at stress test | 8.9 (2.0) | 8.9 (2.2) | ||
| Outcome variables [mean (s.d.)] | ||||
| FIQ | 55.1 (15.0) | 48.6 (17.7) | ||
| Upper body pain | 49.5 (15.5) | 47.4 (18.9) | ||
| Lower body pain | 47.0 (25.8) | 47.0 (23.9) | ||
| GSI | 64.3 (6.3) | 64.4 (7.9) | ||
BMI, body mass index; METS, metabolic equivalents; FIQ, Fibromyalgia Impact Questionnaire; GSI, Global Severity Index.
aPhysician Global Assessment of disease activity.
Subjects who completed all the assessments (n = 61; 77%) were similar to those who had missed some post-baseline visits (n = 18; 23%). Adherence to the home-based exercise programme over the 12 weeks was moderate, averaging 67.4% (s.d. = 34.2%) for aerobic exercise and 65.9% (s.d. = 33.8%) for stretching.
For each outcome Table 2 compares the mean unadjusted change between the baseline and each post-baseline assessment for the two trial arms. For the FIQ, the mean changes in the control group are very close to zero, in contrast to a systematic statistically significant decrease for the exercise group (Table 2). Accordingly, the mean decrease from the baseline FIQ in the exercise group is marginally larger than in the control group at the end of the 12-week exercise programme and 3 months later (0.05<P<0.10 for the two-tailed t-test), and the difference is highly significant at 9 months post-treatment (P<0.01). Similarly, there was no systematic change in the control group for upper body pain, while the exercise group reported a statistically significant decrease at each post-baseline assessment, with statistically significant differences between the two groups (Table 2). For lower body pain, however, none of the changes from baseline or of the corresponding between-group differences approached statistical significance (Table 2). Finally, the decreases in psychological distress (GSI) at 3 and 9 months post-treatment were statistically significant only in the exercise group, but the differences between the two groups was not significant (Table 2). In summary, for the FIQ and upper body pain, the between-groups differences are statistically significant and clinically important, corresponding to about 20% of the baseline mean values.
Mean changes from baseline on outcome measures
| Post-treatment | 3 months post-treatment | 9 months post-treatment | |||||||||||||
|---|---|---|---|---|---|---|---|---|---|---|---|---|---|---|---|
| Exercise | Control | Pa | Exercise | Control | Pa | Exercise | Control | Pa | |||||||
| FIQ | −10.1 (−16.5; −3.8) | −2.8 (−8.2; 2.7) | 0.078 | −7.8 (−13.9; −1.7) | −0.04 (−5.2; 5.1) | 0.053 | −10.1 (−16.1; −4.0) | −0.024 (−4.4; 3.9) | 0.009 | ||||||
| UPB | −14.6 (−21.8; −7.3) | −0.87 (−7.26; 5.52) | 0.005 | −10.6 (−17.8; −3.4) | −1.9 (−6.9; 3.2) | 0.048 | −7.9 (−14.3; −1.4) | 2.4 (3.7; 8.45) | 0.022 | ||||||
| LBP | −8.2 (−16.6; 0.2) | −4.7 (−13.4; 4.0) | 0.564 | −8.21 (−15.7; −0.74) | −2.0 (−9.4; 5.4) | 0.237 | −5.6 (−13.3; 2.2) | −0.29 (−8.6; 8.0) | 0.351 | ||||||
| GSI | −0.017 (−0.3; −0.04) | −0.07 (−0.2;0.05) | 0.257 | −0.16 (−0.28; 0.35) | −0.09 (−0.21; 0.03) | 0.385 | |||||||||
Change scores from baseline: mean (95% confidence interval). FIQ, Fibromyalgia Impact Scale; UBP, upper body pain; LBP, lower body pain; GSI, Global Severity Index.
aIndependent-group t-tests of the difference in the mean change from baseline between the two trial arms.
Table 3 summarizes the results of two different multiple regression models. The first model adjusts the mean between-groups difference for the baseline values of the respective outcome. The second model adjusts additionally for the baseline values of age, BMI, baseline fitness level (MET), physician global assessment of disease activity (PGA), and baseline FIQ. For each model, Table 3 shows the adjusted difference between mean change from baseline in the two groups, separately for each assessment. Adjusting for the difference in baseline FIQ reduces the estimated between-groups difference for the FIQ (Table 3), compared to un-adjusted analyses in Table 2. In contrast, at each of the three post-baseline evaluations the mean reduction in upper body pain remains statistically significantly larger in the exercise group versus the control group, even after adjustment (Table 3). For lower body pain and for psychological distress (GSI), the multivariable analyses in Table 3 confirm the absence of any statistically significant effect of the intervention.
Results of the multiple linear regression modelling of the effect of the intervention, adjusting for baseline values and other potential confounders
| Outcome | Model | Post-treatment (95% CI)a | 3 months post-treatment (95% CI)a | 9 months post-treatment (95% CI)a |
|---|---|---|---|---|
| FIQ | Baselineb | −4.4 (−12.2; 3.3) | −4.9 (−12.2; 2.5) | −7.4* (−14.2; −0.6) |
| Fullc | −3.8 (−11.6; 3.9) | −3.8 (−11.1; 3.5) | −6.1 (−12.9; 0.6) | |
| UPB | Baselineb | −12.4** (−20.9; −4.0) | −7.6* (−15.1; −0.04) | −9.6* (−18.1; −1.1) |
| Fullc | −12.9** (−21.8; −4.0) | −7.6 (−15.5; 0.20) | −11.0* (−19.9; −2.2 | |
| LBP | Baselineb | −3.5 (−13.9; 7.0) | −6.2 (−15.3; 2.9) | −5.3 (−15.3; 4.7) |
| Fullc | −2.9 (−13.9; 8.1) | −5.6 (−15.2; 4.0) | −5.4 (−15.8; 5.0) | |
| GSI | Baselineb | d | −0.12 (−0.3; 0.05) | −0.08 (−0.2; 0.1) |
| Fullc | d | −0.13 (−0.3; 0.05) | −0.07 (−0.2; 0.1) |
FIQ, Fibromyalgia Impact Scale; UBP, upper body pain; LBP, lower body pain; GSI, Global Severity Index.
a95% confidence interval (CI) for the mean difference in changes from baseline.
bMean estimated group differences for changes from baseline after adjusting for baseline values.
cMean estimated group differences for changes from baseline after adjusting for baseline values, FIQ, age, body mass index, physician global assessment and baseline METS on stress test.
dNot assessed.
*P<0.05, **P ≤ 0.01.
To assess if the effect of the exercise programme depended on the baseline level of a given outcome, we tested the statistical significance of the group-by-baseline interaction in the respective multiple regression model. For FIQ, at both post-treatment assessments, the interactions are statistically significant (both cases, data not shown). The coefficients for these interactions indicate that the benefits of the exercise programme, in terms of reduction in the FIQ, increase with an increasing baseline FIQ (data not shown). No statistically significant baseline interactions are found for other outcomes (data not shown).
Statistically significant interactions for the FIQ suggest that the impact of the intervention on this outcome should be assessed separately for subjects with relatively low and relatively high initial FIQ scores. Accordingly, Table 4 reports the results of the subgroup analyses, with separate multiple regression modelling of the changes in FIQ for subjects with the baseline FIQ (i) below the overall baseline median of 54 and (ii) equal to or higher than 54. For the subgroup with low initial FIQ, the effect of the intervention is not statistically significant, regardless of the assessment time (Table 4). For the subgroup with higher baseline FIQ, the adjusted between-groups difference is not statistically significant immediately post-treatment, but the exercise programme results in a statistically significant reduction from the initial FIQ at both 3 and 9 months post-treatment. At both times, the mean estimated benefit of the intervention is more than 10 points (Table 4).
FIQ changes as a function of high/low FIQ status at baseline
| Baseline FIQ | Post-treatment (95% CI)a | 3 months post-treatment (95% CI)a | 9 months post-treatment (95% CI)a |
|---|---|---|---|
| FIQ<54 | −3.5 (−14.2; 7.2) | 3.4 (−8.3; 15.1) | −0.4 (−9.9; 9.1) |
| FIQ ≥ 54 | −5.7 (−17.8; 6.4) | −12.3* (−21.9; −2.8) | −10.8* (−21.5; −0.2) |
| Baseline FIQ | Post-treatment (95% CI)a | 3 months post-treatment (95% CI)a | 9 months post-treatment (95% CI)a |
|---|---|---|---|
| FIQ<54 | −3.5 (−14.2; 7.2) | 3.4 (−8.3; 15.1) | −0.4 (−9.9; 9.1) |
| FIQ ≥ 54 | −5.7 (−17.8; 6.4) | −12.3* (−21.9; −2.8) | −10.8* (−21.5; −0.2) |
Mean estimated group difference for changes from the baseline value of the FIQ, adjusted for baseline values of FIQ, age, body mass index, physician global assessment and METS on stress test.
a95% confidence interval (CI) for the mean difference in changes from baseline.
*P<0.05.
Discussion
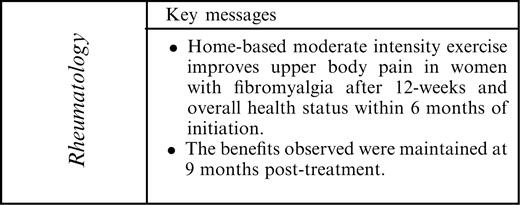
We found that a 12-week individualized home-based moderate-intensity exercise programme is effective in significantly improving health status, especially for women with FM who are more functionally disabled. Our results indicate that it may take an additional 3 months to achieve improvements in overall health status with exercise, while improvements in upper body pain can be demonstrated 12 weeks after initiation of exercise. The benefits observed were maintained at the 9-month post-treatment follow-up.
Improvements on overall health status have been found in some exercise studies [8, 24], but not others [7, 13, 25]. While some studies have shown improvements by the end of an 8- to 12-week exercise intervention [8, 26], others note significant benefits only at 6–12 months following study entry [24]. The pattern of change in the FIQ over our study period suggests that the benefits of exercise for improving functioning in FM patients is achieved gradually, with notable gains by 9 months. This may elucidate the failure to show improvement in other studies that have assessed outcomes immediately following the intervention phase [13, 27]. Moreover, our results show that the benefits of exercise for health status are most noticeable in women with FM who are more functionally disabled at the onset of the exercise programme. One possible explanation for this finding was that adherence to the exercise programme was better for the more disabled FM subjects (Dobkin et al., submitted).
On the other hand, upper body pain decreased significantly following the 12-week exercise intervention for all women, with improvements maintained at the 9-month post-treatment follow-up. These findings suggest that exercise improves an important clinical manifestation of FM. In comparison with other clinical manifestations and functional ability, pain intensity has been less amenable to change in other clinical trials with FM patients. Yet studies evaluating the effects of exercise on pain intensity in FM have typically used a single item visual analogue scale to assess overall pain [12, 25, 27] rather than assessing pain at various body sites. This may explain the inconsistent findings in the literature regarding the effects of exercise on pain. Our findings indicate that for women with FM, moderate-intensity exercise improves upper (i.e. neck, shoulders, chest) body pain, although the reduction of lower body pain was non-significant.
While only a subgroup of FM patients returned for the follow-up cardiovascular fitness evaluations, aerobic fitness did not change for patients in the exercise condition despite improvements in functional ability and pain intensity. Other studies have also observed improvement in functional ability and clinical manifestations, independent of improvements in aerobic fitness levels [7, 28]. While there is currently no consensus on the most optimal measure of fitness in FM, the measure employed herein has, in previous studies of exercise in FM, been shown to be responsive to changes in fitness levels [7, 25, 26, 29].
Compatible with other exercise intervention studies, subjects’ psychological distress did not change [26, 29]. It has been suggested that the psychological benefits of exercise are dependent on improvements in aerobic fitness [30]. In our study, cardiovascular fitness levels did not change for patients in the exercise group. Studies where FM patients had improvements in psychological variables following exercise have typically shown concurrent improvements in physiological fitness [24]. Differences in exercise format may also account for the inconsistent findings. Studies demonstrating exercise-induced psychological benefits have evaluated group rather than home-based exercise programmes [24]. Perhaps exercising in a group setting improves mood through increased social support. Home-based exercise programmes tend to be more isolating. It has recently been indicated that multimodal, rather than single-modal interventions (i.e. cognitive behavioural therapy and exercise) are needed to induce improvements across a broader range of FM-related symptoms [31, 32].
We cannot rule out the occurrence of effects of subject expectancy, given that our study did not include an attention-control group, and given that the main outcome measures were obtained through self-report. While the groups did not differ on an objective measure of physical fitness (exercise stress test), aerobic fitness has previously been found to be only weakly related to health status and severity of pain [9]. If our findings were due to a general expectancy effect, we would have observed improvements across outcome measures, which we did not. Women in this study were sufficiently motivated to volunteer to participate in an exercise trial. The extent to which these findings can be generalized to all persons with FM is unknown.
In summary, for FM patients in the exercise group who were more functionally disabled at study entry, we found improvements in functional capacity by 3 months post-treatment. On the other hand, improvements in upper body pain were found for all women with FM in the exercise group, and were observed immediately following the 12-week intervention. The improvements observed with exercise were sustained at the 9-month post-treatment follow-up. Our results provide further evidence for the efficacy of exercise in FM. Home-based exercise is a relatively low-cost treatment that has the potential to improve important health outcomes for patients with FM. Importantly, these results contradict FM patients’ fears that exercise may worsen pain.
This study was funded by The Arthritis Society (#TAS99/0134).
The authors have declared no conflicts of interest.
References
Wolfe F, Anderson JP, Harkness D et al. Health status and disease severity in fibromyalgia: results of a six-center longitudinal study.
Wolfe F, Ross K, Anderson J, Russell IJ, Hebert L. The prevalence and characteristics of fibromyalgia in the general population.
Arnold LM, Keck PE, Welge JA. Antidepressant treatment of fibromyalgia: a meta-analysis and review.
Sim J, Adams N. Systematic review of randomized controlled trials of nonpharmacological interventions for fibromyalgia.
Mannerkorpi K, Iversen MD. Physical exercise in fibromyalgia and related syndromes.
McCain GA, Bell DA, Mai FM, Halliday PD. A controlled study of the effects of a supervised cardiovascular fitness training program on the manifestations of primary fibromyalgia.
Martin L, Nutting A, Macintosh BR, Edworthy SM, Butterwick D, Cook J. An exercise program in the treatment of fibromyalgia.
Richards SCM, Scott DL. Prescribed exercise in people with fibromyalgia: parallel group randomized controlled trial.
Valim V, Oliveira L, Suda A et al. Aerobic fitness effects in fibromyalgia.
Burckhardt CS, Mannerkorpi K, Hedenberg L, Bjelle A. A randomized, controlled clinical trial of education and physical training for women with fibromyalgia.
Boissevain MD, McCain GA. Toward an integrated understanding of fibromyalgia syndrome. l. Medical and pathophysiological aspects.
Buckelew SP, Conway R, Parker JC et al. Biofeedback/relaxation training and exercise interventions for fibromyalgia: a prospective trial.
Schachter CL, Busch AJ, Peloso PM, Sheppard MS. Effects of short versus long bouts of aerobic exercise in sedentary women with fibromyalgia: a randomized controlled trial.
Pate RR, Pratt M, Blair SN, Haskell WL, Macera CA. Physical activity and public health. A recommendation from the Centres for Disease Control and Prevention and the American College of Sport Medicine.
Burckhardt CS, Clark SR, Bennett RM. The Fibromyalgia Impact Questionnaire: development and validation.
Price DD, McGrath PS, Rafii A, Bucklingham B. The validation of visual analogue scales as ratio scale measures for chronic experimental pain.
Derogatis LR. SCL-90-R.
Wolfe F, Smythe HA, Yunus MB. The American College of Rheumatology 1990 criteria for the classification of fibromyalgia: report of the multicenter criteria committee.
Bruce RA, Kusumi F, Hosmer D. Maximal oxygen uptake and nomographic assessment of functional aerobic impairment in cardiovascular disease.
American College of Sports Medicine. The recommended quantity and quality of exercise for developing and maintaining cardiorespiratory and muscular fitness, and flexibility in health adults.
King AC, Haskell WL, Taylor CB, Kraemer HC, DeBusk RF. Group- vs home-based exercise training in healthy older men and women.
King AC, Kiernan M, Pman RF, Kraemer HC, Hull M, Ahn D. Can we identify who will adhere to long-term physical activity? Signal detection methodology as a potential aid to clinical decision making.
Cohen J.
Gowans SE, deHueck A, Voss S, Silaj A, Abbey SE, Reynolds WJ. Effect of a randomized, controlled trial of exercise on mood and physical function in individuals with fibromyalgia.
van Santen M, Bolwijn P, Verstappen F et al. A randomized clinical trial comparing fitness and biofeedback training versus basic treatment in patients with fibromyalgia.
Redondo JR, Justo CM, Moraleda FV et al. Long-term efficacy of therapy in patients with fibromylgia: a physical exercise-based program and a cognitive-behavioral approach.
Ramsay C, Moreland J, Ho M, Walker SE, Pullar T. An observer-blinded comparison of supervised and unsupervised aerobic exercise regimens in fibromyalgia.
Meyer BB, Lemley KJ. Utilizing exercise to affect the symptomology of fibromyalgia: a pilot study.
Wigers SH, Stiles TC, Vogel PA. Effects of aerobic exercise versus stress management treatment in fibromyalgia: a 4.5 year prospective study.
DiLorenzo TM, Bargman EP, Stucky-Ropp RC, Brassington GS, Frensch PA, LaFontaine T. Long-term effects of aerobic exercise on psychological outcomes.
Williams DA. Psychological and behavioural therapies in fibromyalgia and related syndromes.
Author notes
1Division of Clinical Epidemiology, McGill University Health Centre, 2Department of Medicine and 3Department of Epidemiology and Biostatistics, McGill University and 4Department of Rheumatology, McGill University Health Centre, Montreal, Canada.

Comments