


Abstract
Chronic arsenic exposure is known to produce arsenicosis and cancer. To ascertain whether perturbation of methylation plays a role in such carcinogenesis, the degree of methylation of p53 and p16 gene in DNA obtained from blood samples of people chronically exposed to arsenic and skin cancer subjects was studied. Methylation-specific restriction endonuclease digestion followed by polymerase chain reaction (PCR) of gene p53 and bisulfite treatment followed by methylation-sensitive PCR of gene p16 have been carried out to analyze the methylation status of the samples studied. Significant DNA hypermethylation of promoter region of p53 gene was observed in DNA of arsenic-exposed people compared to control subjects. This hypermethylation showed a dose-response relationship. Further, hypermethylation of p53 gene was also observed in arsenic-induced skin cancer patients compared to subjects having skin cancer unrelated to arsenic, though not at significant level. However, a small subgroup of cases showed hypomethylation with high arsenic exposure. Significant hypermethylation of gene p16 was also observed in cases of arsenicosis exposed to high level of arsenic. In man, arsenic has the ability to alter DNA methylation patterns in gene p53 and p16, which are important in carcinogenesis.
Environmental exposure to inorganic arsenic is a major health hazard in many countries. West Bengal in India is one of the most affected areas in the world, as large number of people drink arsenic-contaminated subsoil water. Health effects due to chronic arsenic toxicity include various skin manifestations like pigmentation, keratosis, and systemic diseases like lung and liver disease, neuropathy, vascular abnormalities, and skin, bladder, and lung cancer (GuhaMazumder, 2001; GuhaMazumder et al., 1998; National Research Council, 1999). From epidemiological study in West Bengal, a clear dose-response relationship between the prevalence of skin lesions and level of arsenic in water was observed (GuhaMazumder et al., 1998). Though the elevated risk of cancer associated with chronic arsenic exposure is well established (IARC, 2004; Waalkes, 1995), the mechanism of carcinogenesis is not clear. Arsenic is a poor mutagen (Jacobson and Moltalbano, 1985; Lee et al., 1985; Rossman et al., 1980) and does not induce significant point mutation. However, its effect on DNA repair, sister chromatid exchange, aneuploidy, and micronuclei development has been documented (IARC, 2004).
After entering the body, inorganic arsenic (As) is methylated to monomethyl arsonic acid (MMA) and dimethylarsinic acid (DMA) and excreted through urine. This biotransformation is effected by the methyltransferase enzyme (Cyt19), using S-adenosylmethionine (SAM) as the methyl group donor, in presence of endogenous reductase (Lin et al., 2002; Hayakawa et al., 2005). Omega class of GST enzymes are involved in the reductase activity, and MMA(V) reductase is the same as GST O1-1 (Zakharyan et al., 2001). Arsenic methylation is presumed to occur at high level in liver, which is a suspected target organ for arsenic-induced carcinogenesis (Donohue and Abernathy, 2001; Goering et al., 1999; Vahter, 1990). However, expression of Cyt19 is higher in some other tissues like kidney or testis.
It has been hypothesized that alteration of DNA methylation is involved in arsenic-induced carcinogenesis. This mechanism has been proposed because the SAM/methyltransferase pathway for biotransformation of arsenic overlaps with the DNA methylation pathway, in which donation of methyl groups from SAM to cytosine produces 5-methylcytosine in DNA. It is known that the regulation of expression of many genes is controlled by the extent of methylation of cytosine, often in long stretches of cytosine-rich sequences known as CpG islands, especially in the promoter regions.
Various workers have tested the hypothesis of altered methylation on DNA extracted from cultured cell lines exposed to different doses of arsenic compounds. Mass and Wang (1997) demonstrated hypermethylation in the CpG island of p53 tumor suppressor gene in arsenic-exposed murine cell lines. Subsequently, both hyper- and hypomethylation of DNA have been demonstrated by Zhong and Mass (2001) using methyl-sensitive PCR on human lung and kidney cell lines.
We report the results of a study on a cross-section of arsenic-exposed population of West Bengal, India. Blood samples were collected from cases showing evidence of arsenicosis and arsenic-related cancer. Two tumor suppressor genes, p53 and p16, have been chosen for this study. p53 gene, known as “guardian of the genome” protects the genome against insults and induces growth arrest at G1 and apoptosis at G2. Gene p16 has also been included in this study, as it also induces growth arrest at G1/S in damaged cells by binding to CDK 4/6, thus working on the Retinoblastoma-1 gene–mediated pathway (Lewin, 2004). In one group of cases, promoter region of p53 has been studied using the methyl sensitive restriction enzyme HpaII. In another group, promoter region of p16 has been studied by bisulfite modification of the DNA followed by methyl-sensitive PCR analysis. Hypermethylation of promoter region of both the genes were observed in people suffering from arsenicosis. Also, promoter region of p53 gene was found to be hypermethylated in individuals with arsenic-induced skin cancer compared to those with skin cancer unrelated to arsenic exposure.
MATERIALS AND METHODS
Subjects.
Subjects of this study were taken from the arsenic clinic of Institute of Post Graduate Medical Education and Research, Kolkata, India. The arsenic clinic is a tertiary referral center. All the cases recruited were referred cases from South 24 Parganas, one of the worst affected districts of West Bengal. Epidemiological studies were being carried out in this district since 1995 (GuhaMazumder et al., 1998; Haque et al., 2003). Arsenic exposure data of all these people were therefore known to the investigators. Criteria for diagnosis of arsenicosis were based on parameters described earlier (GuhaMazumder, 2001). Briefly these are as follows.
(1) History of taking arsenic contaminated water (>50 μg/l) for more than 6 months.
(2) Presence of characteristic skin manifestation of chronic arsenic toxicity:
Hyperpigmentation—It may be diffuse, spotty or blotchy, scattered all over the body and limbs in bilaterally symmetrical fashion.
Hypopigmentation—Spotty hypopigmentation all over the body, distributed in bilaterally symmetrical fashion.
Keratosis—Hyperkeratosis or thickening of palm and sole. In severe cases nodularity of palm and sole or dorsum of feet.
The skin lesions did not simulate with any other known skin disease.
Skin cancer (arsenical and nonarsenical).
Cancer diagnosis was based on histological evidence of malignancy in the biopsy tissues obtained from affected (nodular and/or ulcerated) areas of the body. All cancer cases studied were found to be suffering from squamous cell carcinoma.
Cases of arsenic-induced skin cancer were recruited from arsenic clinic, while skin cancer subjects unrelated to arsenic were recruited from the dermatology outpatients department of the institute.
Control selection.
The studies were carried out in two phases. In phase I, methylation of p53 promoter region was studied using methyl-sensitive restriction endonuclease.
In phase II, methylation of p16 gene was studied by bisulfite modification of the DNA followed by methyl sensitive PCR.
For phase I study population, controls were living in the same area from where cases came to the arsenic clinic. They were drinking water from tube wells having arsenic level less than 50 μg/l, and they did not have any skin lesion (Group A). In phase II study population, a group of volunteers living in non-arsenic-affected areas and using surface water were used as control (Group O).
History of arsenic exposure of each participant was obtained in detail, including duration of intake of water from the source. Water samples were collected from tube wells used for drinking and cooking purposes by each participant. Level of arsenic in water was determined by atomic absorption spectrophotometer with hydride generation system (AAS) and expressed as μg/l. Participants have been divided into groups, as shown in Table 1, according to the concentration of arsenic in their drinking water.
Participant Groups, According to Arsenic Concentration in Drinking Water
Group | Arsenic level in drinking water (μg/l) |
|---|---|
| Group A control | <50 |
| Group B | 51–250 |
| Group C | 251–500 |
| Group D | 501–1000 |
| Group E (Arsenic-associated skin cancer) | 300–1000 |
| Group F (Nonarsenic cancer) | <50 |
| Group O | uses surface water from non-arsenic-exposed area |
History regarding smoking habit and occupation were taken from each participant.
In all, there were 96 samples in phase I and 62 in the phase II experiments, of which 24 and 11 were controls, respectively.
Written informed consent was obtained from all subjects before recruitment in this study. Institutional ethical clearance was also obtained. The name of the institute where human studies were carried out is Institute of Post Graduate Medical Education and Research, Kolkata (IPGME & R), which is run by the government of West Bengal, a state government within the framework of Republic of India. Ethical principles followed by the institute are guided by rules as formulated by Indian Council of Medical Research, and these are in agreement with Helsinki rules.
During field survey as a part of an epidemiological study, people exposed to arsenic were referred to the arsenic clinic of IPGME & R for further investigation and assessment of their illness, if any. The study subjects gave consent to undergo investigations, including blood and other tests at arsenic clinic of the hospital for ascertaining the nature of their illness and also for ascertaining DNA methylation. Results of blood tests (e.g., hemoglobin value, liver function test, chest X-ray, and CT scan) were given to the subjects who showed evidence of disease, when they attended the clinic.
Collection of blood samples.
Blood samples were collected in vials containing anticoagulant EDTA and kept at −20°C until subsequent analysis.
DNA isolation from blood.
DNA was extracted from whole blood by conventional chloroform extraction method using 0.01% SDS and proteinase K (0.1 mg/ml) (Miller et al., 1988).
Analysis of methylation status of CCGG sites by methyl-sensitive PCR.
The promoter region of p53 gene contains two CCGG sites beginning at bases 703 and 883 (Gen Bank accession no: X 54156). The Hpa II restriction enzyme will cleave CCGG sequences, which are not methylated at the internal or external cytosine. Msp I is the isoschizomer of Hpa II, which will cleave the CCGG sequence irrespective of its methylation status. Therefore, Msp I is used as a control for Hpa II digestion.
PCR amplification of the sequence in region (638–978) cannot be performed if one of the CCGG sequences has been cleaved. DNA methylated on both the CCGG sequences is resistant to Hpa II digestion and can be amplified by PCR.
Concentration and purity of DNA was estimated by determining optical density at 260nm and 280 nm. 300 ng of genomic DNA (OD 260/280 > 1.8) was digested with 2 units of Hpa II or Msp I at 37°C for overnight. Enzyme was inactivated at 95°C for 10 mins. A control was also taken which contained no Hpa II or Msp I. Digested products were then ethanol precipitated.
An aliquot of 100 ng of the digested product was then used as a template in PCR reaction (Mass and Wang, 1997) with 5 μci of α-32P-dCTP (4000 Ci/mmol). The PCR product was subjected to electrophoresis on 2% agarose gel. Taking the control band of 340 bp as a guide, analogous bands were excised, melted in 0.1N HCl, and the 32P content was quantified by scintillation counting. Count in the Msp I-digested DNA band was taken as the background. Normalized value of increase of count in the Hpa II-digested DNA band over the background was considered as a measure of the level of template DNA present in the HpaII-digested sample and is indicative of methylation level in the DNA. Control experiments (data not shown) have been performed to ensure that amplification is at linear stage in the PCR regime used.
Bisulfite treatment of DNA and methyl sensitive PCR.
Sodium bisulfite modification of DNA to transform the unmethylated cytosines to uracil was done according to Herman et al. (1996) with some modification. 800 ng of genomic DNA was diluted to 30 μl with sterile distilled water. Diluted DNA was then subjected to alkali denaturation with 2.25 μl of 2 M NaOH for 10 min at 37°C. It was then incubated at 50°C for 4 h after mixing with 15 μl of 10 mM freshly prepared hydroquinone and 260 μl of 3 M freshly prepared sodium bisulfite (pH adjusted to 5.0 by NaOH). After incubation, the DNA was cleaned using 1 ml of DNA Wizard clean-up resin, and then the modification was completed by adding NaOH. Finally, the DNA was precipitated using polyethylene glycol and dissolved in sterile distilled water. This modified DNA was then subjected to PCR amplification by methylation-specific and unmethylation-specific primers as described earlier (Herman et al., 1996).
The PCR products electrophoresed on 2% agarose gel were then analyzed densitometrically (Kodak Digital Science ID). The ratio of the amplified product generated using methylation-specific to unmethylation-specific primers gives a measure of degree of methylation. Initial standardization with varying amounts of starting DNA established that the amplification was at linear stage at the conditions used (data not shown).
Statistical analysis.
For finding the significance of the difference in degree or extent of DNA methylation between different arsenic exposure groups, we assumed no particular pattern of distribution of data. We therefore performed two-tail median test (Das and Das, 1998), which is a nonparametric alternative of Student t-test, for widely distributed data. For median test, the raw data of each group were compared with the data of control group, and composite median were calculated in each case. Then the number of data in each group and that of the control group greater than or less than the respective composite median value is tabulated in 2 × 2 contingency table, and the chi square value was calculated after Yate's correction wherever necessary. The calculated chi square value was then compared to critical chi square value at different level of significance.
RESULTS
Characteristics of subjects belonging to the two study populations with regard to age, sex, smoking habit, and duration of arsenic exposure, along with their methylation status are given in Tables 2 and 3. The majority of people in both study populations are males belonging to the age group of 20 to 60 years. There are more smokers than nonsmokers among both the study populations. Duration of arsenic exposure varied between 9.5 to 19 years. Data regarding methylation of promoter region of p53 gene are plotted in Figure 1a. In the majority of cases, the methylation values are found to be increasingly higher as the dose of arsenic exposure increases.
Demographic Data and Methylation Status of the p53 Gene Study Groups Exposed to Different Concentration of Arsenic in Drinking Water
Age group | Sex | Group A <50 μg/l | Group B 51–250 μg/l | Group C 251–500 μg/l | Group D >500 μg/l | Group E 300–1000 μg/l (arsenic-induced skin cancer) | Group F <50 μg/l (nonarsenic cancer) |
|---|---|---|---|---|---|---|---|
| <20 years | Male | n = 2 | n = 1 | n = 2 | n = 0 | n = 0 | n = 0 |
| 0.08, 0.19 | 0.66 | 1.34, 1.62 | |||||
| Female | n = 0 | n = 0 | n = 2 | n = 0 | n = 0 | n = 0 | |
| 1.50, 1.45 | |||||||
| 21–40 years | Male | n = 6 | n = 1 | n = 5 | n = 5 | n = 3 | n = 2 |
| 0.03, 0.20, 0.23, 0.25, 0.42, 0.15 | 1.95 | 1.50, 2.78, 5.00, 0.14↓, 0.06↓ | 1.95, 2.04, 2.46, 0.18↓, 4.3 | 0.85, 1.09, 1.32 | 2.06, 0.79 | ||
| Female | n = 3 | n = 1 | n = 0 | n = 2 | n = 3 | n = 0 | |
| 0.37, 0.45, 0.15 | 0.72 | 0.16↓, 2.56 | 1.00, 1.62, 1.09 | ||||
| 41–60 years | Male | n = 4 | n = 2 | n = 5 | n = 3 | n = 4 | n = 5 |
| 0.3, 0.27, 0.27, 0.18 | 0.78, 2.16 | 1.56, 0.25↓, 0.258↓, 0.06↓, 2.4 | 2.85, 4.46, 0.01↓ | 1.42, 3.08, 2.09, 2.09 | 2.23, 1.61, 0.75, 0.125, 0.06↓ | ||
| Female | n = 5 | n = 2 | n = 4 | n = 2 | n = 1 | n = 0 | |
| 0.62, 0.08, 0.09, 0.32, 0.19 | 0.9, 1.41 | 4.66, 1.95, 0.05↓, 0.12 ↓ | 4.45, 2.7 | 2.55 | |||
| >60 years | Male | n = 4 | n = 3 | n = 0 | n = 1 | n = 4 | n = 2 |
| 0.7, 1.22, 0.32, 0.42 | 4.00, 0.05↓, 0.08↓ | 2.15 | 2.20, 2.23, 1.62, 1.60 | 0.23↓, 0.25↓ | |||
| Female | n = 0 | n = 2 | n = 0 | n = 2 | n = 1 | n = 2 | |
| 0.19↓, 1.46 | 0.07↓, 0.25↓ | 2.11 | 0.42, 0.44 | ||||
| Smoking status | Smoker | n = 8 | n = 4 | n = 9 | n = 5 | n = 7 | n = 5 |
| Nonsmoker | n = 12 | n = 5 | n = 8 | n = 9 | n = 5 | n = 5 | |
| Ex-smoker | n = 4 | n = 3 | n = 1 | n = 1 | n = 4 | n = 1 | |
| Average duration of exposure (yrs) | 15.53 | 19 | 17 | 10.86 | 19.21 | 14.33 | |
| Total no. of samples | 24 | 12 | 18 | 15 | 16 | 11 |
Note. Value less than control group median (0.26 in p53 gene study and 0.138 in p16 gene study) is considered as hypomethylation. Hypomethylation cases are marked by (↓). n = sample number.
Demographic Data and Methylation Status of the p16 Gene Study Groups Exposed to Different Arsenic Concentration in Drinking Water
Age group | Sex | Group O normal | Group A 0–50 μg/l | Group B 51–250 μg/l | Group C 251–500 μg/l | Group D >500 μg/l | Group E 300–1000 μg/l (arsenic skin cancer) |
|---|---|---|---|---|---|---|---|
| <20 years | Male | n = 0 | n = 0 | n = 0 | n = 0 | n = 1 | n = 0 |
| 0.857 | |||||||
| Female | n = 0 | n = 0 | n = 0 | n = 0 | n = 1 | n = 0 | |
| 0.900 | |||||||
| 21–40 years | Male | n = 9 | n = 5 | n = 1 | n = 4 | n = 2 | n = 0 |
| 0.053, 0.056, 0.067 0.072, 0.128, 0.138, 0.168, 0.214, 0.278 | 0.095↓, 0.158, 0.175, 0.290, 0.296 | 0.739 | 0.0863↓, 0.186, 4.92, 3.611 | 0.326, 1.131 | |||
| Female | n = 2 | n = 0 | n = 3 | n = 4 | n = 2 | n = 0 | |
| 0.219, 0.262 | 0.704, 0.554, 0.131↓ | 3.62, 0.953, 0.792, 2.503 | 0.348, 1.289 | ||||
| 41–60 years | Male | n = 0 | n = 1 | n = 1 | n = 2 | n = 4 | n = 4 |
| 0.369 | 0.169 | 0.202, 5.67 | 1.274, 1.350, 1.806, 1.923 | 13.26, 1.131, 15.88, 4.16 | |||
| Female | n = 0 | n = 1 | n = 0 | n = 2 | n = 0 | n = 2 | |
| 0.466 | 4.24, 2.489 | 0.112↓, 0.101↓ | |||||
| >60 years | Male | n = 0 | n = 0 | n = 4 | n = 0 | n = 3 | n = 0 |
| 0.181, 0.501, 0.530, 0.399 | 1.468, 2.303, 7.669 | ||||||
| Female | n = 0 | n = 1 | n = 0 | n = 1 | n = 2 | n = 0 | |
| 0.567 | 0.901 | 3.770, 2.062 | |||||
| Smoking status | Smoker | n = 8 | n = 6 | n = 5 | n = 6 | n = 9 | n = 3 |
| Nonsmoker | n = 2 | n = 2 | n = 3 | n = 7 | n = 5 | n = 2 | |
| Ex-smoker | n = 1 | n = 0 | n = 1 | n = 0 | n = 1 | n = 1 | |
| Average duration of exposure | 12 years | 7.71 years | 10.86 years | 9.51 years | 14 years | ||
| Total no. of Samples | 11 | 8 | 9 | 13 | 15 | 6 |
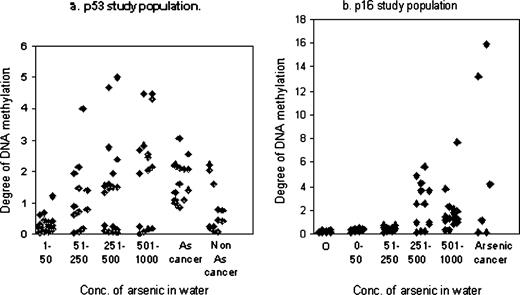
Distribution of DNA methylation status in people exposed to different arsenic concentration (measured in μg/l) of arsenic in drinking water with and without skin malignancy. “O” denotes surface water. In (a) methylation status is normalized value of increase in incorporated count in HpaII band over background. In (b) it is the ratio of amplification products with methylation-specific primer over unmethylation-specific primers.
The values are also distributed in the higher range in case of arsenic-induced skin cancer compared to those with skin cancer unrelated to arsenic. However, data of a small group of people who are exposed to high level of arsenic (251–1000 μg/l) have had distribution of their methylation value in the lower range of group.
Figure 1b shows the methylation data of p16 gene study population. Increasing values of methylation are also seen with higher concentration of arsenic in water. Hypermethylation was also seen in some cases of arsenic-induced cancer. Statistical analysis (Table 4) using nonparametric median test indicates that there is a significant hypermethylation of promoter region of p53 gene compared to control subjects (p < 0.001) in the higher exposure groups C and D. The hypermethylation of p53 gene showed a dose-response pattern. Further, hypermethylation was also observed in individuals with arsenic-induced skin cancers compared to those with skin cancer unrelated to arsenic (p < 0.2). However, a small number of people with high arsenic exposure showed hypomethylation. Significant hypermethylation (p < 0.02, 0.001 for group C and D, respectively) of gene p16 was observed among people with high arsenic exposure (251 to 1000 μg/l) compared to control group.
Nonparametric Median Test for DNA Methylation Status in p53 and p16 Gene Study Population
Gene | Group | Level of As exposure (μg/l) | Chi square values for DNA methylation |
|---|---|---|---|
| p53 study population | A n = 24 | <50 | |
| B n = 12 | 51–250 | 3.125, p < 0.1 | |
| C hyper n = 11 hypo n = 7 | 251–500 | 10.045, p < 0.001 | |
| 0.74, p > 0.3 | |||
| D hyper n = 10 hypo n = 5 | 500–1000 | 11.47, p < 0.001 | |
| 0.97, p > 0.3 | |||
| E n = 16 | 300–1000 | 23.43, p < 0.001 | |
| Arsenic-induced cancer | |||
| F n = 11 | <50 | 2.52, p < 0.2 (Group E vs. Group F) | |
| Skin cancer unrelated to arsenic | |||
| p16 study population | O, n = 11 | Surface water | |
| A, n = 8 | 0–50 | 0.93 | |
| B, n = 9 | 51–250 | 1.81 | |
| C, n = 13 | 251–500 | 6.04, p < 0.02 | |
| D, n = 15 | 500–1000 | 15.75, p < 0.001 | |
| E, n = 6 | 300–1000 | Sample number too small for analysis | |
| Arsenic-induced skin cancer |
There was no difference in methylation value in regard to age, sex, or smoking habit among the study subjects. However, because of the small number of cases among different groups, no statistical analysis was carried out.
DISCUSSION
Cytosine methylation is of critical importance in animal development. DNA methylation has been implicated as one of the epigenetic mechanisms which perpetuate repression of genes in vertebrates. Hypermethylation and consequent silencing of tumor suppressor and repair genes is implicated as an early event in certain types of malignancy like lung, colorectal, breast, and other cancers (Heish and Ganther, 1977; Herman et al., 1994; Merlo et al., 1995; Graff et al., 1995). Though there is still confusion on the exact role of methylation in this process, silencing of genes like TIMP-3 through methylation has been correlated with metastasis in advanced stage of cancer like esophageal adenocarcinoma (Darnton et al., 2005). Hypomethylation, on the other hand, offers growth advantage and is an important step in the genesis of many cancers (Strachan and Read, 1999). Due to the poor in vitro mutagenicity of arsenic, a known carcinogen, alteration of DNA methylation has been implicated as a plausible epigenetic mechanism of arsenic-induced malignancy. Different workers have tested the hypothesis on cell lines of mammalian origin, after exposure to various doses of arsenic. Specific investigation on p53 tumor suppresser gene demonstrated hypermethylation after exposure of cells to sodium arsenite (Mass and Wang, 1997). It has also been shown that inorganic arsenic exposure reduces p53 expression and up regulates mdm2 (Hamadeh et al., 1999). Further, post-UV p53 dependent p21 expression is greatly suppressed after arsenic exposure, thus overriding the post-UV block in cell cycle progression (Vogt and Rossman, 2001). Studies from endemic areas of Taiwan have reported mutations of p53 in arsenic-induced skin cancer, and these mutations are apparently of different types than those observed in UV-induced skin cancer (Hsu et al., 1999). Hypomethylation of genes after arsenic exposure has also been reported in studies done on cell lines (Mass and Wang, 1997). In an arbitrarily primed methyl-sensitive PCR assay, Mass found both hypermethylation and hypomethylation of different DNA sequences, their ratio being 3:1. The sequences corresponded mostly to putative promoter regions (Zhong and Mass, 2001).
In another significant work, it has been shown that chronic low level of arsenic exposure on rat liver epithelial cells produced highly aggressive malignant cells, and hypomethylation of DNA was detected using α satellite DNA (Zhao et al., 1997). A study of lung cancer patients (Woodson et al., 2001) showed that hypomethylation of p53, particularly within the hypermutable 5–8 exons, was significantly related to lung cancer risk. Thus, aberrant methylation has been documented as a probable mechanism of various types of carcinogenesis.
Our study is the first report on DNA hypermethylation in subjects suffering from arsenic toxicity due to chronic arsenic exposure in a dose-dependent manner. A small number of people with high arsenic exposure showed hypomethylation. Cases of both hyper- and hypomethylation leading to silencing of tumor suppressor and activation of oncogenes have been documented in different types of cancers. A recent work, (Gaudet et al., 2003) using genetically modified mice, indicated that hypomethylation per se might lead to tumorigenicity, possibly through genomic instability. We have detected hypomethylation in a small number of our cases. However, like the tissue culture study, our results also indicate that DNA hypermethylation is the primary effect after arsenic exposure, and hypomethylation occurs only after prolonged exposure at higher dose.
The mechanism of DNA hypermethylation after arsenic exposure is not clear. A major detoxifying metabolic route for arsenic in humans is methylation of arsenic catalyzed by a methyltransferase using SAM as the methyl donor, resulting in the production of MMA and DMA. The arsenic methyltransferase uses the same methyl donor SAM as DNA methyltransferase and other methyltransferases. Arsenic exposure might cause induction of cytosine methyltransferase, as increase of mRNA of this enzyme after arsenite exposure has been reported (Goering et al., 1999), and this might explain the initial hypermethylation. On the other hand, prolonged arsenic exposure may cause depletion of the SAM methyl donor pool due to overconsumption of the methyl groups by arsenic methyltransferase. The lack of methyl groups would result in inability to maintain methylated cytosine in DNA, resulting in hypomethylation (Mass and Wang, 1997). Arsenic metabolism is mediated through methylation. So methionine content of the diet, and polymorphisms of genes, which participate in the detoxification pathway, are also expected to influence the methylation status.
In the phase I study, methylation profile has been studied by methyl-sensitive restriction endonuclease (HpaII) digestion and subsequent amplification. This method is based on the inability of the methyl-sensitive restriction enzyme to cleave the sequence that contains methylated CpG sites and provides assessment of methylation status of CpG islands, quantitatively. However, the fragment analyzed contains two methylation sites, and this technique fails to detect methylation at a single site. Further, incomplete digestion by the restriction enzyme HpaII will produce amplified PCR product and give a false positive result for methylation. Hence, we have used MspI control with each sample and normalized our data with that of MspI-digested DNA, as detailed in materials and methods.
Bisulfite modification and subsequent methylation-specific PCR analysis of modified DNA was also done by us to assess the degree of methylation of promoter region of p16 gene. Bisulfite modification of DNA offers the conversion of all unmethylated cytosine to uracil, whereas the methylated cytosine remains unaltered. The modified DNA was then subjected to PCR amplification using methylation- and unmethylation-specific primers to discriminate between methylated and unmethylated DNA, taking advantage of sequence difference which results from bisulfite modification. Incompletely modified DNA (DNA incompletely reacted with bisulfite) can also be distinguished, because marked sequence differences exist between these DNAs. Use of wild-type sequence-specific primers on bisulfite-treated DNA failed to produce any amplification, indicating complete modification. We are the first to report significant hypermethylation of p16 gene among people exposed to arsenic in high dose (251–1000 μg/l) compared to control group. Hypermethylation has also been seen in a few cases of arsenic-induced skin cancer.
Our data does not indicate any difference in methylation level in different age, sex, or smoker groups. However, no statistical analysis could be done due to the small number of samples in the different subgroups.
In conclusion, our study shows that arsenic exposure does alter (increase or decrease) DNA methylation pattern in many genes important in carcinogenesis in the DNA of the peripheral leucocytes of the exposed population.
The authors certify that all research involving human subjects was done under full compliance with all government policies and the Helsinki Declaration.
Research funding was available from DNGM research Foundation, Kolkata. Arsenic testing of the water samples was carried out in trace element laboratory developed by funding from USEPA grant No: R 826137–01–0 and NIEHS grant No: P 42 E 504705 through Center for Occupational and Environmental Health, University of California, Berkeley, CA. Conflict of interest: none declared.
References
Darnton, S. J., Hardie, L. J., Muc, R. S., Wild, C. P., and Casson, A. G. (
Das, D., and Das, A. (
Donohue, J. M., and Abernathy, C. O. (
Gaudet, F., Hodgson, J. G., Eden, A., Jackson-Grusby, L., Dausman, J., Gray, J. W., Leonhardt, H., and Jaenisch, R. (
Goering, P. L., Aposhian, H. V., Mass, M. J., Cebrian, M., Beck, B. D., and Waalkes, M. P., (
Graff, J. R., Herman, J. G., Lapidus, R. G., Chopra, H., Xu, R., Jarrard, D. F., Isaacs, W. B., Pitha, P. M., Davidson, N. E., and Baylin, S. B. (
GuhaMazumder, D. N., (
GuhaMazumder, D. N., Haque, R., Ghosh, N., De, B. K., Santra, A., Chakrabarty, D., and Smith, A. H., (
Hamadeh, H. K., Vargas, M., Lee, E., and Menzel, D. B. (
Haque, R., GuhaMazumder, D. N. Samanta, S., Ghosh, N., Kalman, D., Smith, M., Mitra, S., Santra, A., Lahiri, S., Das, S., et al. (
Hayakawa, T., Kobayashi, Y., Cui, X., and Hirano, S. (
Heish, H. S., and Ganther, H. E. (
Herman, J. G., Graff, J. R., Myohanen, S., Nelkin, B. D., and Baylin, S. B. (
Herman, J. G., Latif, F., Weng, Y., Lerman, M. I., Zber, B., Liu, S., Samid, D., Duan, D. S., Gnarra, J. R., and Linehan, W. M. (
Hsu, C. H., Yang, S. A., Wang, J. Y., Yu, H. Y., and Lin, S. R. (
IARC. (
Jacobson, K. D., and Moltalbano, D. (
Lee, T. C., Oshimura, M., and Barrett, J. C. (
Lewin, B. (
Lin, S., Shi, Q., Nix, F. B., Styblo, M., Melinda, A. B., Herbin-Davis, K. M., Hall, L. L., Simeonsson, J. B., and Thomas, D. J. (
Mass, M. J., and Wang, L. (
Merlo, A., Herman, J. G., Mao, L., Lee, D. J., Gabrielson, E., Burger, P. C., Baylin, S. B., and Sindransky, De. (
Miller, S. S., Dykes, D. D., and Polesky, H. F. (
National Research Council. (
Rossman, T. G., Stone, D., Molina, M., and Troll, W. (
Strachan, T., and Read, A. P. (
Vahter, M. (
Vogt, B. L., and Rossman, T. G. (
Waalkes, M. P. (
Woodson, K., Mason, J., Choi, S. W., Hartman, T., Tangrea, J., Virtamo, J., Taylor, P. R., and Albanes, D. (
Zakharyan, R. A., Sampayo, R. A., Healy, S. M., Tsaprailis, G., Board, P. G., Leibler, D. C., and Aposhian, H. V. (
Zhao, C. Q., Young, M. R., Diwan, B. A., Coogan, T. P., and Waalke, M. P. (
Author notes
*Department of Biophysics, Molecular Biology and Genetics, University of Calcutta, 92, APC Road, Kolkata- 700009, India; and †Institute of Post Graduate Medical Education and Research (IPGME & R), Kolkata- 700020, India

Comments