


Abstract
Phosphorus (P) is an essential element for plant growth. Crop production of common bean (Phaseolus vulgaris), the most important legume for human consumption, is often limited by low P in the soil. Functional genomics were used to investigate global gene expression and metabolic responses of bean plants grown under P-deficient and P-sufficient conditions. P-deficient plants showed enhanced root to shoot ratio accompanied by reduced leaf area and net photosynthesis rates. Transcript profiling was performed through hybridization of nylon filter arrays spotted with cDNAs of 2,212 unigenes from a P deficiency root cDNA library. A total of 126 genes, representing different functional categories, showed significant differential expression in response to P: 62% of these were induced in P-deficient roots. A set of 372 bean transcription factor (TF) genes, coding for proteins with Inter-Pro domains characteristic or diagnostic for TF, were identified from The Institute of Genomic Research/Dana Farber Cancer Institute Common Bean Gene Index. Using real-time reverse transcription-polymerase chain reaction analysis, 17 TF genes were differentially expressed in P-deficient roots; four TF genes, including MYB TFs, were induced. Nonbiased metabolite profiling was used to assess the degree to which changes in gene expression in P-deficient roots affect overall metabolism. Stress-related metabolites such as polyols accumulated in P-deficient roots as well as sugars, which are known to be essential for P stress gene induction. Candidate genes have been identified that may contribute to root adaptation to P deficiency and be useful for improvement of common bean.
Common beans (Phaseolus vulgaris) are the world's most important grain legume for direct human consumption; they comprise 50% of the grain legumes consumed worldwide (Broughton et al., 2003; Graham et al., 2003). In several countries of Central and South America, beans are staple crops serving as the primary source of protein in the diet. Environmental factors, such as low soil nitrogen (N) and phosphorus (P) levels, and acid soil conditions are important constraints for bean production in most of the areas where this crop is grown (Graham et al., 2003). In bean, symbiotic N fixation rates, seed protein level, and tolerance to P deficiency are low in comparison to other legumes (Broughton et al., 2003).
P is an essential element required for plant growth and development. Besides N, P is the most limiting nutrient for plant growth, and it is a common limiting factor for crop production in arable soils. Plants have evolved general strategies for P acquisition and use in limiting environments that include: mycorrhizal symbioses, decreased growth rate, remobilization of internal inorganic phosphate (Pi), modification of carbon (C) metabolism bypassing P-requiring steps, increased production and secretion of phosphatases, exudation of organic acids, modification of root architecture, expansion of root surface area, and enhanced expression of Pi transporters (for review, see Raghothama, 1999; Smith, 2001; Vance et al., 2003; Plaxton, 2004).
In contrast to disease-resistance traits, where resistance may be due to a single dominant or recessive gene, enhancing tolerance to P stress requires multiple genes and involves several different mechanisms. In recent years, macro/microarray technologies have provided valuable information on global changes in gene expression in response to P starvation in several plant species and organs, including white lupin (Lupinus albus) proteoid roots (Uhde-Stone et al., 2003), rice (Oryza sativa) leaves and roots (Wasaki et al., 2003, 2006), and Arabidopsis (Arabidopsis thaliana) roots, shoots, and leaves (Hammond et al., 2003; Wu et al., 2003; Misson et al., 2005; Müller et al., 2007).
Although macro/microarray studies have identified genes differentially regulated by P starvation, little is known about the regulation of gene expression changes. Transcription factors (TFs) are master control proteins in all living cells, regulating gene expression in response to different stimuli (Riechmann, 2002; Czechowski et al., 2004). Chen et al. (2002) reported that Arabidopsis TF gene expression is regulated in a cell type- or tissue-specific manner and in response to specific environmental biotic and abiotic stresses. Müller et al. (2007) reported that specific TFs are induced in Arabidopsis P-starved leaves. These studies have opened new possibilities to elucidate the sensing, signaling, and regulatory pathways of the P deficiency response in plants.
Despite the agronomic importance of beans, there is little information on global gene expression of bean tissues in response to P deficiency. In previous work, we attempted to identify candidate P stress-induced genes in beans using an in silico approach that clustered bean ESTs with previously identified P stress-induced genes across three other legume species and Arabidopsis (Graham et al., 2006). Here, we undertook a three-step approach to identify genes important to P deficiency in common bean. First, macroarray technology was used for transcript profiling of P-deficient bean roots with the aim of identifying those genes, gene networks, and signaling pathways that are important for the plant response to P deficiency. Second, we identified bean TFs and used quantitative reverse transcription (RT)-PCR to assess TF gene expression in P-deficient bean roots, with the aim of identifying TFs that regulate the differential expression of genes during P stress. Third, we performed nonbiased metabolite profiling of bean roots using gas chromatography coupled to mass spectrometry (GC-MS) to correlate metabolic differentiation orchestrated by global changes in gene transcription as response to P starvation. The overall goal of this research is to identify candidate genes that may be useful to bean improvement and that will contribute to understanding common bean adaptation to P deficiency.
RESULTS
Phenotypic Characterization
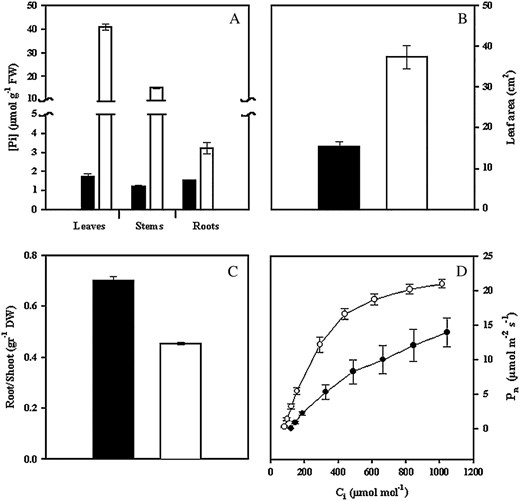
Effect of P deficiency on common bean. A, Soluble Pi content in different plant organs. B, Leaf area from fully expanded leaves. C, Root to shoot dry weight ratio. D, Pn rate as a function of changing Ci. Plants were grown for 3 weeks under P-deficient (black bars or circles) or in P-sufficient conditions (white bars or circles). Values are mean ± se from 12 determinations: three independent experiments with four replicates per experiment.
Content of photosynthetic pigments such as chlorophyll a and b and carotenes was similar in plants under −P and +P treatments (data not shown). However, P-deficient plants showed significant inhibition of net photosynthetic rate (Pn) regardless of internal CO2 (Ci) concentration (Fig. 1D). In contrast, P-deficient plants showed 50% lower Pn at ambient CO2 concentration (350 μmol mol−1), reflecting lower carboxylation efficiency. In addition, P-stressed plants showed 60% of the maximum Pn of +P plants, which is consistent with changes associated with increasingly larger limitations of Pn by Rubisco and ribulose 1,5-bisphosphate regeneration as leaf Pi declines (Fig. 1D). However, stomatal conductance and resistance was not altered in P-deficient plants (data not shown).
Macroarray Analysis of Root Response to P Deficiency
Macroarray analyses were performed to evaluate gene expression from P-deficient roots of bean plants as compared to control P-sufficient roots. Nylon filter arrays were spotted with ESTs that represented a 2,212 bean unigene set consisting of 1,194 singletons and 1,018 contigs derived from the −P roots cDNA library from bean ‘Negro Jamapa 81’ previously reported (Ramírez et al., 2005; Graham et al., 2006).
Total RNA was isolated from plants grown under similar conditions as described for each treatment (−P and +P). Ten nylon filter arrays were hybridized with first-strand cDNA synthesized from four independent sources of total RNA. From the 10 hybridizations, six replicates with high determination coefficients (r 2 ≥ 0.8) were chosen for analysis of differential gene expression. A total of 126 cDNAs showed significant (P ≤ 0.05) differential expression (Tables I
Genes induced in roots of P-deficient plants identified by macroarray analysis
Functional categories are in bold. TC No., Tentative consensus sequence assignment (TIGR/DFCI Common Bean Gene Index, version 1.0); blank cells correspond to singletons with no TC number assigned.
EST Identification | TC No. | GenBank Accession No. of EST | Annotation | BLASTX E-Value | Expression Ratio −P to +P | P-Value | ||||||
|---|---|---|---|---|---|---|---|---|---|---|---|---|
| P i cycling | ||||||||||||
| RTS_113_H08 | EH791066 | (Q84MA2) Type I inositol-1,4,5-trisphosphate 5-phosphatase | 4.00E-10 | 2.59 | 9.8E-04 | |||||||
| RTS_145_F08 | TC1447 | CV544205 | (Q6J5M7) Purple acid phosphatase 1 | 1.00E-100 | 2.10 | 2.2E-02 | ||||||
| RTS_105_G04 | CV541472 | (Q9LDA7) Protein phosphatase type 2C | 1.00E-65 | 2.12 | 4.8E-02 | |||||||
| C/N metabolism | ||||||||||||
| RTS_101_F08 | TC1804 | CV541174 | (Q96558) UDP-Glc-6-dehydrogenase | 1.00E-65 | 3.63 | 1.7E-07 | ||||||
| RTS_122_G12 | TC733 | CV542619 | (Q8S532) Cytosolic aldehyde dehydrogenase RF2C | 3.00E-48 | 3.48 | 7.1E-04 | ||||||
| RTS_104_C06 | TC1280 | CV541371 | (P39866) Nitrate reductase | 1.00E-122 | 2.65 | 2.5E-04 | ||||||
| RTS_117_F10 | CV542239 | (Q75GR9) Inosine-uridine preferring nucleoside hydrolase | 3.00E-78 | 2.28 | 3.8E-03 | |||||||
| Amino acid/protein metabolism | ||||||||||||
| RTS_104_E06 | CV541391 | (Q8LSY7) Phosphoribosyltransferase | 3.00E-19 | 6.18 | 3.60E-05 | |||||||
| RTS_117_A02 | (TC1704)a | EH791074 | (Q8LJW0) 40S Ribosomal S4 protein | 1.00E-126 | 2.43 | 7.30E-04 | ||||||
| RTS_108_F01 | TC492 | CV541666 | (Q7DLS1) Proteasome subunit-β type | 1.00E-135 | 2.41 | 3.20E-03 | ||||||
| RTS_120_H04 | TC486 | CV542476 | (P29144) Tripeptidyl-peptidase 2 | 2.00E-14 | 2.39 | 5.00E-02 | ||||||
| RTS_101_D04 | TC250 | CV541149 | (Q8LKU3) 60S Ribosomal protein | 1.00E-103 | 2.34 | 6.80E-04 | ||||||
| RTS_117_A07 | (TC1704)a | EH792674 | (Q8LJW0) 40S Ribosomal S4 protein | 1.00E-126 | 2.30 | 3.30E-04 | ||||||
| RTS_135_E01 | TC112 | CV543464 | (Q41119) Cyclophilin | 1.00E-88 | 2.25 | 1.70E-03 | ||||||
| RTS_123_H06 | CV542691 | (Q9ZNS5) Ribosomal protein S28 | 4.00E-19 | 2.20 | 5.20E-03 | |||||||
| RTS_121_C06 | TC1703 | CV542506 | (Q5YJR8) 60S Acidic ribosomal protein | 1.00E-23 | 2.08 | 3.80E-03 | ||||||
| RTS_101_B01 | TC85 | CV541126 | (Q8W3Y4) S-adenosyl-methionine synthetase | 0.0 | 2.00 | 5.70E-03 | ||||||
| Lipid metabolism | ||||||||||||
| RTS_110_A04 | TC1739 | CV541751 | (Q69JE2) Putative CLB1 protein | 0.0 | 2.51 | 4.2E-02 | ||||||
| RTS_127_F12 | CV542902 | (Q8LG07) GlcNAc-1-P-transferase | 2.00E-79 | 2.21 | 1.2E-03 | |||||||
| Cell structure/cell cycle/development | ||||||||||||
| RTS_109_B06 | EH792671 | (Q9LVI9) Senescence-related dihydroorotate dehydrogenase | 1.00E-50 | 5.11 | 3.30E-08 | |||||||
| RTS_125_D07 | TC63 | CV542788 | (Q944T2) Translationally controlled tumor protein | 3.00E-77 | 3.72 | 7.60E-04 | ||||||
| RTS_127_C08 | (TC1617)a | EH792676 | (Q41125) Pro-rich, 14-kD protein | 1.00E-50 | 2.43 | 7.10E-05 | ||||||
| RTS_137_A05 | TC114 | CV543578 | (Q41707) Extensin class 1 protein precursor | 1.00E-134 | 2.40 | 9.10E-05 | ||||||
| RTS_119_E03 | TC254 | CV542369 | (Q9XHD5) B12D/Leaf senescence protein | 4.00E-35 | 2.21 | 7.60E-04 | ||||||
| RTS_136_B08 | TC415 | CV543516 | (Q09085) Hydroxy-Pro-rich glycoprotein | 2.00E-80 | 2.10 | 8.80E-04 | ||||||
| Stress/defense/secondary metabolism | ||||||||||||
| RTS_138_E12 | TC1903 | CV543709 | (Q6K1Q5) Glycolipid transfer protein-like | 2.00E-82 | 4.62 | 2.10E-05 | ||||||
| RTS_101_C10 | TC280 | CV541144 | (Q2KTE6) ACC oxidase | 1.00E-160 | 3.59 | 1.10E-03 | ||||||
| RTS_107_E03 | TC64 | CV541595 | (P25985) Pathogenesis-related protein (PvPR1)b | 2.00E-82 | 3.00 | 5.40E-05 | ||||||
| RTS_135_E10 | TC459 | CV543472 | (Q9C939) Putative oxidoreductaseb | 1.00E-59 | 2.63 | 4.40E-04 | ||||||
| RTS_117_E09 | TC2562 | CV542227 | (Q700B1) Noncyanogenic β-glucosidaseb | 9.00E-41 | 2.54 | 2.30E-05 | ||||||
| RTS_113_H03 | TC1260 | CV541991 | (Q2LAL0) Cyt P450 monooxygenaseb | 1.00E-72 | 2.52 | 1.80E-03 | ||||||
| RTS_111_F07 | TC2443 | CV541849 | (Q2LAL4) Cyt P450 monooxygenaseb | 1.00E-56 | 2.49 | 1.50E-03 | ||||||
| RTS_103_E06 | TC1890 | CV541320 | (Q9SWS4) Ripening-related protein/(O65884) MLP protein | 1.00E-71 | 2.39 | 2.10E-03 | ||||||
| RTS_136_E10 | TC397 | CV543546 | (O22443) Seed coat peroxidase precursorb | 1.00E-103 | 2.31 | 3.30E-03 | ||||||
| RTS_113_H10 | CV541995 | (P32292) Indole-3-acetic acid-induced protein ARG2 | 5.00E-39 | 2.28 | 2.60E-03 | |||||||
| RTS_119_F09 | TC146 | CV542386 | (O48561) Catalase-4 | 0.0 | 2.27 | 1.30E-04 | ||||||
| RTS_102_H03 | TC2059 | CV541272 | (O23961) Peroxidase precursorb | 1.00E-119 | 2.26 | 3.10E-02 | ||||||
| RTS_135_B05 | CV543440 | (Q1SGR7) TIR; Disease resistance protein | 1.00E-49 | 2.18 | 4.50E-03 | |||||||
| RTS_138_A10 | TC257 | CV543662 | (P07218) Phe ammonia-lyase | 0.0 | 2.18 | 2.80E-03 | ||||||
| RTS_108_H02 | CV541683 | (Q4QTI9) Pathogenesis-related 10 protein | 1.00E-15 | 2.15 | 2.10E-02 | |||||||
| RTS_125_H01 | CV542814 | (Q1SGA8) 2OG-Fe(II) oxygenase | 2.00E-38 | 2.12 | 2.90E-02 | |||||||
| RTS_118_D09 | CV542294 | (Q8LJ95) NBS-LRR resistance protein RGH1-like | 1.00E-06 | 2.04 | 1.40E-02 | |||||||
| RTS_105_D07 | TC1309 | CV541452 | (O65152) Cinnamyl alcohol dehydrogenaseb | 1.00E-115 | 2.04 | 3.80E-03 | ||||||
| Transport/membrane proteins | ||||||||||||
| RTS_113_A06 | CV541934 | (Q1SI67) Dynamin central region | 1.00E-43 | 3.96 | 5.00E-04 | |||||||
| RTS_108_A08 | TC220 | CV541629 | (Q506K0) Putative aquaporinb | 1.00E-164 | 2.91 | 2.70E-05 | ||||||
| RTS_133_A05 | TC2513 | CV543276 | (O65744) GDP dissociation inhibitor | 4.00E-22 | 2.48 | 2.80E-02 | ||||||
| RTS_109_H05 | TC2647 | CV541745 | (Q6YZC3) Glc-6-P/phosphate translocator | 1.00E-109 | 2.33 | 2.30E-02 | ||||||
| RTS_108_H06 | TC587 | CV541687 | (Q9MAX8) Epsilon1-COP | 1.00E-157 | 2.23 | 8.10E-03 | ||||||
| RTS_108_F03 | TC2564 | CV541668 | (Q8H4Q9) GTP-binding protein Rab6 | 5.00E-34 | 2.21 | 4.70E-02 | ||||||
| RTS_124_F11 | CV542748 | (Q65CB1) ATP-binding cassette transporterb | 9.00E-78 | 2.09 | 1.10E-03 | |||||||
| RTS_119_F08 | TC1933 | CV542385 | (Q9FVE8) Plasma membrane Ca2+-ATPase | 1.00E-150 | 2.05 | 3.80E-02 | ||||||
| RTS_136_H04 | CV543570 | (Q6K5Y4) Putative UDP-GlcNAc transporter | 8.00E-63 | 2.05 | 4.10E-02 | |||||||
| RTS_103_G05 | TC2845 | CV541336 | (Q1T029) Sugar transporter superfamily | 2.00E-75 | 2.00 | 1.30E-02 | ||||||
| Regulation/signal transduction | ||||||||||||
| RTS_121_B11 | TC189 | CV542500 | (Q9LEB4) RNA Binding Protein 45 | 1.00E-122 | 3.21 | 8.40E-04 | ||||||
| RTS_104_H09 | CV541419 | (Q41109) Regulator of MAT2 | 1.00E-23 | 3.11 | 1.50E-04 | |||||||
| RTS_119_D05 | TC1707 | CV542360 | (Q39892) Nucleosome assembly protein 1 | 1.00E-122 | 3.09 | 2.10E-07 | ||||||
| RTS_104_D03 | TC1670 | CV541379 | (Q1SGW5) ZIMc | 1.00E-24 | 2.76 | 4.70E-05 | ||||||
| RTS_101_E04 | CV541158 | (Q1RVC8) HMG-I and HMG-Y, DNA-binding | 1.00E-22 | 2.44 | 2.20E-03 | |||||||
| RTS_138_A05 | CV543658 | (O65573) PRL1-associated protein | 6.00E-34 | 2.39 | 1.70E-02 | |||||||
| RTS_128_D02 | CV542946 | (Q8GXM5) RING-H2 finger protein RHB1a | 4.00E-25 | 2.37 | 1.00E-02 | |||||||
| RTS_142_A06 | TC778 | CV543967 | (Q9SK39) Putative steroid-binding protein 3 | 2.00E-40 | 2.34 | 6.20E-03 | ||||||
| RTS_102_F11 | CV541259 | (Q8LCS8) NTGP5 | 4.00E-14 | 2.30 | 2.50E-03 | |||||||
| RTS_108_H08 | CV541689 | (Q1T5G4) Zinc finger, CCCH-type | 1.00E-29 | 2.20 | 2.70E-02 | |||||||
| RTS_103_H07 | TC2434 | CV541346 | (Q5Z6C2) Putative mlo2 protein | 4.00E-63 | 2.17 | 2.50E-02 | ||||||
| RTS_101_B04 | TC2165 | CV541128 | (Q8H1A5) DEAD box RNA helicase | 0.0 | 2.16 | 2.20E-02 | ||||||
| RTS_101_F12 | TC1622 | CV541178 | (Q3HLY8) U-box protein | 1.00E-109 | 2.09 | 1.70E-02 | ||||||
| RTS_104_B03 | TC348 | CV541358 | (Q5MJ53) AT-rich element binding factor 3 | 3.00E-91 | 2.08 | 2.90E-03 | ||||||
| RTS_110_H08 | TC221 | CV541801 | (Q93XA5) Homeodomain Leu zipper protein | 1.00E-119 | 2.08 | 2.80E-03 | ||||||
| RTS_119_B12 | TC100 | CV542349 | (Q7F8L1) Histone H3 | 2.00E-65 | 2.05 | 1.40E-03 | ||||||
| RTS_137_H03 | TC165 | CV543649 | (Q93VL8) Calmodulin | 1.00E-75 | 2.00 | 3.20E-02 | ||||||
| RTS_123_D08 | TC1622 | CV542656 | (Q3HLY8) U-box protein | 1.00E-109 | 2.00 | 3.70E-02 | ||||||
| Unknown | ||||||||||||
| RTS_117_G02 | TC1992 | CV542243 | (Q1SEK2) Hypothetical protein | 1.00E-36 | 7.15 | 5.20E-05 | ||||||
| RTS_113_E03 | CV541966 | No BLAST hit <10–4 | – | 4.89 | 2.90E-05 | |||||||
| RTS_121_D02 | CV542512 | No BLAST hit <10–4 | – | 2.63 | 4.70E-04 | |||||||
| RTS_123_C04 | EH792675 | No BLAST hit <10–4 | – | 2.46 | 7.50E-04 | |||||||
| RTS_119_F10 | EH791078 | (Q8W4E6) Hypothetical protein | 1.00E-90 | 2.22 | 1.40E-03 | |||||||
| RTS_104_C07 | CV541372 | No BLAST hit <10–4 | – | 2.06 | 3.30E-02 | |||||||
| RTS_123_D12 | CV542660 | No BLAST hit <10–4 | – | 2.00 | 5.80E-03 | |||||||
BLAST analysis of this new gene sequence revealed an overlap with the indicated TC from the TIGR/DFCI Common Bean Gene Index.
Genes reported as bean candidate P stress-induced genes through clustering analysis across five or four plant species by Graham et al. (2006).
Annotation according to TF genes identified in this work (Table III; supplemental data).
Genes repressed in roots of P-deficient plants identified by macroarray analysis
Functional categories are in bold. TC No., Tentative consensus sequence assignment (TIGR/DFCI Common Bean Gene Index, version 1.0); blank cells correspond to singletons with no TC number assigned.
EST Identification | TC No. | GenBank Accession No. of EST | Annotation | BLASTX E-Value | Expression Ratio +P/−Pa | P-Value | ||||||
|---|---|---|---|---|---|---|---|---|---|---|---|---|
| C/N metabolism | ||||||||||||
| RTS_112_G12 | TC1864 | CV541923 | (Q40345) Isocitrate dehydrogenase (NADP) | 1.00E-58 | −3.36 | 2.97E-02 | ||||||
| RTS_114_F03 | CV542030 | (Q9C9W6) Trehalose-6-P synthase | 2.00E-86 | −2.57 | 2.79E-02 | |||||||
| RTS_140_E03 | TC2520 | CV543865 | (Q9SEK4) Succinic semialdehyde dehydrogenase | 1.00E-138 | −2.25 | 1,45E-02 | ||||||
| RTS_141_C04 | TC851 | CV543912 | (Q8LBR3) Alcohol dehydrogenase | 4.00E-56 | −2.07 | 2.92E-02 | ||||||
| RTS_114_C03 | EH791068 | (Q9C9W6) Trehalose-6-P synthase | 4.00E-87 | −2.02 | 2.56E-02 | |||||||
| Amino acid/protein metabolism | ||||||||||||
| RTS_140_C05 | TC83 | CV543847 | (Q8W3Y2) S-adenosyl-methionine decarboxylase | 0.0 | −2.82 | 3.56E-04 | ||||||
| RTS_139_D07 | CV543777 | (Q9SKA3) Phosphoribosylanthranilate transferase | 4.00E-55 | −2.66 | 1.22E-02 | |||||||
| RTS_141_B12 | TC1262 | CV543909 | (Q6XJF4) 26S Proteasome subunit RPN12 | 1.00E-114 | −2.43 | 8.06E-03 | ||||||
| RTS_131_C09 | TC1689 | CV543154 | (Q9FKC0) 60S Ribosomal protein L13a-4 | 1.00E-104 | −2.39 | 3.25E-03 | ||||||
| RTS_132_D01 | TC1613 | CV543229 | (O81361) 40S Ribosomal protein S8 | 1.00E-83 | −2.34 | 3.98E-02 | ||||||
| RTS_129_D12 | TC267 | CV543033 | (Q9AV87) 60S Ribosomal protein L21 | 3.00E-84 | −2.15 | 5.54E-03 | ||||||
| RTS_141_C11 | (TC836)b | EH792677 | (Q8W538) Ribosomal S15 protein | 6.00E-73 | −2.15 | 4.23E-02 | ||||||
| RTS_140_D04 | TC163 | CV543856 | (O24322) Cys proteinase precursor | 0.0 | −2.11 | 3.68E-02 | ||||||
| RTS_140_H12 | EH791103 | (Q9FY64) Ribosomal protein S15-4 | 6.00E-77 | −2.04 | 2.33E-02 | |||||||
| RTS_112_A10 | TC110 | CV541878 | (Q71EW8) Met synthase | 0.0 | −2.00 | 9.52E-03 | ||||||
| RTS_123_G08 | TC209 | CV542684 | (P17093) 40S Ribosomal protein S11 | 3.00E-76 | −2.00 | 1.96E-02 | ||||||
| Cell structure/cell cycle/development | ||||||||||||
| RTS_102_C02 | TC184 | CV541220 | (Q2PK12) Actin depolymerizing factor | 6.00E-68 | −2.81 | 4.49E-04 | ||||||
| RTS_143_D10 | CV544078 | (Q6ZH89) Caffeine-induced death protein 1 | 5.00E-43 | −2.76 | 1.55E-03 | |||||||
| RTS_139_D02 | TC1176 | CV543772 | (O80452) AMP deaminase | 3.00E-29 | −2.70 | 7.85E-03 | ||||||
| RTS_112_C11 | EH791061 | (Q41125) Pro-rich 14-kD protein | 1.00E-10 | −2.59 | 9.88E-03 | |||||||
| RTS_114_F01 | (TC1723)b | EH792673 | (O04300) α-1,4-Glucan-protein synthase | 0.0 | −2.34 | 1.21E-02 | ||||||
| RTS_129_G01 | TC697 | CV543049 | (P93273) Fruit development protein (PAFD103) | 2.00E-16 | −2.33 | 2.94E-02 | ||||||
| RTS_115_A08 | (TC1617)b | EH792678 | (Q41125) Pro-rich 14-kD protein | 1.00E-50 | −2.04 | 1.47E-02 | ||||||
| Stress/defense/secondary metabolism | ||||||||||||
| RTS_105_B12 | (TC2799)b | EH791098 | (Q9LJX0) Multidrug resistance protein 11 | 1.00E-116 | −2.76 | 1.78E-02 | ||||||
| RTS_142_B04 | TC692 | CV543977 | (Q9SZB9) Peroxidase 47 precursor | 4.00E-83 | −2.19 | 1.50E-02 | ||||||
| RTS_139_B06 | CV543755 | (Q9SPJ5) Dihydroflavonol-4-reductase DFR1 | 1.00E-86 | −2.14 | 2.73E-02 | |||||||
| Transport/membrane proteins | ||||||||||||
| RTS_120_F09 | EH791079 | (Q1SG4) TFG-β receptor, type I/II extracellular region | 1.00E-62 | −5.88 | 5.25E-03 | |||||||
| RTS_132_D07 | CV543235 | (Q1SEG6) Heavy metal transport/detoxification protein | 5.00E-38 | −2.48 | 2.73E-02 | |||||||
| RTS_140_E05 | TC558 | CV543867 | (P31167) ADP, ATP carrier protein 1 | 3.00E-51 | −2.43 | 2.73E-02 | ||||||
| RTS_129_C07 | TC2875 | CV543019 | (Q9LX35) Transporter-like protein | 1.00E-56 | −2.29 | 1.01E-03 | ||||||
| RTS_129_H01 | TC1373 | CV543060 | (Q8H9B7) Putative lipid transfer protein | 3.00E-28 | −2.25 | 4.69E-02 | ||||||
| RTS_143_E05 | CV544083 | (Q8RYH0) GPI-anchored protein-like | 4.00E-22 | −2.25 | 1.25E-02 | |||||||
| RTS_143_E09 | TC1952 | CV544086 | (Q9LF59) Gly/Pro-rich protein | 5.00E-38 | −2.20 | 9.54E-05 | ||||||
| RTS_114_C05 | TC1657 | CV542010 | (Q9SMK5) Plasma membrane intrinsic polypeptide | 2.00E-51 | −2.08 | 6.63E-03 | ||||||
| RTS_141_F10 | TC2300 | CV543942 | (Q9FQ21) Putative Hs1pro-1-like receptor | 2.00E-56 | −2.02 | 9.57E-03 | ||||||
| Regulation/signal transduction | ||||||||||||
| RTS_140_A08 | TC2273 | CV543830 | (Q1SDP0) Pathogenesis-related transcriptional factor | 6.00E-61 | −2.76 | 4.91E-02 | ||||||
| RTS_139_D11 | CV543780 | (Q6ZFY4) BHLH protein-like | 1.00E-06 | −2.61 | 1.88E-02 | |||||||
| RTS_129_G09 | TC829 | CV543056 | (Q9M9V8) Calcium-dependent protein kinase 1 | 1.00-38 | −2.36 | 1.60E-02 | ||||||
| RTS_142_D10 | (TC1606)b | EH791104 | (Q9FNV7) Auxin-repressed protein | 4.00E-35 | −2.23 | 9.36E-03 | ||||||
| Unknown | ||||||||||||
| RTS_114_E05 | CV542025 | No BLAST Hit <10–4 | – | −2.91 | 3.43E-02 | |||||||
| RTS_112_A12 | EH791058 | No BLAST Hit <10–4 | – | −2.88 | 3.59E-02 | |||||||
| RTS_131_E06 | EH791092 | Hypothetical protein | 2.00E-21 | −2.48 | 2.11E-03 | |||||||
| RTS_129_B07 | EH795233 | No BLAST Hit <10–4 | – | −2.43 | 1.13E-02 | |||||||
| RTS_132_A02 | EH791093 | Hypothetical protein | 3.00E-75 | −2.29 | 4.89E-02 | |||||||
| RTS_112_C10 | EH792672 | (Q60EX8) Hypothetical protein | 4.00E-51 | −2.13 | 3.64E-02 | |||||||
| RTS_122_G01 | CV542612 | No BLAST Hit <10–4 | – | −2.12 | 1.23E-02 | |||||||
| RTS_129_H03 | TC1470 | CV543062 | (Q1S1H6) Hypothetical protein | 4.00E-19 | −2.03 | 3.95E-02 | ||||||
| RTS_142_E11 | TC2851 | CV544015 | (Q93VT6) Hypothetical protein | 1.00E-65 | −2.03 | 1.58E-02 | ||||||
For ratios lower than 1 (genes repressed in P deficiency), the inverse of the ratio was estimated and the sign was changed.
BLAST analysis of this new gene sequence revealed an overlap with the indicated TC from the TIGR/DFCI Common Bean Gene Index.
Tables I and II list the genes that were significantly induced or repressed, respectively, in P-deficient roots. To aid in annotation, cDNAs were assigned to tentative consensus sequences (TCs; Institute of Genomic Research [TIGR]/Dana Farber Cancer Institute [DFCI] Common Bean Gene Index, v. 1.0) when possible. The TC or EST sequences were then compared (BLASTX, E < 10–4; Altschul et al., 1997) to the Uniprot protein database (Apweiler et al., 2004) to assign putative function. Based on information available in the literature, sequences were then assigned to functional categories.
Table I shows the genes (78) that were induced 2-fold or more in P-deficient roots, classified in nine functional categories. The “unknown function” category included those genes with similarity to hypothetical proteins with unknown function and those for which no BLAST hit was found. The two most abundant functional categories, accounting for 23% of genes each, were the regulation/signal transduction category and those coding for genes that participate in secondary metabolism pathways and/or are related to several stress/defense plant responses. Ten genes (13%) were classified as membrane proteins or proteins that participate in transport, both extracellular and intracellular. Six genes (8%) were classified in cell structure, cell cycle, or developmental functions. Nineteen genes (24%) were classified in different metabolic pathways: Pi cycling, C and N metabolism, amino acid/protein synthesis or degradation, and lipid metabolism. Finally, 9% of genes had no known function.
Table II lists the functional classification of the genes (48) that were repressed in −P roots as compared to control roots. The most abundant category was the amino acid/protein metabolism with 11 genes (23%). Only five genes participating in metabolic C/N pathways were identified (10%), and no genes involved in Pi cycling were identified. Nine (19%) and seven (15%) genes were classified in the transport/membrane protein and cell structure/cell cycle/development categories, respectively. Only 8% and 6% of the repressed genes participate in regulation/signal transduction and secondary metabolism/defense pathways, respectively.
It was evident that a number of genes from within a single functional category could either be induced (Table I) or repressed (Table II). We found that 10 P deficiency-induced genes identified by the macroarray analysis had been previously proposed by Graham et al. (2006) as candidate P stress-induced genes in bean (Table I). Graham et al. (2006) identified candidate P stress-induced genes of bean by statistical analysis of contigs overrepresented with ESTs from P-stressed tissues and by clustering candidates with P stress-induced genes identified from a variety of plant species, including Arabidopsis, lupin, soybean, Medicago truncatula, and bean. As expected, none of the −P-repressed genes identified by macroarrays (Table II) were included in the Graham et al. (2006) analysis, which only evaluated induced genes.
Expression Analyses of Selected Genes by RT-PCR
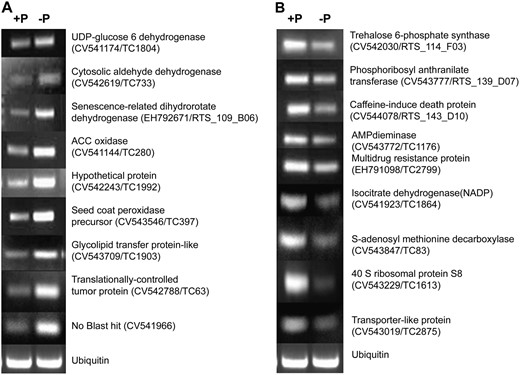
Verification of macroarray results by RT-PCR analysis. Selected genes identified as induced (A) or repressed (B) in P-deficient roots were evaluated. The ubiquitin gene was included as control for uniform RT-PCR conditions (bottom). The primer sequences and reaction conditions used are presented in Table V.
TF Transcript Profiling by Real-Time RT-PCR
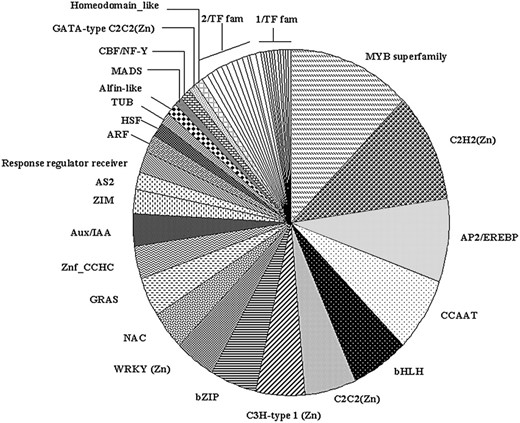
Classification of common bean TF genes in different families. The TF genes (372) were grouped in 47 different families with different Inter-Pro domains according to TF gene families reported for Arabidopsis (Riechmann, 2002; http://range.gsc.riken.ip/rart; http://daft.cbi.pku.edu.cn). The identity of each TF gene family with three or more members is shown. Twelve gene families with two members each (2/TF fam) are: TAZ, MBF1, ARID, Nin-like, Dof-type C2C2(Zn), S1Fa-like, YABBY C2C2(Zn), BES1, K-box, Histone-like/CBFA_NFYB_topo, Auxin_resp, and Lambda_DNA_bd. Eleven gene families with one member each (1/TF fam) are: FHA, LIM-domain, E2F/DP, Jumonji JmjN, SBP, SHAQKYF_MYB_bd, ZF_HD, SRS, POX, EIL, and Euk_TF_DNA_bd.
We performed TF profiling based on real-time RT-PCR to determine differential expression of bean TF genes that might be involved in gene expression response to P deficiency. There were three biological replicates of −P- and +P-treated roots. In each RT-PCR run, the phosphatase gene (TC201) was included as a P-deficient marker. This marker gene, known to be induced in P-deficient roots (Ramírez et al., 2005), showed an average expression ratio −P to +P of 18.48 (P = 0.005), confirming the P-deficient status of the roots. From the 372 TF genes, 46 (12%) were differentially expressed (P ≤ 0.05) in −P-treated roots, 10 were induced, and the rest were repressed in −P roots. Table III
TF genes significantly expressed in roots of P-deficient plants identified by real-time RT-PCR
Data of genes exhibiting ≥2-fold induction or repression expression ratio in roots from P-deficient plants versus +P plants.
GenBank Accession No./TC No. | Annotation | TF Family or Domain | Expression Ratio −P to +Pa | P-Value | ||||
|---|---|---|---|---|---|---|---|---|
| Induced in −P | ||||||||
| CV532742 | MYB family TF | MYB superfamily | 3.19 | 2.5E-02 | ||||
| CV541354 | MYB family TF | MYB superfamily | 2.12 | 5.0E-02 | ||||
| TC2883 | Transfactor-like protein | MYB superfamily | 2.00 | 4.4E-02 | ||||
| TC1670 | Unknown protein At1g19180 | ZIM | 2.00 | 4.9E-02 | ||||
| Repressed in −P | ||||||||
| CV535367 | Zinc finger protein | C2H2(Zn) | −3.03 | 5.0E-02 | ||||
| TC1859 | Protein kinase (E6) | C2H2(Zn) | −2.00 | 5.0E-02 | ||||
| TC1802 | GPI-anchored protein | C2H2(Zn) | −2.00 | 5.0E-02 | ||||
| TC2557 | RNA-binding protein | C2H2(Zn) | −2.00 | 1.0E-02 | ||||
| TC2359 | LOB domain protein | AS2 | −5.95 | 1.1E-02 | ||||
| CV535841 | LOB domain protein | AS2 | −3.26 | 2.2E-02 | ||||
| CB540443 | TF | Alfin-like | −2.19 | 3.6E-02 | ||||
| CV536700 | Ethylene response factor | AP2/EREBP | −2.03 | 1.1E-02 | ||||
| CV530634 | bHLH TF | bHLH | −2.59 | 5.1E-02 | ||||
| CV530350 | YABBY2-like TF | C2C2(Zn) | −2.67 | 3.0E-02 | ||||
| CB542250 | WUSCHEL-related homeobox 4 | CCAAT | −2.89 | 4.0E-03 | ||||
| CB540853 | Phosphate starvation response regulator | MYB superfamily | −2.00 | 5.0E-02 | ||||
| CV535056 | NAM-like protein | NAC | −2.00 | 1.0E-02 | ||||
Whenever the ratio was lower than 1 (genes repressed in P-deficiency), the inverse of the ratio was estimated and the sign was changed.
Most of the TF genes induced in −P roots belong to the MYB superfamily (Table III). The induction of Arabidopsis MYB TF genes in response to different biotic stresses (Chen et al., 2002) and to P starvation (Müller et al., 2007) has been shown previously. It has been demonstrated that the Arabidopsis PHR1 and PHR2 genes, which resemble the PSR1 gene from Chlamydomonas reinhardtii and belong to the TF MYB superfamily, are crucial for P starvation signaling (Rubio et al., 2001; Todd et al., 2004). Our BLAST analysis revealed that the deduced translated amino acid sequence of MYB TF TC2883, induced 2-fold in −P roots (Table III), showed 59% amino acid identity to PHR1 (BLASTX E value = 4.1E−39). The C2C2(Zn) TF family was the most highly represented among the repressed TF genes, and members from eight other TF gene families were also repressed (2-fold or more) in −P roots (Table III).
Metabolome Analyses
To assess the degree to which changes in plant gene expression in P-deficient bean roots affect overall metabolism, we performed nonbiased metabolite profiling of bean roots using GC-MS. The complete information of the 81 metabolites and mass spectral metabolite tags (MSTs) detected in bean roots subjected to both treatments (−P and +P) is provided as Supplemental Data.
Metabolites identified by GC-MS in bean roots from −P- and +P-treated plants
RI, Expected | RI, sd | Response Ratio −P to +Pa | ||||
|---|---|---|---|---|---|---|
| Amino acids | ||||||
| Gly | 1,304.5 | −0.17 | −3.3 | |||
| β-Ala | 1,424.7 | −0.12 | 1.4 | |||
| Ser | 1,252.9 | 0.09 | 5.2 | |||
| Asp | 1,420.5 | 0.07 | 2.1 | |||
| Asn | 1,665.8 | −0.02 | 20.0 | |||
| 4-Aminobutyric acid | 1,526.5 | −0.15 | 1.9 | |||
| Thr | 1,290.9 | −0.02 | 3.3 | |||
| Pro | 1,298.0 | −0.16 | 1.7 | |||
| Glu | 1,615.4 | −0.10 | 2.1 | |||
| Gln | 1,767.6 | −0.05 | −5.0 | |||
| Arg (citrulline)b | 1,814.4 | 0.07 | 2.8 | |||
| Leu | 1,151.0 | 0.52 | 3.4 | |||
| Lys | 1,847.3 | −0.02 | 3.5 | |||
| Phe | 1,553.1 | 0.15 | 5.0 | |||
| N compounds | ||||||
| Putrescine (agmatine)b | 1,737.2 | −0.24 | 1.4 | |||
| Allantoin | 2,067.3 | 0.29 | 1.6 | |||
| Spermidine | 2,251.1 | −0.22 | 1.6 | |||
| Urea | 1,235.6 | 0.06 | −5.0 | |||
| Organic acids | ||||||
| Oxalic acid | 1,116.8 | 0.90 | −2.5 | |||
| Malonic acid | 1,195.0 | 0.30 | −2.5 | |||
| Succinic acid | 1,310.2 | 0.02 | 1.4 | |||
| Malic acid | 1,477.3 | 0.11 | −1.1 | |||
| 2-Methylmalic acid | 1,464.3 | −0.09 | 1.3 | |||
| Shikimic acid | 1,792.5 | 0.05 | 1.6 | |||
| Polyhydroxy acids | ||||||
| Erythronic acid-1,4-lactone | 1,426.9 | 0.08 | −1.3 | |||
| Galactonic acid-1,4-lactone | 1,877.4 | −0.31 | 2.5 | |||
| Polyols | ||||||
| Threitol | 1,485.1 | −0.12 | 2.1 | |||
| Arabitol | 1,707.8 | −0.19 | 3.4 | |||
| Myoinositol | 2,083.9 | −0.27 | 3.1 | |||
| Sugars | ||||||
| Xyl | 1,651.6 | −0.12 | 1.9 | |||
| Gal | 1,874.7 | 0.16 | 2.2 | |||
| Fru | 1,856.2 | −0.24 | 2.8 | |||
| Fru | 1,865.9 | −0.23 | 3.2 | |||
| Man | 1,869.0 | −0.17 | 3.5 | |||
| Suc | 2,629.6 | −0.28 | 1.2 | |||
| MSTscd | ||||||
| [516; 1H-Indole-2,3-dione, 1-(tert-butyldimethylsilyl)-5-isopropyl-, 3-(O-methyloxime)] | 1,691.2 | −0.04 | −2.0 | |||
| [771; α-d-Methylfructofuranoside (4TMS)] | 1,760.9 | −0.02 | 1.6 | |||
| [802; Methylcitric acid (4TMS)] | 1,909.57 | −0.06 | 2.2 | |||
| [926; Galactosylglycerol (6TMS)] | 2,297.2 | −0.12 | 5.9 | |||
| [802; Gulose (5TMS)] | 2,424.3 | 0.26 | 2.0 | |||
| [964; Trehalose (8TMS)] | 2,678.4 | 0.02 | 7.3 | |||
| [882; Melibiose (8TMS)] | 3,092.9 | −0.27 | 3.5 | |||
The response ratio of average −P root response compared with average +P root response is listed (t test significance of P ≤ 0.05 is indicated by bold format of the response ratio). For ratios lower than 1, the inverse of the ratio was estimated and the sign was changed.
Represents the sum of two or more metabolites.
Reference substance not yet available.
MSTs are characterized by match factor and mass spectral hit.
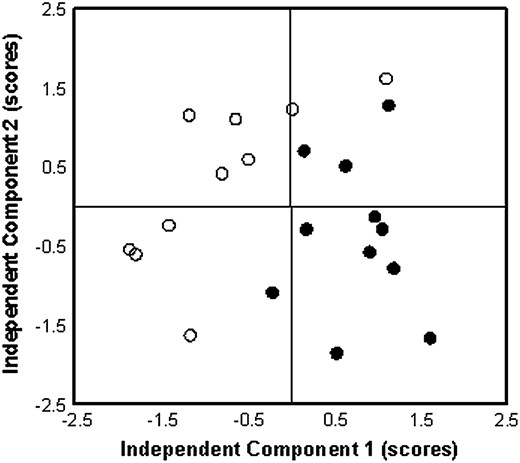
ICA of major metabolic variances in bean roots. Bean plants grown in P-sufficient (white circles) and P-deficient (black circles) conditions were used. Scores analysis demonstrates gradual differentiation of individual plants from a P-sufficient metabolic phenotype.
DISCUSSION
In this report, we have advanced the fundamental understanding of common bean root gene expression and plant adaptation to P deficiency by: (1) identifying differential patterns of gene expression in P-stressed roots through macroarray analysis; (2) identifying 372 TFs and evaluating their expression profile by quantitative RT-PCR; and (3) complementing gene expression analysis with unbiased metabolomic profiling. Transcript expression patterns revealed by hybridization of nylon filter arrays spotted with some 4,000 ESTs from bean −P roots cDNA library (Ramírez et al., 2005) resulted in a total of 126 differentially expressed genes with 2-fold or more induction or repression in −P roots (Tables I and II). In addition, transcript profiling of 372 TF genes identified from the bean gene index (TIGR/DFCI) resulted in 17 differentially expressed (2-fold or more) bean TF genes in −P versus +P bean roots (Table III). Nonbiased metabolite profiling using GC-MS technology led to the identification of 64 metabolites and 17 MSTs from bean roots, 42 of which showed ≥1.5-fold and/or significantly different −P to +P response ratios (Table IV). ICA analysis from the 81 identified metabolites revealed a gradual differentiation of individual plants from a P-sufficient metabolic phenotype (Fig. 4). Our results reveal a suite of responses ranging from changes in growth and development to altered gene expression and metabolic profile that may contribute to adaptation of common bean roots to P deficiency.
An overriding question regarding our macroarray experiments is: are genes designated as having enhanced expression during P stress in actuality responding to low P, or do they show enhanced expression due to root developmental effects? Several pieces of evidence suggest that a great many bean genes are responding to P stress. First, of the 50 TCs listed as induced during P stress in Table I, more than 80% have the majority of ESTs derived from a P stress root library. In fact, 11 of the 50 have 100% of their ESTs derived from the P stress root library. Second, semiquantitative RT-PCR of several P stress-induced genes (Fig. 2) show enhanced expression in P-stressed roots. Furthermore, an in silico statistical analysis of ESTs overrepresented in P stress libraries in legumes and Arabidopsis gene indices, similar to that described by Graham et al. (2006), showed that at least 50% of the TCs in Table I would be predicted to be highly expressed under P stress. Unfortunately, similar statistical methods cannot be applied to singletons or to underexpressed (underrepresented EST) TCs. However, semiquantitative RT-PCR of a number of underexpressed genes in Table II showed that they had reduced expression in P-stressed roots as compared to P-sufficient roots (Fig. 2).
As an initial step in responding to P deficiency, plants must sense that nutrient stress is occurring and transduce appropriate signals into processes that facilitate adaptation. Although the genes affecting P stress signal recognition and transduction in legumes are unknown, studies in Arabidopsis and rice have implicated MYB (PHR1), WRKY (WRKY75), and bHLH (OsPTF1) TFs in the P-signaling process (Rubio et al., 2001; Yi et al., 2005; Devaiah et al., 2007). Recently, the interaction of miRNA 399 with ubiquitin-conjugating enzyme (UBC) has also been demonstrated to play a key role in the P stress response of Arabidopsis (Fujii et al., 2005; Miura et al., 2005; Chiou et al., 2006). Our array study as well as those of others (Hammond et al., 2003; Uhde-Stone et al., 2003; Wu et al., 2003; Misson et al., 2005; Morcuende et al., 2007; Müller et al., 2007) have detected a plethora of putative signaling and regulatory genes that could be involved in P stress signaling. We found some 39 genes (Tables I–III2 3) that may contribute to P stress signal transduction/regulation in common bean roots. As in Arabidopsis, we found representatives of MYB, UBC, and bHLH gene families as either up- or down-regulated in expression. We detected three members of the MYB superfamily that were induced in P-deficient roots (Table III). Of these, TC 2883 had the highest similarity (93%) to Arabidopsis PHR1, a MYB gene implicated in the P deficiency response process. Three Arabidopsis genes have recently been documented to be involved in signal transduction and regulation of P acquisition/homeostasis. These genes encode WRKY75, PHO2 (an E2 conjugase), and SIZ1 (a SUMO E3 ligase; Miura et al., 2005; Aung et al., 2006; Bari et al., 2006; Devaiah et al., 2007). Common bean TCs 2419, 1095, and 2445 have high similarity to WRKY75, PHO2, and SIZ1, respectively. Although none of the bean TCs cited above had enhanced expression in P-stressed roots of common bean, their similarity of Arabidopsis P-signaling genes suggests that comparable bean TCs may play similar roles in bean. Noticeable is that all of the ESTs comprising TC 2419 and 1095 are derived from the P-stressed root library. Interestingly, TC 1622, which is up-regulated in P-deficient bean roots, encodes a putative UBC-ligase related to a pepper CaPUB1 that has been implicated in resistance to abiotic stress (Cho et al., 2006).
Studies with white lupin (Uhde-Stone et al., 2003; Liu et al., 2005) and Arabidopsis (Nacry et al., 2005; Karthikeyan et al., 2006; Müller et al., 2007) have shown that sugars and P stress signaling are closely interrelated. Rychter and Randall (1994) found that within 2 weeks of P stress, common bean partitioned more sugars to roots than nonstressed plants. The enhanced expression of P stress-induced genes requires the presence of available sugars. Deprivation of sugars by either shading or stem girdling blocks the expression of P stress-induced genes (Liu et al., 2005). Our metabolic analysis of bean P-stressed roots provides additional support for the role of sugars in P stress. Several sugars (Table IV) were more abundant in P stress roots as compared to P-sufficient roots, suggesting that sugars may be partitioned preferentially to P-stressed roots to support the expression of P stress-induced genes. It is noteworthy that PRL1-associated protein, encoded by CV543658, which has enhanced expression in P stress bean roots, is known to interact with SNF1 to derepress Glc metabolism, stimulate starch accumulation, and inhibit root elongation (Bhalerao et al., 1999). These traits are characteristic of P-stressed plants.
It is also worthwhile to note the reduced amounts of organic acids in P-stressed roots as compared to P-sufficient roots (Table IV). It is well known that P-stressed legume roots release organic acids as a P-adaptive mechanism (Johnson et al., 1996; Neumann and Römheld, 1999; Shen et al., 2002; Dong et al., 2004). Release of organic acids into the rhizosphere enhances Pi solubilization, making P more available. The reduced amount of organic acids in P-deficient roots more than likely reflects exudation from the root into the rhizosphere. The altered organic acid content of P-stressed roots is also reflected in the reduced expression of TC 1864 isocitrate dehydrogenase-ICD (Table II). This enzyme is a key regulatory enzyme in the tricarboxylic acid cycle. Reduced expression of ICD would lead to a buildup of malate acids that could be available for exudation into the rhizosphere.
Almost 23% of the genes showing enhanced expression in P-stressed bean roots encode proteins having roles in either stress/defense or secondary metabolism (Table I). Hammond et al. (2003) have shown that many genes that respond to P stress in Arabidopsis shoots also respond to other environmental challenges, including salinity, wounding, pathogen attack, anoxia, and other nutrient stresses. In bean, P stress results in the induction of oxidative responses, including increased lipid peroxidation, elevated peroxide levels, and increased catalase and peroxidase activity (Juszczuk et al., 2001). Our results confirm and extend this observation by showing that genes encoding proteins in several aspects of oxidative stress have enhanced expression in P-stressed roots. Moreover, several genes implicated in plant response to diseases, such as PR and NBS-LRR resistance, are up-regulated in bean P-stressed roots along with genes involved in phenylpropanoid synthesis (Table I). Similar patterns of gene activation have been noted for plants undergoing potassium, zinc, iron, and N deficiency stress (Wang et al., 2002; Armengaud et al., 2004; Shin et al., 2005; van de Mortel et al., 2006).
Because enhanced Pi transporter gene expression is highly indicative of the Pi stress response (Raghothama, 1999; Smith, 2001), it was surprising that we did not find any Pi transporter to be highly expressed in P-stressed common bean roots. In fact, we found only a single Pi transporter EST derived from the P-stressed root library. The lack of Pi transporter ESTs in the root library could reflect that the library was made from roots of 21-d-old P-stressed plants. Perhaps earlier sampling dates would have yielded more Pi transporters. On the other hand, we did detect enhanced expression of other types of transporters, including a putative aquaporin, an ATP-binding cassette transporter, and an acetylglucosamine transporter (Table I).
As demonstrated in Figure 1C and previously shown in numerous studies, the root to shoot ratio increased in P-stressed plants as compared to P-sufficient plants. The ratio change was due in part to proliferation of lateral roots in P-stressed plants. Modified root architecture in response to P stress has been noted previously in common bean (Rychter and Randall, 1994; Lynch, 1995; Ge et al., 2000; Liao et al., 2001; Lynch and Brown, 2001) and Arabidopsis (López-Bucio et al., 2003; Ma et al., 2003; Wu et al., 2003). Phosphate starvation was recently shown to induce determinant root development programs in Arabidopsis (Sánchez-Calderón et al., 2005). Recently, quantitative trait loci for root architecture traits that correlate with P acquisition have been identified in bean, strengthening the importance of root structure for low P adaptation (Beebe et al., 2006). Modification of root architecture in response to P deficiency results from the interplay between internal balance of the phytohormones auxin, cytokinin, and ethylene (Gilbert et al., 2000; Williamson et al., 2001; Al-Ghazi et al., 2003; López-Bucio et al., 2003; Ma et al., 2003; Karthikeyan et al., 2006). As one might expect, we found several genes in bean roots related to phytohormone biosynthesis and activity to be responsive to P. Accompanying increased lateral root growth, genes involved in cell wall synthesis and growth were responsive to P.
Reduced shoot growth accompanied by reduced photosynthetic rate (Fig. 1) was symptomatic of P stress in bean. Phosphate content and photosynthesis are related in several ways, and alteration of photosynthesis as a result of P starvation has been shown for several plant species, including common bean (Rychter and Randall, 1994; Mikulska et al., 1998). It has been shown that tobacco plants grown under P deficiency have reduced photosynthate demand in sink organs, resulting in carbohydrate accumulation and decrease in net photosynthesis (Pieters et al., 2001). Our data support the proposition of Morcuende et al. (2007) that repression of photosynthesis may be a secondary response linked to lower demand of photosynthate and higher sugar levels during P limitation.
The results from this work provide an abundance of candidate genes with diverse function that are postulated to play important roles in adaptation of common bean plants to P deficiency. These newly identified genes may be of utility in marker-assisted selection for P-efficient genotypes. The identified candidate genes expand the current information available on the regulation and signaling pathways during P deficiency in plants. In future studies, we propose to define the precise roles of selected candidate genes using reverse genetics approaches.
MATERIALS AND METHODS
Plant Material and Growth Conditions
The common bean (Phaseolus vulgaris) Mesoamerican ‘Negro Jamapa 81’ was used in this study. Plants were grown in controlled-environment (26°C–28°C, 16-h photoperiod) greenhouses at Centro de Ciencias Genómicas/Universidad Nacional Autónoma de México (Cuernavaca, México) and Max Planck Institute of Plant Molecular Physiology (Golm, Germany), or in growth chambers at the University of Minnesota (St. Paul). Surface-sterilized seeds were germinated at 30°C for 3 d over sterile wet filter paper and then planted in pots with vermiculite or coarse quartz sand. Pots were watered 3 d per week with the plant nutrient solution reported by Summerfield et al. (1977). For −P conditions, K2HPO4 concentration of the plant nutrient solution was reduced from 1 mm to 5 μ m. In −P conditions, cotyledons from each plant were cut 1 week after planting. Plants were grown for 3 weeks before harvesting. Roots for RNA isolation were harvested directly into liquid nitrogen and stored at −80°C.
Soluble Pi Concentration
Soluble Pi content was determined in leaves, stems, and roots from plants grown for 3 weeks in −P or +P conditions using the colorimetric assay reported by Taussky and Shorr (1953). For each assay, tissues were harvested, weighed, and immediately homogenized in 10 n TCA. For each determination, 12 replicates were analyzed. These were derived from three independent experiments with plants grown in similar conditions with four replicate assays from each treatment (−P roots or +P roots) per experiment.
Photosynthesis and Photosynthetic Pigments Content
The relationship between CO2 assimilation rate (Pn), increasing Ci, and stomatal conductance and resistance was determined using a portable photosynthesis system (LI-6200 Primer; LI-COR) in −P- versus +P-treated plants. The measurements from mature bean trifolia were undertaken in a greenhouse maintaining leaf temperature and photosynthetically active photon flux density at 25°C and 1,600 μmol m−2 s−1, respectively. Each point represents the average of 12 determinations from three independent experiments with plants grown in similar conditions and four replicate assays from each treatment (−P roots or +P roots) per experiment. The CO2 assimilation rate was adjusted to each leaf area value.
Photosynthetic pigments were extracted from freshly harvested, fully expanded leaves using 80% (v/v) acetone. Carotenes and chlorophyll (a and b) were determined spectrophotometrically at 470, 663, and 646 nm wavelength, respectively, as reported (Wellburn, 1994).
EST Sequencing and Annotation
Because the macroarrays used in this study were spotted prior to sequencing, 65 of the spotted clones had poor quality sequence and were not included in sequence-based analyses (Ramírez et al., 2005; TIGR/DFCI, Quackenbush et al., 2001) or submitted to GenBank. To include these clones in our analyses, the clones were resequenced. DNA sequencing was performed at the Advanced Genetic Analysis Center (University of Minnesota) and at the Center for Genomic Sciences/Universidad Nacional Autónoma de México (Cuernavaca, México). The new sequences were submitted to GenBank (accession nos. EH791054–EH791109, EH792671–EH792678, and EH795233).
To assign newly sequenced ESTs to existing TCs in the TIGR/DFCI Common Bean Gene Index, the EST sequences were compared to the TCs using TBLASTX (Altschul et al., 1997). To confirm the placement of the EST with the putative matching TIGR/DFCI TC, the overlap of both sequences was checked using the SeqManII program in the DNASTAR software package. Sequence matching indicated that the analyzed bean sequence belonged to the TC, as indicated in Tables I and II. To annotate the sequences described in Tables I to III2 3, all sequences were cross referenced with the TIGR/DFCI Common Bean Gene Index to find the corresponding TCs or singletons. TC or singleton sequences were compared to the Uniprot (version July 2006; Apweiler et al., 2004) protein database using BLASTX and an E-value cutoff of E < 10−4.
Nylon Filter Arrays, Hybridization, and Data Analysis
The preparation of a cDNA library from roots from P-deficient bean ‘Negro Jamapa 81’ plants and the sequence of ESTs (4,329) have been reported (Ramírez et al., 2005; Graham et al., 2006). For macroarray preparation, the cDNA portion of each root EST was amplified by PCR using standard T3 and T7 primers. The PCR products were spotted onto Gene Screen Plus membranes (NEN Life Science Products) using the Q-bot (Genetix) automated spotting system.
Total RNA was isolated from 4 g frozen roots (as reported by Chang et al. [1993]) from plants grown under similar −P or +P conditions in four independent experiments. Radiolabeled cDNA probes were synthesized from total RNA (30 μg) by RT, as reported (Ramírez et al., 2005). Hybridization and washing conditions of nylon filters were performed as reported (Ramírez et al., 2005). Ten independent nylon filter arrays were hybridized with cDNA from each treatment.
Hybridized filters were exposed to phosphor screens for 5 d, and the fluorescent intensity of each spot was quantified as reported (Ramírez et al., 2005; Tesfaye et al., 2006). To work with highly reproducible experiments, linear regression analysis was performed for each pair of membrane replicas; only those replicas for which the linear model could explain at least 80% of the variation (r2 ≥ 0.8) were considered. This process yielded a total of six well-correlated replicas for each treatment: −P roots and +P roots, respectively. Array data were normalized and quantified using GeneSpring (version 7.2; Silicon Genetics), as provided by the Supercomputing Institute at the University of Minnesota. t tests were performed with a P-value cutoff of ≤0.05.
RT-PCR Analysis for Verification of Array Analysis
Total RNA for RT-PCR was isolated from 3 g frozen roots using the RNeasy isolation kit (Qiagen). Quantification of transcripts was performed using two-step RT-PCR following the manufacturer's directions (Ambion and Invitrogen) using poly thymine deoxynucleotide primer. The sequences of oligonucleotide primers and conditions used in RT-PCR reactions are shown in Table V
Primers and conditions used for semiquantitative RT-PCR
Target Gene | EST/TC No. | GenBank Accession No. of EST | Forward Primer (5′–3′) | Reverse Primer (5′–3′) | Product Size | Annealing Tm/Cycles |
|---|---|---|---|---|---|---|
| bp | ||||||
| Peroxidase | TC397 | CV542921 | CCA ACC AAA CAC TTG CCA ATG | GAG TAG TAG GCC TTG TCG AAT | 313 | 58°C/20 |
| Glycolipid transfer protein-like | TC1903 | CV543709 | GTT GTT CTC AGT CTG CGA TCA | TAT TGG AGT GGA TGG CAA CGA | 751 | 60°C/25 |
| Translationally controlled tumor protein | TC63 | CV542788 | CGC TCC GCA CCA GTT ATC A | GGA TCA GTG GCA CCG TCC TTG | 528 | 60°C/25 |
| No BLAST hit | RTS_103_E03 | CV541966 | GGC TTC AAA ATC CTC ACG C | GCT TGT TGC TAT CTC AAA CGC | 214 | 60°C/20 |
| UDP-Glc-6-dehydrogenase | TC1804 | CV541174 | GGC TTT ATG TTC TTC TAT GTT | TGA AAC CCT CAA ATA TTA CTC | 138 | 52°C/25 |
| Cytosolic aldehyde dehydrogenase | TC733 | CV542619 | CCG TGT GCT CGT TCA AG | ATC TCC TCC TGC ACT ATT CTC | 282 | 52°C/25 |
| Senescence-related dihydroorotate dehydrogenase | RTS_109_B06 | EH792671 | ATA GCA CTT GGG AAG GTG ATG | GTCTTTGTCAGATTG CAAGCC | 359 | 55°C/25 |
| ACC oxidase | TC280 | CV542243 | TGG CAC CAA AGT TAG CAA CTA | ATT CTG GTG CCA TCC GTT TGA | 270 | 57°C/25 |
| Hypothetical protein | TC1992 | CV542243 | AAC AGT CAA AAG TAT CAC ACG | GAT TCA GGG TTT CAG TAT AGG | 219 | 55°C/25 |
| Isocitrate dehydrogenase (NADP) | TC1864 | CV541923 | CCC TGA CGG AAA GAC TAT TGA | ACC TTT ACT TTC TGC GGT GCC | 593 | 60°C/20 |
| S-adenosyl Met decarboxylase | TC83 | CV543847 | TAC TTG GGA CTG TTG TTA TCA | TAA ACT CAC GGG TAT AGC TTG | 1,589 | 60°C/20 |
| Ribosomal protein 40 S | TC1613 | CV543229 | TTT CTA GGG TTT CGC TCG GTA | TAA ACA GAA ACA AAC GCC ATA | 600 | 60°C/25 |
| Transporter-like protein | TC2875 | CV543019 | TGC TTC TTC GCC ACA ACT CAA | CCT TCC AAG ATG TAG CCG TCA | 476 | 60°C/25 |
| Trehalose-6-P synthase | RTS_114_F03 | CV542030 | TTT CTA AGA ATG AAG CGA GAT | GAT CCA TCA GTT GTT TCG GTA | 116 | 52°C/25 |
| Phosphoribosylanthranilate transferase | RTS_139_D07 | CV543777 | TGG CCA TGC AGA TTG TG | GGA TTA ACA TTA TGC GAT GAA | 144 | 52°C/25 |
| Caffeine-induced death protein 1 | RTS_143_D10 | CV544078 | AAG CAA AAG CAA TTA GTG GC | ATAGCAAGGCAAACAT CAATG | 134 | 57°C/25 |
| AMP diaminase | TC1176 | CV543772 | GAC ACT TAT GCC GGT TAT T | GGC GAT CAC ACC ATG CGT TAC | 136 | 52°C/25 |
| Multidrug resistance protein 11 | TC2799 | EH791098 | CAG CAG TGT GAA ATT AAT GGC | GTT TTT GGG GGT GGA TTG CAT | 111 | 57°C/25 |
| Ubiquitin | TC29 | CV543388 | CCA TAA CTC TTG AGG TGG AGA G | CTT CCC AGT CAA GGT CTT GAC | 480 | 55°C/25 |
TF Gene Selection and RT-PCR Primer Design
Genes (EST/TC) coding for proteins specifically involved in transcriptional regulation were selected from the TIGR/DFCI Common Bean Gene Index (www.tigr.org). For protein domain prediction, Inter-Pro Release 11 (www.ebi.ac.uk/interpro) was used. The text of all Inter-Pro database entries was searched for the specific strings “*transcription*”, “*DNA*binding*”, and “*zinc*finger*” using the SRS search tool (www.ebi.ac.uk/interpro/search.html). The identified domains were assembled in a list. The list was supplemented by Inter-Pro domains that are components of the Gene Ontology (GO) branches “Transcription factor activity” (GO:0003700), “Transcriptional activator activity” (GO:00165643), “Transcriptional repressor activity” (GO:0016564), and “Two-component response regulator activity” (GO:0000156). The GO-Inter-Pro mappings were found using the QuickGO browser on the Inter-Pro page (www.ebi.ac.uk/ego/). In total, 1,533 domains of proteins potentially involved in transcriptional regulation were selected.
Subsequently, all common bean sequences were analyzed for the occurrence of these domains using Inter-ProScan (www.ebi.ac.uk/Inter-ProScan). In 372 sequences, 41 of the preselected domains were found. The Inter-Pro descriptions of these domains were evaluated to select the domains of proteins that are involved in transcriptional regulation.
RT-PCR primers were generated for the 372 TF genes with TIGR's Primer Design Pipeline, which was designed with the aims of high throughput and specificity. The pipeline iterates through three phases: design, specificity, and selection.
First, the design phase queried every region of the target TF sequences with sliding windows to generate primer set candidates that fit the experimental requirements. Each sliding window was 250 bp across and stepped 50 bp along the target sequence per iteration. The experimental requirements were enforced by the following MIT Primer3 (Rozen and Skaletsky, 2000) parameters: PRIMER_MIN_TM 58, PRIMER_OPT_TM 60, PRIMER_MAX_TM 62, PRIMER_SELF_ANY 6, PRIMER_SELF_END 2, PRIMER_MAX_POLY_X 3, and PRIMER_PRODUCT_SIZE_RANGE′60 to 150′.
Next, the specificity phase aligned primer candidates via WU-Blast (W. Gish, 1996–2004; http://blast.wustl.edu) to the TIGR/DFCI Common Bean Gene Index. The selection phase then discarded primer candidates that registered possible secondary hits, defined as specificity alignments that achieved 80% or greater identity over the length of the primer and included at least one of the terminal ends of the primer in the alignment. The remaining, qualifying primer sets were further prioritized by self-complementarity and poly-X characteristics to achieve selection of the most preferred primers for every target.
The primer design pipeline was implemented in object-oriented Perl modules and supported by a relational MySQL database. Sequences of primer pairs used to amplify each TF gene are shown as Supplemental Data.
Real-Time RT-PCR Conditions and Analysis of Bean TF
Total RNA for real-time RT-PCR was isolated from 400 mg frozen roots based on the protocol reported by Heim et al. (1993). Three biological replicas were isolated for each treatment (−P and +P roots), extracting RNA from different sets of plants grown in similar conditions. RNA concentration was measured in NanoDrop ND-1000 spectrophotometer (NanoDrop Technologies), and 10 μg of total RNA was digested with TURBO DNase (catalog no. 1907, Ambion), adding ribonuclease inhibitor (catalog no. N211B, Promega) and following the manufacturer's directions. Absence of genomic DNA contamination was subsequently confirmed by real-time PCR amplification, using primers designed for the bean E2 UBC9 reference gene (TC362; primers: F, 5′-GCTCTCCATTTGCTCCCTGTT-3′; R, 5′-TGAGCAATTTCAGGCACCAA-3′). cDNA was synthesized using SuperScriptIII reverse transcriptase (Invitrogen), according to manufacturer's instructions. The efficiency of cDNA synthesis was assessed by real-time PCR amplification of control UBC9 gene. Only cDNA preparations that yielded similar CT values (i.e. 19 ± 1) for the reference gene were used for comparing TF transcript levels.
Quantitative determinations of relative transcript levels of TF genes using RT-PCR were carried out at the Max Planck Institute of Molecular Plant Physiology (Golm, Germany) according to Czechowski et al. (2004). Each real-time RT-PCR run for the whole set of TF genes (372) plus reference (housekeeping) and marker genes was performed in a 384-well plate. The bean phosphatase gene (TC201), which is highly induced in P-deficient roots (Ramírez et al., 2005), was included as a P deficiency marker in every real-time PCR run. The primers used for phosphatase gene amplification are: F, 5′-GCCCAAGTTTGAGGCTGAAAG-3′; R, 5′-TCAAGTCCCACACCGGAAAGT-3′. TF gene expression was normalized to that of UBC9, which was the most constant of the four housekeeping genes included in each PCR run. −P/+P average expression ratios were obtained from the equation
Plant Metabolite Extraction
Plant metabolite extraction from root samples of −P- and +P-treated bean plants and GC-MS metabolite profiling was done as reported previously for Lotus japonicus (Colebatch et al., 2004; Desbrosses et al., 2005). Twelve replicate samples each of roots from plants grown under +P and −P conditions were harvested from pods, rinsed with tap water, dried on filter paper, and shock frozen in liquid nitrogen. Frozen samples of 60 to 150 mg fresh weight (FW) were ground 3 min in 2-mL micro vials with a clean stainless steel metal ball (5-mm diameter) using a Retschball mill set at 20 cycles s−1. Grinding components of the mill were cooled with liquid nitrogen to keep samples deep frozen. Frozen powder was extracted with hot MeOH/CHCl3 and the fraction of polar metabolites prepared by liquid partitioning into water and further processed as described (Desbrosses et al., 2005).
GC-Time of Flight-MS Metabolite Profiling
GC-time of flight (TOF)-MS profiling was performed using a FactorFour VF-5ms capillary column, 30 m long, 0.25 mm i.d., 0.25 μm film thickness with a 10-m EZ-guard precolumn (Varian BV), and an Agilent 6890N gas chromatograph with splitless injection and electronic pressure control (Agilent) mounted to a Pegasus III TOF mass spectrometer (LECO Instrumente). Details of GC-TOF-MS adaptation of the original profiling method (Desbrosses et al., 2005) are described by Wagner et al. (2003) and Erban et al. (2006). Metabolites were quantified after mass spectral deconvolution (ChromaTOF software version 1.00, Pegasus driver 1.61; LECO) of at least three mass fragments for each analyte. Peak height representing arbitrary mass spectral ion currents of each mass fragment was normalized using the amount of the sample FW and ribitol for internal standardization of volume variations to obtain normalized responses (per gram FW) and response ratios as described (Colebatch et al., 2004; Desbrosses et al., 2005).
Identification of Metabolites within GC-MS Metabolite Profiles
Metabolites were identified using the NIST05 mass spectral search and comparison software (National Institute of Standards and Technology; http://www.nist.gov/srd/mslist.htm) and the mass spectral and RI collection (Schauer et al., 2005) of the Golm Metabolome Database (Kopka et al., 2005). Mass spectral matching was manually supervised, and matches were accepted with thresholds of match >650 (with maximum match equal to 1,000) and RI deviation <1.0%. Information on the polar metabolites, using the corresponding mass spectral identifiers can be found at http://csbdb.mpimp-golm.mpg.de/csbdb/gmd/msri/gmd_smq.html. Metabolites are characterized by chemical abstracts system identifiers and compound codes issued by the Kyoto Encyclopedia of Genes and Genomes (Kanehisa et al., 2004). Metabolites were identified by standard substances or by MSTs. The term MST is used for repeatedly occurring yet nonidentified compounds, which can be recognized by mass spectrum and RI, as defined earlier (Colebatch et al., 2004; Desbrosses et al., 2005). MSTs are characterized and named by best mass spectral match to compounds identified by NIST05 or Golm Metabolome Database using match value and hit name (Table IV). The response ratio −P to +P for each metabolite/MST was calculated dividing the average metabolite concentration from 12 samples from roots of P-deficient plants over the average metabolite concentration from 12 samples from roots of control plants (Table IV).
ICA and Statistical Analysis
ICA (Scholz et al., 2004) was applied to metabolite profiles (as compiled in supplemental data). Data were normalized by calculation of response ratios using the median of each metabolite as denominator and subsequently subjected to logarithmic transformation. Missing value substitution was as described earlier (Scholz et al., 2005). Statistical testing was performed using the Student's t test. Logarithmic transformation of response ratios was applied for approximation of required Gaussian normal distribution of metabolite profiling data.
Sequence data from this article can be found in the GenBank/EMBL data libraries under accession numbers EH791054 to EH791109, EH792671 to EH792678, and EH795233.
Supplemental Data
The following materials are available in the online version of this article.
Supplemental Table S1. Root transcript levels of all the genes in the common bean macroarray.
Supplemental Table S2. Complete list of common bean TF gene and primer sequences.
Supplemental Table S3. Root transcript levels of all common bean TF genes determined by real-time RT-PCR.
Supplemental Table S4. Complete metabolic profile response from common bean roots.
ACKNOWLEDGMENTS
We are grateful to Victor M. Bustos for plant maintenance and to Guillermo Dávila and Rosa I. Santamaría for providing the facility and for technical assistance for DNA sequencing at CCG/Universidad Nacional Autónoma de México.
LITERATURE CITED
Al-Ghazi Y, Muller B, Pinloche S, Tranbarger TJ, Nacry P, Rossignol M, Tardieu F, Doumas P (
Beebe SE, Rojas-Pierce M, Yan X, Blair MW, Pedraza F, Muñoz F, Tohme J, Lynch JP (
Broughton WJ, Hernández G, Blair M, Beebe S, Gepts P, Vanderleyden J (
Chang S, Poryear J, Cairney J (
Colebatch G, Desbrosses G, Ott T, Krussell L, Montanari O, Kloska S, Kopka J, Udvardi MK (
Dong D, Peng X, Yan X (
Erban A, Schauer N, Fernie AR, Kopka J (
Ge Z, Rubio G, Lynch JP (
Gilbert GA, Knight JD, Vance CP, Allan DL (
Graham PH, Rosas JC, Estevez de Jensen C, Peralta E, Tlusty B, Acosta-Gallegos J, Arraes Pereira PA (
Heim U, Weber H, Bäumlein H, Wobus U (
Juszczuk IM, Malusa E, Rychter AM (
Karthikeyan AS, Varadarajan DK, Jain A, Held MA, Carpita NC, Raghothama KG (
Liu J, Samac DA, Bucciarelli B, Allan DL, Vance CP (
Lynch JP, Brown KM (
Mikulska M, Bomsel JL, Rychter AM (
Misson J, Raghothama KG, Jain A, Jouhet J, Block MA, Bligny R, Ortet P, Creff A, Somerville S, Rolland N, et al (
Neumann G, Römheld V (
Plaxton WC (
Riechmann JL (
Rozen S, Skaletsky H (
Rychter AM, Randall DD (
Shen H, Yan X, Zhao M, Zheng S, Wang X (
Summerfield RJ, Huxley PA, Minchin FR (
van de Mortel JE, Villanueva LA, Schat H, Kwekkeboom J, Coughlan S, Moerland PD, van Themaat EVL, Koorneef M, Aarts MGM (
Wasaki J, Yonetani R, Kuroda S, Shinano T, Yasaki J, Fujii F, Shimbo K, Yamamoto K, Sakata K, Sasaki T, et al (
Wellburn AR (
Author notes
This work was supported by Consejo Nacional de Ciencia y Tecnología, México (grant no. G31751–B at Centro de Ciencias Genómicas/Universidad Nacional Autónoma de México [UNAM]); by Dirección General de Asuntos del Personal Académico/UNAM, México (grant no. PAPIIT: IN211607 and sabbatical fellowship to G.H.); by the U.S. Department of Agriculture, Agricultural Research Service (grant nos. CRIS 3640–21000–024–00D “Functional Genomics for Improving Nutrient Acquisition and Use in Legumes” and USDA–FAS MX161 “Functional Genomics of Symbiotic Nitrogen Fixation and Root Adaptation to Phosphorus Deficiency in Phaseolus vulgaris” at the University of Minnesota); and by the German Academic Exchange Service (research stay fellowship to G.H.).
Present address: CNAP Research Laboratories, Department of Biology (Area 7), University of York, Heslington, PO Box 373, York YO10 5YW, UK.
Corresponding author; e-mail gina@ccg.unam.mx; fax 52–777–3175581.
The author responsible for distribution of materials integral to the findings presented in this article in accordance with the policy described in the Instructions for Authors (www.plantphysiol.org) is: Georgina Hernández (gina@ccg.unam.mx).
The online version of this article contains Web-only data.
Open Access articles can be viewed online without a subscription.
