Article Text

Abstract
Background and objectives Although ethnic group variations in cancer exist, no multiethnic, population-based, longitudinal studies are available in Europe. Our objectives were to examine ethnic variation in all-cancer, and lung, colorectal, breast and prostate cancers.
Design, setting, population, measures and analysis This retrospective cohort study of 4.65 million people linked the 2001 Scottish Census (providing ethnic group) to cancer databases. With the White Scottish population as reference (value 100), directly age standardised rates and ratios (DASR and DASRR), and risk ratios, by sex and ethnic group with 95% CI were calculated for first cancers. In the results below, 95% CI around the DASRR excludes 100. Eight indicators of socio-economic position were assessed as potential confounders across all groups.
Results For all cancers the White Scottish population (100) had the highest DASRRs, Indians the lowest (men 45.9 and women 41.2) and White British (men 87.6 and women 87.3) and other groups were intermediate (eg, Chinese men 57.6). For lung cancer the DASRRs for Pakistani men (45.0), and women (53.5), were low and for any mixed background men high (174.5). For colorectal cancer the DASRRs were lowest in Pakistanis (men 32.9 and women 68.9), White British (men 82.4 and women 83.7), other White (men 77.2 and women 74.9) and Chinese men (42.6). Breast cancer in women was low in Pakistanis (62.2), Chinese (63.0) and White Irish (84.0). Prostate cancer was lowest in Pakistanis (38.7), Indian (62.6) and White Irish (85.4). No socio-economic indicator was a valid confounding variable across ethnic groups.
Conclusions The ‘Scottish effect’ does not apply across ethnic groups for cancer. The findings have implications for clinical care, prevention and screening, for example, responding appropriately to the known low uptake among South Asian populations of bowel screening might benefit from modelling of cost-effectiveness of screening, given comparatively low cancer rates.
- Epidemiology
This is an open-access article distributed under the terms of the Creative Commons Attribution Non-commercial License, which permits use, distribution, and reproduction in any medium, provided the original work is properly cited, the use is non commercial and is otherwise in compliance with the license. See: http://creativecommons.org/licenses/by-nc/2.0/ and http://creativecommons.org/licenses/by-nc/2.0/legalcode.
Statistics from Altmetric.com
Article summary
Article focus
-
The Scottish Health and Ethnicity Linkage Study examined whether all cancers, and lung, colorectal, breast and prostate cancer separately, in the period 2001–2008, varied by 2001 Scottish Census ethnic group categories.
Key messages
-
The main public health lesson and challenge is for the majority population, for the ‘Scottish effect’ in relation to cancer does not apply across Scotland's ethnic groups.
-
This exemplifies how the study of ethnic variations provides a public health approach with potential to benefit the entire population.
Strengths and limitations of this study
-
The strength of the study is the development of a retrospective cohort with high overall linkage rates in a national population; the exploration of the potential role of socio-economic variables and country of birth available in the Census; and the linkage of Census data to both cancer registry and community/hospital mortality data.
-
The limitations include the small numbers of outcomes for some non-White populations, and the consequent aggregation of some ethnic groups; variation in linkage rates by ethnic group; inability to capture events that occur overseas outside the UK and lack of individually linkable cancer risk factor data.
Introduction
Cancer is a dominant cause of death in industrialised countries, and particularly common in Scotland1 Cancer incidence varies hugely across countries, between country of birth/ethnic groups and over time, thus clearly indicating that the causes of cancer are largely environmental. Examination of such variations, including by country, by country of birth and when possible ethnic group, has proven to be of value both in sparking causal research and in assessing disease burden, healthcare priorities and patients’ needs.2
Given international variations, it is not surprising that major differences in cancer frequency are demonstrable by ethnic group.2 ,3 Ethnic group studies on cancer have mostly utilised the proxy indicator country of birth, which is usually available in both population registries and censuses (supplying denominators) and sometimes in cancer and death registration systems. The limitations of this proxy have been discussed elsewhere,4 ,5 including that, especially in European countries with colonial histories such as Scotland, many of the elderly were born abroad, and substantial proportions (often 50% or more) of resident ethnic minority populations are not born abroad. Name search methods are also popular6–9 but have even more limitations, for example, they are not good for studying White minority groups and African and Caribbean origin Black populations.4 ,5 A recent survey of European cancer registries concluded that while self-reported ethnicity was the exemplary variable, none of 79 registries analysed data this way, with Scotland being closest to achieving this goal.4
Within multiethnic countries proper ethnic group data are needed to maintain valid surveillance of cancer trends and inequalities, to set priorities, to ensure equitability of service delivery and to further develop hypotheses on causation.10 The few studies that use reported ethnic group in Europe may have a high proportion with missing ethnicity. The best such studies combine this with country of birth.3 ,8 Such is the scarcity of data that a 2007 paper reported on observer-assigned ethnic group on 2713 people followed up for 19.9 years, yielding six cases in South Asian men, and 26 in African-Caribbean men.11 Linkage of cancer registration and hospital episode statistics (providing ethnicity) in England is demonstrating the importance of this approach, despite some limitations, for example, missing data.12–15 Most available studies in Europe analyse data at a point or period of time, that is, cross-sectional analyses using numerators and denominators from different sources, creating potential errors in calculations of rates.3 ,16 The field is developing internationally with recent work using name search methods in Canada6 and linkage methods in New Zealand,17 with interest in multination comparisons for specific ethnic groups.18
Ethnic variations in cancer, mostly using country of birth,3 have been noted with, for example, comparatively lower mortality for all combined and four major cancers in South Asian migrants in England and Wales.3 ,16 Studies based on country of birth16 and ethnicity data in England and Wales12 support the role of environmental factors in explaining this variation. There is evidence of change over time and across generations, though cancer inequalities persist, some narrowing, others widening.19
The Scottish Health and Ethnicity Linkage Study compared all cancers (without non-melanoma skin cancers), and lung, colorectal, breast and prostate cancer separately, in the period 2001–2008 by ethnic group categories as reported in the 2001 Scottish Census.20 These cancers were chosen as the commonest cancers in Scotland, prioritised by national public health strategy.1
Scotland has a higher incidence of cancers compared to England and Wales and people born in Scotland living in England and Wales also have comparatively high rates.16 ,19 The background information on Scotland's health services, cancer data systems, the ethnic mix of the population and previous research on Scottish populations by ethnic group has been summarised recently by Arnold and Brewster4 (Ch 4.4). Data on cancer by ethnic group in Scotland are old, limited in scope and from small-scale studies2 ,9 ,21 ,22 focusing solely on Chinese, South Asians and Italians and published in the 1980s and early 1990s. These studies are summarised in box 1.
Brief overview of Scottish studies on ethnic variations in cancer
-
Muir reported that Harkness (1993, unpublished) examined nasopharyngeal cancers in Scotland, identifying Chinese people by name recorded on the cancer register. The age standardised rate was 0.3/100 000 in the entire Scottish population, and 13.7 in people with Chinese names.2
-
Black found substantial differences between Italian-born residents and the Scottish population in laryngeal and stomach cancer (higher in men) and lung cancer (lower in men and women).21
-
Merchant et al identified Indian and Pakistani men by name in the cancer registry and compared cancer rates to those of the Bombay cancer registry and the whole Scottish population.22 Oral cancer in Scottish Indians/Pakistanis was intermediate between the Bombay and Scotland rates. Similar observations were made for lung cancer in men and breast cancer in women.
-
Matheson et al found cancers between 1961 and 1981 in South Asian adults by name search in the West of Scotland, reporting comparatively low rates of colorectal, breast and bronchial cancer, but high rates of cervical cancer.9
This paper reports new, more comprehensive data from Scotland using a national, retrospective cohort study. It also includes both an examination of the potential for adjusting for socio-economic confounding and studying the effects of country of birth in relation to ethnicity. Finally, using risk factor data from Health Survey for England and Scottish Health Survey we interpret our results indirectly (in the absence of linkable risk factor data).
Methods
The methods of our retrospective cohort study are published, and key details on linkage are also given in appendix 1.20 ,23 We followed a strict protocol that preserved anonymity and maintained separation of personal data from the Census and NHS, and clinical data (see also ethics below). We used computerised matching of names, addresses and dates of birth to link the Census 2001 for Scotland, which provided ethnic group as reported by either individuals or the householder completing the form based on a question followed by a choice of 14 categories (appendix 1, table A1, which also provides linkage by ethnic group), and other demographic and socio-economic variables, to the Scottish Community Health Index (CHI), which is a register of patients using the NHS. We then matched, using CHI number, to an already linked death in the community and hospital, and cancer registration records (SMR06) database.
Ethnic group is a legally required field that was well completed (95.8%) and, after imputation (4.3%), available for 100% of those completing the census form (which is also a legal obligation). (For details see: http://www.gro-scotland.gov.uk/census/censushm/censcr02/data-quality/census-variables/results-and-conclusions/appendix-d-person-items-reports-and-tables-p10-to-p-17.html; accessed 26 April 2012). About 95% of the people participating in the 2001 census (4.9 million) were linked as above to health records, that is 4.65 million, with 85% or more linked in every ethnic group20 (see appendix 1). The total estimated Scottish population was 5.06 million so our cohort of 4.65 million includes about 92% of the 2001 population. While the identities of those not completing a census form are unknown; it is estimated in census validity studies that a higher proportion of non-White than White groups were non-completers—estimated at, for example, 10.2% of Pakistanis and 3.8% of White Scottish.
The ethnic group categories (and labels) follow those of the Scottish Census 2011, given in appendix 1.20 Because of small numbers we grouped Bangladeshis with other South Asians; and Caribbean, African and Black Scottish or other Black, into one ‘African origin’ group. Further grouping was sometimes necessary because of small numbers in analysis of specific cancers as described in the results. Mostly, following our analytical strategy, ethnic groups were sometimes omitted to avoid potential disclosure of identity.
About 90% of the cases were obtained from the cancer registry, 10% from mortality files. Cancers are registered at diagnosis, so mortality data add cases where the diagnosis was first made outside Scotland, which is especially important for mobile ethnic minority groups. A date of embarkation field is in the registry but we did not think this was reliable enough in relation to non-UK migration to use to adjust denominators. More than 90% of the Scottish Cancer Registry records for 2001–2008 were linked to our census-extract file. We excluded non-melanoma skin cancer. The ICD codes used are in box 2. Other non-cancer health outcomes were excluded from the analysis file for reasons given in the ethics section below.
ICD codes used in the study
Up to 31 December 1996 ICD9 codes were used by the Cancer Registry (needed for 10 year look-back)
Lung cancer ICD9 162
Breast cancer ICD9 174
Prostate cancer ICD9 185
Colorectal cancer ICD9 153–154
All cancers ICD9 140–208
All cancer without ICD9 140–172 and 174–208; non-melanona skin cancers
From 1 January 1997 in Cancer Registry and from 1 January 2000 in mortality data ICD10 codes were used
Lung cancer ICD10 C33–C34
Breast cancer ICD10 C50
Prostate cancer ICD10 C61
Colorectal cancer ICD10 C18–C21
All cancers ICD10 C00–C97*
All cancer without ICD10 C00–C43 and C45–C97
non-melanona skin cancers
*C97 is multiple cancer sites—used in mortality data only.
To minimise the numbers of age/sex cells with no cases, which creates instability in the analysis, we restricted analysis by age as follows: ≥20 years for all cancer; ≥30 years for lung cancer; ≥20 years for breast cancer; and ≥30 years for colorectal and ≥40 years for prostate cancer. This led to few omissions, ranging from 0.1% to 1.9% depending on the specific diagnosis.
We analysed only first events, that is, newly diagnosed cancers occurring between 2001 and 2008. First event meant that there was no record of the cancer diagnosis under study in the preceding 10 years in the mortality and cancer registration (SMR06) linked file. The cancer registry collects data from a range of sources including pathology laboratories, so our cases are likely to be new ones.
We calculated for first cancers for all and each cause, by sex: directly age standardised cumulative incidence rates (DASRs) per 100 000/year using 10-year age groups; DASR ratios (DASRRs); risk ratios (RRs) using Poisson regression with robust variance adjusting for age and country of birth; and 95% CI around summary measures. To assess effects of out-migration we calculated RR using moving average for 3-year time periods 2001–2004, 2002–2005, etc. In appendix 2, we provide details of our approach in calculating rates and RRs, including details of the Poisson modelling. The standard reference population was the White Scottish population. For ease of interpretation we multiplied ratios by 100 to get whole numbers interpretable as percentages. We adjusted the RRs for country of birth being Scotland or outside Scotland. Relatively few cases in ethnic minority populations were born in Scotland, for example, for all cancers excepting non-melanoma, the proportion was 5.1% in other White British, 11.2% in Indians, 18.5% in Pakistani, 8% of Chinese and 36% of African origin groups. In the small any mixed background group 64.7% were born in Scotland. For this reason, that is, statistical precision, analysis is not stratified by country of birth.
We examined, in each ethnic group, whether there was an association between eight indicators of socioeconomic position and all cancer rates (at all ages) and hence whether any were potentially valid confounding factors across all our ethnic groups. The indicators were: (1) the postcode (zipcode)-based Scottish Index of Multiple Deprivation, (2) car ownership, (3) highest qualification of the individual, (4) highest qualification in the household, (5) National Statistics Socio-economic Classification at individual, and (6) household levels, (7) household tenure and (8) economic activity in the previous week (of the Census completion date).
Data were analysed using SAS V.9 (SAS Institute Inc, Cary, North Carolina, USA) and Stata 11 (StataCorporation 2009; Statistical Software: Release V.11.0; College Station, Texas, USA).
In the Results section we provide both absolute (DASRs) and ratio (DASRRs and RRs) measures and describe findings where the 95% CI does not include 100, the value for the reference White Scottish population.
Ethics and disclosure
The work was approved by the Multicentre Research Ethics Committee for Scotland and the Privacy Advisory Committee of NHS National Services Scotland. The ethical and other permissions and related issues have been reported in detail,20 ,23 including an independent assessment by an ethicist.24 To comply with the Data Protection Act and safe-setting rules the data set only contained cancer outcomes. Other outcomes were excluded to minimise risks of inadvertent disclosure of identity. The analysis was conducted on a standalone computer in a locked room in the General Register Office for Scotland (GROS), now known as National Records Scotland, by named researchers (NB, MS,GB—see contributors), following a strict disclosure protocol. Outputs leaving the safe setting (including this paper) were screened by a GROS disclosure committee.
Results
All cancers without non-melanoma skin cancer
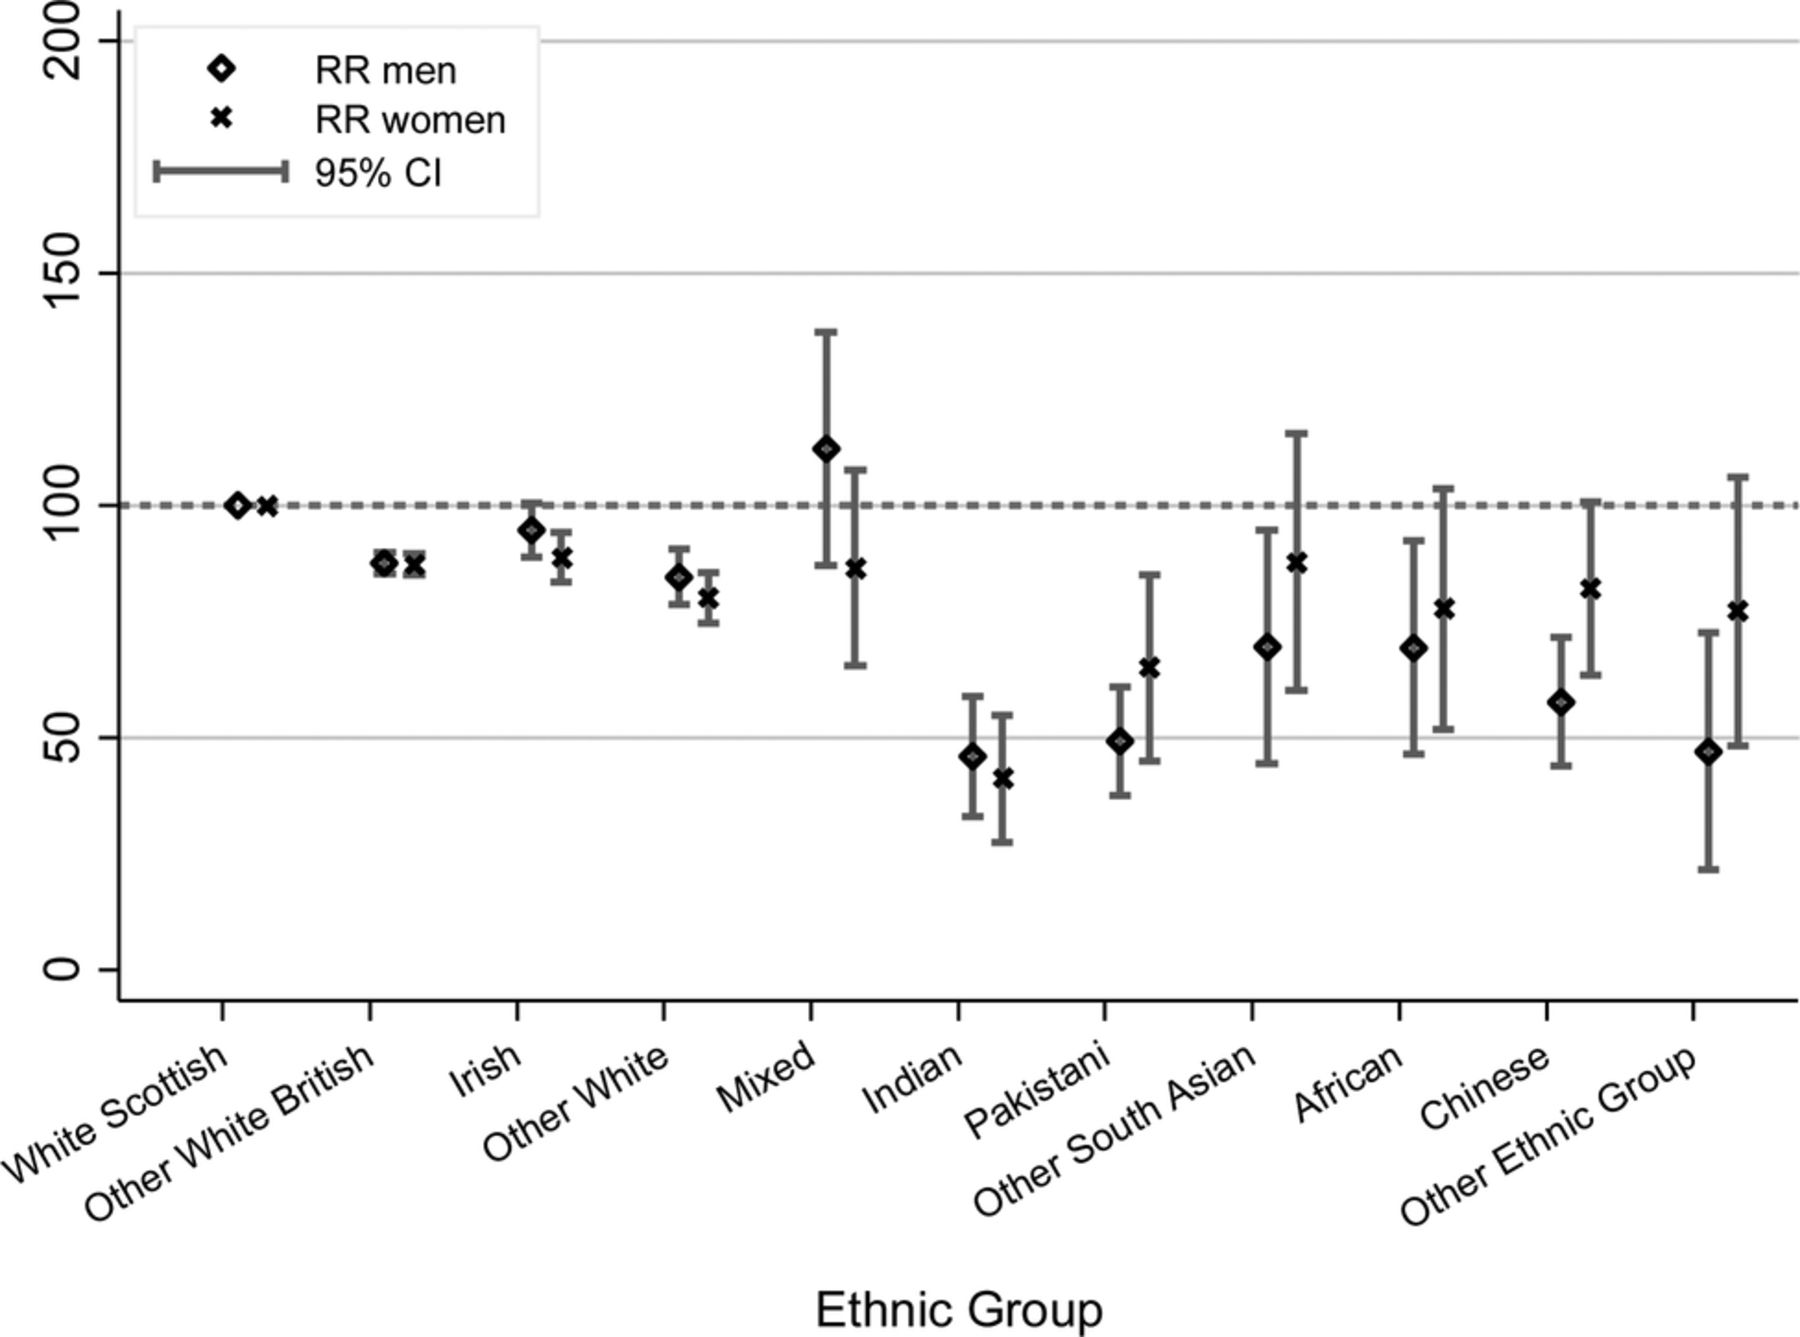
Table 1 and figure 1 show that in men and women, with the exception of men in the any mixed background group (where the 95% CI included the reference value), the White Scottish population had the highest rates and ratios of cancer (DASRR of 100 by definition), above even other White groups. The rates (and DASRRs) were particularly low in Indian (45.9 in men and 41.2 in women), Pakistani (49.3 in men and 65.0 in women) and Chinese (57.6 in men) populations. Including country of birth as a covariate, as shown by comparing the age-adjusted and age and country of birth-adjusted RRs (table 1), only slightly altered these patterns, though in this analysis 95% CIs were more likely to include the reference value. Generally, this adjustment closed the gap slightly between the reference and each comparison population.
All first cancer-excluding non-melanoma skin cancer occurring between May 2001 and April 2008: directly age standardised annual rates per 100 000 population/year by ethnic group and sex, and related rate ratios, and age and country of birth-adjusted risk ratios (Poisson regression), with corresponding 95% CIs

Any cancer age standardised rate ratio by ethnic group.
As shown in appendix 3 and table A2, except for the African origin group, and other South Asian women, RRs were similar in the time period 2001–2004, 2002–2005, 2003–2006, 2004–2007 and 2005–2008, indicating that, with the few exceptions above, unmeasured, differential emigration was not underlying these ethnic variations.
Lung cancer
Table 2 and figure 2 show that with the exception of the White Irish (similar), and any mixed background men (higher), all other ethnic groups had lower lung cancer standardised rates (and ratios) than the White Scottish population. The low DASRR for Pakistani men (45.0) and Chinese men (63.1) and a high DASRR for any mixed background men (174.5) were notable. The DASRs show that, in every group except for Chinese, men had much higher rates of lung cancer than women had.
Lung cancer: directly age standardised annual rates per 100 000 population/year by ethnic group and sex, and related rate ratios, and age and country of birth-adjusted risk ratios (Poisson regression), with corresponding 95% CIs

Lung cancer age standardised rate ratio by ethnic group.
Including country of birth as a covariate raised the RRs in every ethnic group, indicating Scottish-born people in these ethnic groups are at higher risk of lung cancer than those born abroad.
Colorectal cancer
Table 3 and figure 3 show large differences by ethnic group, with the highest DASRs for colorectal cancer in White Scottish and Irish men. Pakistani men (DASRR=32.9) and women (68.9) and Chinese men (42.6) had very low ratios with other White British (82.4 in men and 83.7 in women) and other White (77.2 in men, 74.9 in women) groups being intermediate. (Data for Indians are omitted for risks of disclosure reasons, but the results have been examined and the pattern is similar to that in Pakistanis).
Colorectal cancer: directly age standardised annual rates per 100 000 population/year by ethnic group and sex, and related rate ratios, and age and country of birth-adjusted risk ratios (Poisson regression), with corresponding 95% CIs

Colorectal cancer age standardised rate ratio by ethnic group.
Including country of birth as a covariate made little difference to the patterns observed, for example, the RR in Pakistani men changed from 45.6 to 46.4.
Breast cancer in women
Table 4 and figure 4 show large ethnic variations (but, for once, no advantage to the other White British population). White Irish populations (84.0) had lower DASRRs than the White Scottish population but DASRRs were especially low for Pakistani (62.2) and Chinese (63.0) populations. For Indian (86.5) and other South Asian (88.2) groups the rate ratios were closer to the reference value and the 95% CI included this. Adjustment for country of birth hardly altered the results.
Breast cancer in women: directly age standardised annual rates per 100 000 population/year by ethnic group, and related rate ratios, and age and country of birth-adjusted risk ratios (Poisson regression), with corresponding 95% CIs

Breast cancer age standardised rate ratio by ethnic group.
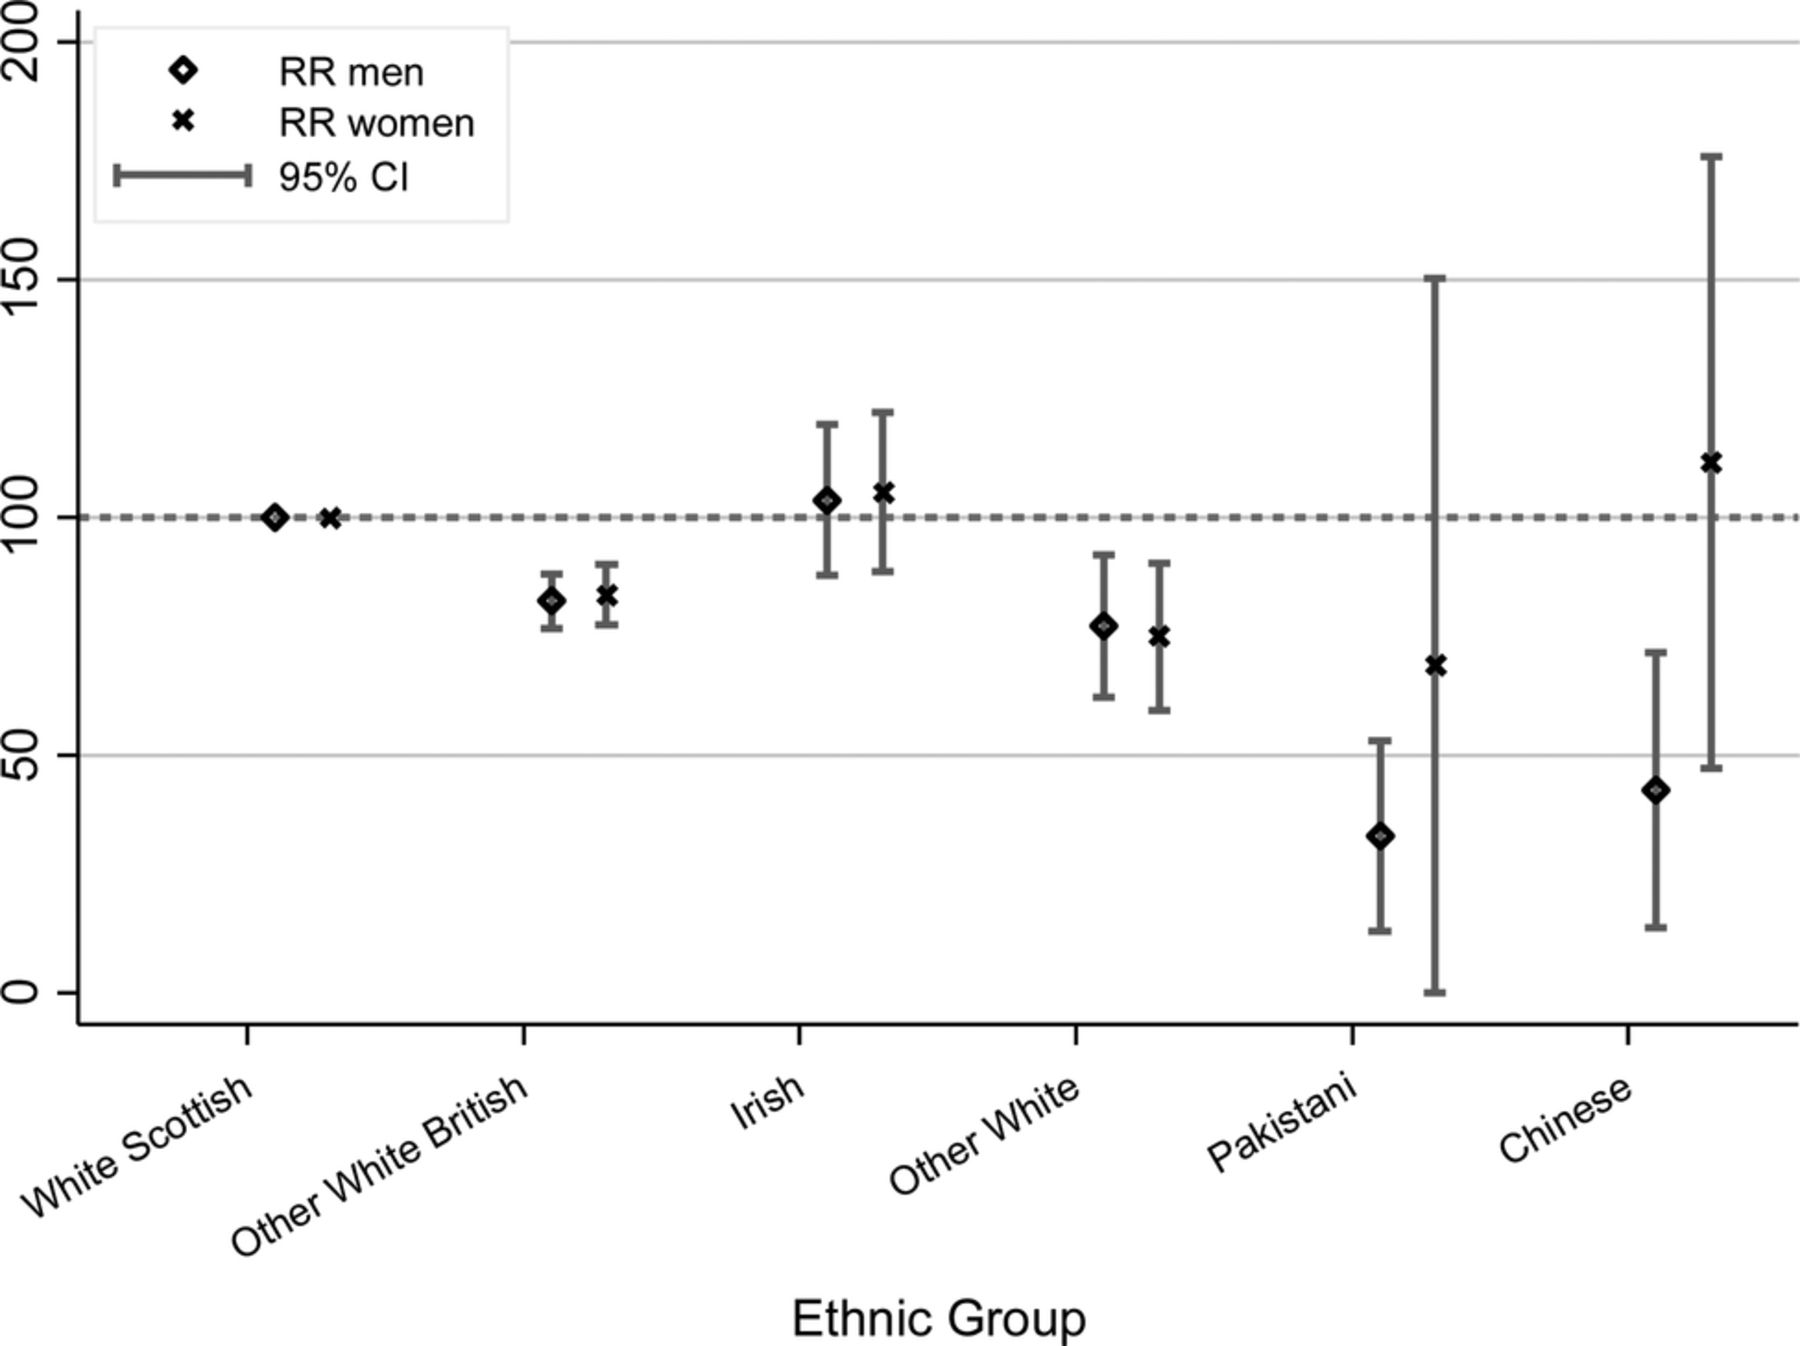
Prostate cancer
Table 5 and figure 5 show large ethnic differences in prostate cancer, with DASRRs as low as 38.7 in the Pakistani group, and considerably lower than in Indians (62.6). The other White British group (111.8) had a higher DASRR for prostate cancer than the White Scottish reference, while the White Irish (85.4) had a lower one. The African origin population had a high DASRR (138.1) but the 95% CIs included 100. (Moving average analysis showed little variation across time periods, but the data were not released because of risks of disclosure.) Adjustment for country of birth attenuated the risk difference in other White British, but across the Other ethnic groups the RRs were lowered suggesting that being born in Scotland was protective.
Prostate cancer: directly age standardised annual rates per 100 000 population/year by ethnic group, and related rate ratios, and age and country of birth-adjusted risk ratios (Poisson regression), with corresponding 95% CIs

Prostate cancer age standardised rate ratio by ethnic group.
Socio-economic factors
Appendix 4 (tables A3 and A4) shows the relationship between eight socio-economic variables and all cancers (all ages) by ethnic group. There was inconsistency in the relationships with no variable being consistently associated in the same direction with cancer in each ethnic group. These variables, therefore, did not meet the requirement of a confounding variable for our purposes.
Discussion
Principal findings
To our knowledge this is the first-reported European census-to-cancer data linkage exploring ethnic variations, though similar work has been done without the ethnicity angle in Iceland.25 Developing the method is, therefore, a key result. While disaggregating White subpopulations has been recommended,26 examples are rare,27 even though country of birth work in England shows substantially higher all-cause, cardiovascular and cancer death rates in Ireland-born and Scotland-born residents.16 Even recent incidence studies have omitted this opportunity.12 ,13 The observation that the White Scottish population, except for breast cancer and prostate cancer in the other White British, generally have higher rates than other ethnic groups in the same environment, further emphasises the challenge in Scotland.1 Differences in cancer rates between many non-White and White populations have been demonstrated previously,3 including in Scotland.2 ,3 ,9 ,21 Our advances here are to provide (retrospective) cohort data; to use the recommended measure of reported and not observer-assigned ethnic group; to provide data by a broad range of ethnic groups including White subgroups; to examine the associations with socio-economic factors to assess validity of potential confounding factors; to include country of birth in analyses; and provide updated data on a national scale.
The results have clinical and public health repercussions. For example, there is concern about low uptake of cancer screening services by South Asians.28 ,29 Breast cancer screening services need to achieve greater ethnic equity,30 especially as breast cancer mortality seems to be converging towards the historically high rates in the UK19 and ethnic minority women seem to be presenting with a comparatively high proportion of late-stage disease.31 However, before implementing new interventions to raise the rate of colorectal cancer screening, given the low relative rates of this cancer and that rapid convergence is not evident, for example, in Pakistan-born people9—we might wish to review the cost-effectiveness of screening in such ethnic groups first.
Strengths and limitations of the study
Retrospective cohort studies have the advantage of being low cost and fast in delivering results and, unlike case–control studies, provide incidence rates.32 The strength of the study is the development of new methods creating a retrospective cohort; high overall linkage rates (95%); a large national population (4.65 million people); the availability of reported ethnic data on a wide range of ethnic groups; a check on whether differential emigration by ethnic groups might be creating spurious differences by analysis over time using moving averages; the exploration of the potential role of socio-economic variables and country of birth available in the Census; and the linkage of Census data to both cancer registry and community/hospital mortality data, so differences in rates do not simply reflect varying entry by ethnic group to the health system.
Audits show high completeness and quality of the SMR06 file for cancer diagnoses though such statistics by ethnic group are not available.33 ,34 All deaths are certified by a doctor in Scotland and all hospitals are required to submit cancer registration data.
The validity of available indicators of socio-economic position, particularly area-based ones derived from postcode and census data, is not established in multiethnic studies, yet they are usually used in cancer research.13 ,35 Harding's study of mortality including cancer is a rare example of using other indicators.36 We tested eight indicators and found that none were consistently associated in the same direction with the outcome (cancer) and hence none were valid confounding variables suitable for across-ethnic group comparisons. The recommendation that studies of ethnic and racial variations adjust for socio-economic variables is sound but is not readily achievable as using invalid variables will generate spurious results.
Convergence of rates across generations is the predicted pattern.2 A recent review indicated that convergence was cancer site-specific and occurring slower than expected in Europe.3 We explored this using the country of birth variable in the Census and found this pattern was only evident for lung cancer. We acknowledge that this may change as more cases occur in Scotland-born ethnic minority populations. In future as those born in Scotland increase in age, examining cancer by ethnic group stratified by country of birth will be important. These data break new ground in Europe, both in terms of findings and in linkage methods.3
The limitations of the study include the small numbers of outcomes for some non-White populations, and the consequent aggregation of some ethnic groups, though the numbers are large compared with a recent paper.11 The result is imprecision of estimates and insufficient numbers to examine survival as others have done.37 We had some variation in linkage rates by ethnic group (ranging from 85.1% in other South Asian to 95.3% in White Scottish) but the potential bias is unknown. We think such bias would be small as the variation in linkage is most probably due to random causes, for example, variations in the spelling of unfamiliar names or misrecording of date of birth in NHS databases. Similarly, there may have been differences in response rates by ethnic group in the census but the potential bias cannot be assessed for lack of data on non-responders. Inability to capture events that occur overseas outside the UK is a problem that is not easily resolved. Deaths of UK residents are reported back via several channels, including embassies and consulates, and the primary care registration systems. Such reports, however, may not give an accurate cause of death. ‘Salmon bias’, whereby sick people return to countries of origin to die or for treatment, is potentially important but we think it unlikely in Scotland, and not a central issue for this analysis. First, in contrast to cancers, we find high rates of cardiovascular disorders, including chronic ones such as heart failure, in South Asian populations.38 A ‘salmon bias’ is not likely to be specific to cancer but to life-threatening chronic illness. NHS Scotland provides excellent services free at the point of use so that cancer patients are likely to stay not as emigrate. Finally, 90% of our events are incident cases, not mortality, and the bias applies to mortality data. Denominator bias would arise from differential migration by ethnic group. If this occurred then rate ratios would alter over time. Appendix 3 and table A2 show that this did not happen for most ethnic groups for all cancers.
The greatest limitation of retrospective cohort studies is inability to specify which confounding variables and risk factors are to be studied, and also to control the quality and completeness of outcome data.32 In our case the census gave access to a wide range of relevant exposure and potential confounding variables. The outcome data are of high quality and completeness in Scotland. The lack of cancer risk factor data in our retrospective cohort is a limitation, as in many studies of this design. We have no specific risk factor data to explore hypotheses though we are starting a pilot project reporting in 2013 on linking risk factor data held in primary care to our data but even if successful we do not envisage having such data till about 2015. In the meantime, we have used data from national health surveys39 ,40 to help interpret the cancer patterns (table 6) as discussed below.
Pattern* of smoking, alcohol, physical activity, fruit/vegetables and meat eating, hormone replacement therapy and obesity/central obesity by six ethnic group from Health Surveys for England (1999 and 2004) and Scottish Health Survey (2003 and 1999)
Findings in relation to the literature
The Scottish context
Scotland has high cancer rates, probably reflecting historically high exposure to causal factors such as smoking, and a diet high in processed foods and low in fruit and vegetables.1 ,41 These factors combine with comparatively poor socio-economic status, in ways that are not properly understood. It is of both scientific and public health significance that people of other ethnic groups in Scotland do not share White Scottish residents’ propensity to cancer. This applies to both White and non-White subgroups alike, though particularly the latter. Other White British in Scotland, predominantly English, have lower rates of a range of problems (including all cancer, but not breast or prostate cancer in these results). Similar results were found for those born in England and Wales and living in Scotland, and those born in Scotland and living in England and Wales, for example, lower cancer mortality16 and all-cause mortality and cardiovascular,42 ,43 and alcohol-related mortality44 ,45 in England and Wales born. These differences are probably linked to the higher socio-economic status and lower exposure to causal factors of these other White British (predominantly English) populations compared to the White Scottish group. This is a less likely explanation for White Scottish people having (mostly) higher cancer rates than White Irish, and other White groups. Examination of White subgroups in epidemiology is uncommon. Given the potential interest demonstrated here more work is warranted especially in the acquisition of risk factor data that are integral to the cohort analysis.
The main non-White populations of Scotland are Pakistani, Indian and Chinese. They are well established, with about half of the population born in the UK.46 ,47 The main Indian, Pakistani and Chinese population migrations to Scotland occurred in the mid-1950s through the 1970s. People from these ethnic groups born abroad have lived on average in Scotland for several decades although exact data are not available. In 2001, about half of these three ethnic populations lived in the West of Scotland in Greater Glasgow and Lanarkshire health board areas (http://www.scotpho.org.uk/downloads/ethnic_pop_by_hb.xls, accessed 26 April 2012) comprising some of the most socio-economically deprived areas in Western Europe, known for their high death rates for chronic diseases, including cancer.48
Risk factors and socioeconomic status
The socio-economic status of Indian, Pakistani and Chinese populations in Scotland is hard to assess, as on some indicators they are better, for example, housing tenure, on others they are worse, for example, employment status.49 Overall, Indians, Pakistanis and White Scottish populations seem to be similar and Chinese slightly worse off. South Asian populations have higher cardiovascular disease (CVD) rates23 and higher rates of diabetes than the White Scottish population50 and given that CVD and cancer share risk factors, and diabetes may raise cancer risk, there is no prior reason to expect cancer rates to be low in these populations in Scotland, especially in those born, or long-settled, in Scotland. Notwithstanding previous work elsewhere,3 and Scotland9 it is a surprise, therefore, to find that all cancers and some common cancers are still, decades after Matheson et al9 and Merchant et al22 reported, substantially less common in non-White populations, especially in South Asians. Unlike much previous research using country of birth and deaths data, where wariness about data artefacts, particularly numerator and denominator mismatch bias,3 ,16 cautions against accepting large variations as correct,5 this linked cohort analysis indicates that differences are possibly even larger then reported hitherto using proxy measures of ethnicity.3 ,16 ,19 Reduction in the strength of the association is a typical outcome of non-differential (non-systematic) mismeasurement error so the increased variations are in line with epidemiological principles.
Using the Health Surveys for England39 ,40 and the Scottish Health Survey, table 6 summarises the best available data on some major cancer risk factors, as identified by Cancer Research UK (http://info.cancerresearchuk.org/healthyliving/; accessed 26 April 2012). The Scottish population data were collected separately using very similar methods to those in the Health Survey for England, except for the red meat question. Except for physical activity, which may be a reporting artefact, the White Scottish population has the highest, or among the highest, prevalence of all nine risk factors, with the non-White populations, especially women, having the lowest prevalences. These patterns are in alignment with the results on all cancer (table 1 and figure 1). The Scottish Health and Lifestyle Surveys have very small numbers of people from these populations so Scottish data have not been published by ethnic group.51 While little is known about the risk factor profile of ethnic minority groups in Scotland, some data are available for Glasgow, the home to a high proportion of Scotland's non-White population, where questionnaire-based health and lifestyle surveys have been done.52 These Glasgow data lend support to findings from the Health Survey for England in table 640, for example, smoking is uncommon in South Asian women and in Indian men but common in Pakistani men; drinking alcohol is uncommon in South Asian women and Pakistani men (mostly Muslim) but not so in Indian men; and the diet is a mix of traditional and Scottish foods with high fat content,53 at par with local populations. While substantial numbers of Indians are vegetarians, or occasional eaters of meat, Pakistani populations are not, with red meat (particularly lamb) being a key dietary component.54 ,55
Implications for research, public health and clinical practice
More fundamental research is required to explain ethnic variations. This requires basic science cancer researchers to join forces with epidemiologists, so hypotheses can be both generated and tested in multidisciplinary research groups. In practical terms, we propose that a research unit for the focused study of ethnic variations in cancer be set up. In such a research environment, for example, hypotheses for the differences in colorectal cancer risk could be systematically tested, rather than the current ad hoc approach, where interesting observations are made but not studied in depth, a problem exemplified in the UK since at least 1984.56 A full discussion of biomedical hypotheses is beyond the scope of this paper but we consider in a little detail colorectal cancer, and very briefly the other three specific cancers, in relation to risk factors to illustrate the potential.
The well-known ‘deficit’ of colorectal cancer in South Asian populations has led to interest in dietary components, especially spices such as curcumin (a component of turmeric) and capsaicin,57 fibre and other complex carbohydrates influencing bile acid metabolism and bowel flora, as protective agents.18 ,58–60 This line of reasoning assumes a protective agent in South Asian populations. An alternative, perhaps more promising line, is to assume less exposure to carcinogenic agents in the South Asian lifestyle. Meat, particularly red meat, is a postulated source of such carcinogens,61 ,62 yet Pakistani populations are keen red meat consumers (see table 6). It may be that processing agents for meat are more important than the meat itself as indicated, especially, in the earlier62 of recent systematic reviews61 and also recently suggested for cardiovascular risk.63 It is possible that the Pakistani diet contains less processed meat. Health Survey for England data, unfortunately, combine all red meats (table 6). Unpublished data on the diet of infants and very young children in Bradford indicates that this is correct—processed meats were a common reported component in White English Bradford infants, but not in Pakistanis (data examined by Raj S Bhopal as co-investigator of the Born in Bradford study, communication of findings with permission from John Wright, PI of Born in Bradford Project). South Asians are also less likely to smoke heavily and smoking has been associated with both colonic and rectal cancer in the Whitehall one cohort study.64 In terms of well established associations for colorectal cancer (table 6) the picture is less clear—South Asians report eating more fruit and vegetables and have a lower body mass index, which are protective, but have higher waist/hip ratio and central obesity and lower physical activity which are risks. These small and inconsistent variations do not reconcile with the major differences in disease outcomes. These kinds of hypotheses, which may explain the sustained low rates of colorectal cancer in some ethnic minority populations, need detailed study.
The challenges for public health include maintaining the low rates of cancer in non-White population while reducing them in White populations. This is one example where the general goal of narrowing inequalities needs careful specification of the change needed.65 In all likelihood, given the anticipated tendency to convergence of disease risks in migrant populations,3 cancer rates will rise in non-White ethnic minority groups in Scotland, so reducing inequalities but worsening public health. The greater challenge is to reduce inequalities by finding strategies that encourage convergence of the majority White populations to the low rates in the non-White groups. Already, however, it may be too late for breast cancer12 but fortunately not for many other cancers.3 ,19
Given the likely lower level of reproductive risk factors (early menarche, late first child, small family and no breast feeding) and of smoking we expected substantially less breast cancer in non-White women, especially South Asians, but the rates were similar in Indians and other South Asians although still substantially lower in Pakistanis. The pattern for breast cancer in Pakistanis accords with historically relatively early marriage, children and breast feeding—all more common than in the White Scottish. Unpublished recent data from Scotland indicate only small ethnic differences in age at first birth, but substantially more breast feeding in all non-White groups, especially South Asians (personal observation as PI using Scottish Health and Ethnicity Linkage Study maternity data, paper in preparation). Table 6 shows non-White women were far less likely to report taking hormone replacement therapy than White groups. While non-White groups had less overweight/obesity than White Scottish women, with little difference in waist/hip ratio, they are generally more adipose, a phenomenon known to be present at a very young age, as reflected in skinfold thickness and direct measure of fat in children.66 We found no evidence for an excess of breast cancer in African origin populations, as reported with contested data in England,67–69 although our numbers are very small. The comparatively low uptake of breast cancer screening in ethnic minority populations requires urgent action,29 including in Scotland where we have corroborated the findings in England.30 Breast cancer screening leads to earlier diagnosis and reduced case death so increased participation may lead to convergence of incidence rates but better outcome.
Screening rates for colorectal cancer are also low in South Asians,29 although Scottish data are not yet available by ethnic group. Since screening leads to both reduced incidence (removal of polyps and premalignant lesions) and early diagnosis we would expect even lower rates of colorectal cancer if South Asians participated equally in this service. The effectiveness/cost-effectiveness data on which colorectal screening is based, although solid,70 are probably not applicable to populations with both low rates of colorectal cancer and low participation, such as Pakistanis. Modelling of cost-effectiveness may help to decide how to proceed, especially on the urgency of implementing new interventions to raise colorectal screening rates in South Asians.29
Given the primary cause of lung cancer is tobacco, and tobacco smoking is relatively uncommon in South Asians, particularly women and Indians, though not so for Pakistani and Bangladeshi men40 ,71 the low rates are in line with cigarette-smoking patterns (table 6). We note the high prevalence of lung cancer in mixed population men but such data need corroboration. Pakistani men have the same high prevalence of current smoking as White Scottish men but the amount smoked is lower, which together with the fact that lifetime exposure to tobacco matters, probably explains their lower risk of lung cancer. The traditional taboos against smoking in South Asian women are holding, in contrast to earlier expectations and predictions.40 The same is not true of men, particularly Bangladeshi and Pakistani men,40 and there is evidence in Glasgow that the prevalence of smoking in school leaving age South Asian boys is similar to that in White boys.72 Until recently, in England and Wales, smoking cessation services were not accessed well by ethnic minority populations, though this has changed recently. The situation in Scotland is unknown. Lung cancer in South Asian men is likely to converge towards the White Scottish population rate as implied by our analysis with country of birth as a covariate, as it has done in England and Wales.
Prostate cancer is known to vary greatly by ethnic group, with high rates in African origin (Black) populations and low rates in South Asian groups.13 ,73 We corroborated these patterns, though the risk estimates for this ethnic group are imprecise. In a recent review, the age standardised incidence rate in the Black population in the UK PROCESS study was estimated at 166/100 000, three times higher than in the White Population, 258/100 000 in the USA and 304/100 000 in Jamaica. Our estimate of 326.6/100 000 in African origin populations fits with these data. Additionally, our data suggest differences between Indians and Pakistanis and low rates in Chinese. We also noted low rates in White Irish, and high rates in other White British. The causes of these variations are unknown though the patterns have potential to generate testable hypotheses. However, ethnic group variations in testing for prostate-specific antigen (PSA), and subsequent biopsy, are likely to be a major determinant of variations in the incidence of diagnosed cancer as implied by recent studies in Scotland and Ireland.74 ,75 In contrast to our findings, prostate cancer rates are comparatively high in the Republic of Ireland. This may reflect higher rates of PSA testing and greater use of biopsies there. Biological understanding of such ethnic variations is limited, with current attention focused on genetics, hormones and fat, dietary factors including fatty acids, and vitamin D.73 These ethnic variations provide a good model for disentangling causal hypotheses, for example, our findings do not support a major causal role for vitamin D, as the lowest rates are in populations with the lowest vitamin D levels, that is, South Asians.76 One hypothesis currently of interest is dietary factors such as lycopene in tomatoes being protective. Valid dietary data across ethnic groups are few55 but tomatoes are integral to the preparation of many common meals in the South Asian cuisine. Table 6 indicates a higher level of fruit and vegetable consumption in all the non-White groups—which fits with the low risk of prostatic cancer in South Asian and Chinese men but not with the higher risk (though 95% CI includes 100) in the African origin groups.
Since Scotland has high rates of cancer we would expect that non-White Scottish ethnic groups born in Scotland would have higher rates than their parents/grandparents born abroad. Generally, adding country of birth led to modest narrowing of the risk difference, but in the age group developing cancers, relatively few non-White minority patients were born in Scotland. Unsurprisingly, the adjustment had most impact for lung cancer, as the major risk factor of smoking is socially patterned. It appears that the protection enjoyed by minority groups may be sustained for some cancers across generations, and convergence may be slower than expected as indicated from studies in Europe.3 Definitive analyses will need to wait until the Scottish born ethnic minority populations have moved into the age groups where cancers are common.
Conclusions
Powerful calls have been made for the collection of data by ethnic group and not by other proxies.2 ,3 ,77 The Scottish Health and Ethnicity Linkage Study has shown how to obtain national cancer statistics by ethnic group. The same methods could be applied wherever a population census or database records ethnic group, as in England and Wales, where the large numbers will permit a finer disaggregation of ethnic groups with the potential of incorporating important covariates such as religion, country of birth and social circumstances. The advantages over solely relying on NHS databases12 ,13 are a more reliable denominator and linked numerator data, longitudinal analysis of outcomes and access to relevant economic and social variables not available in NHS databases. The findings on all cancers, and specific cancers (particularly colorectal, prostate and breast), raise important questions on causation, and on public health and clinical policies. Risk factor data are required to help explain such variations better. Ideally, these would be collected within prospective cohort studies. We also need to find ways of linking risk factor data from other sources such as primary care. In the meantime, we need better and ongoing multiethnic cross-sectional health surveys across the UK to augment the 1999 and 2004 Health Surveys for England.39 ,40 The study contradicts the usual viewpoint that the health status of ethnic minorities is poor, at least for all-cancers and common cancers. The main public health lesson and challenge is for the majority population, for the ‘Scottish effect’ in relation to cancer does not apply across Scotland's ethnic groups. Can the White Scottish population change to enjoy the low rates of cancer seen in other ethnic groups in the country? Also, can the non-White groups avoid the high risks of cancer in Scotland across the generations? This exemplifies how the study of ethnic variations provides a public health approach with potential to benefit the entire population.
Acknowledgments
We thank the Chief Scientist's Office for a grant (CZH/4/432), NHS Health Scotland for a supplementary grant and the Equality and Diversity Information Programme of the Information Services Division (ISD) of NHS National Services Scotland for support. ISD and the General Register Office for Scotland both made ‘in-house’ contributions to the work. Joan Jamieson (ISD) was a co-investigator in the early stages and general adviser. Helen Brown was senior research fellow in the earlier stages of the study. Anne Houghton and Arti Nair gave secretarial help to prepare the paper and to general administration. Sarah Wild and Colin Simpson provided helpful comments on an earlier manuscript. BMJ editors and referees (Ruth Jack and Philippe Autier) provided invaluable feedback to improve this paper. Other Contributors from the Scottish Health and Ethnicity Linkage Study investigators: Colin Fischbacher was co-principal applicant and Chairman of the Steering Committee. Chris Povey was a co-investigator and had the idea of linking the census data to the data held by ISD and performed most of the linkage work including developing linkage methods. Jim Chalmers was a co-investigator and had the original idea for the use of one-way encryption. Ganka Mueller was a collaborator and was key in linking Census data to health data. Ms Genevieve Brin led the analysis of socioeconomic position. Kirsty MacLachlan advised throughout. These important contributions did not meet ICMJE authorship requirements. The authorship, the authorship byline, and note of contributions has been agreed by all the investigators named.
Appendix 1 Details on linkage methods (text lightly edited from open-access publication23)
Appendix figure 1, republished from our open-access publication23 illustrates in concept how record linkage was based on information from three datasets: healthcare records, which include personal identifiers and clinical information; the CHI which contains personal identifiers and the CHI number; and the census file which contains personal identifiers and details of individuals’ ethnicity. The 14 ethnic groups are given in appendix table A1. The CHI dataset lists in Scotland everyone registered with a general practitioner or eligible for NHS screening services and forms a unique identifier for NHS use. More than 99% of the Scottish population is estimated to be listed on the CHI.
Linkage rates by ethnic group

Overview of Record Linkage Process.
Date of birth, surname (using soundex codes to allow for variations in spelling), forename, address and full postcode, which were available in both data sets, albeit not always recorded identically, were used to link the census number to the CHI. At this stage, other data fields in the two datasets were disconnected from identifying variables. CHI and the census unique number were encrypted prior to linkage. A one-way cryptographic (‘hashing’) algorithm (currently impossible to reverse) was used to encrypt the CHI number. The census number was encrypted using an algorithm developed by GROS. For the records deemed to be matches, 73.6% were exact matches. For the remainder, a probability matching process was performed. Here, the rate of false positives is critical. Methods have been developed to identify how false positives occur and what kind of strategies a human checker employs to decide whether a pair match is ‘good’. These decision strategies were built into a ‘partitioning’ computer algorithm. These ‘partitions’ then allow the allocation of effort to the most profitable ‘partitions’ which yield the lowest false-positive and highest true-positive rates.
Once the linkage was completed personal identifying variables (such as names, address, postcode and dates of birth) were removed leaving a file with an encrypted CHI number and its corresponding encrypted census number (look up file). A census extract containing ethnic code (and limited other data including age, sex and indicators of socio-economic status) was joined to the above look-up file using the encrypted census number. The encrypted census numbers were then discarded leaving the ethnicity code, some other variables from the census, the encrypted CHI number and a newly generated index number unrelated to other numbers for the exclusive use of this project. The relevant parts of the ISD-linked database were linked via the encrypted CHI numbers. The encrypted CHI was replaced with an unrelated serial number (to keep together the multiple records on the same people), resulting in depersonalised clinical health records carrying census ethnicity codes. Using methods previously described we estimated an upper limit to the false-positive linkage rate of 0.08%.23
Appendix 2 Methods for calculating rates, ratios and RRs
To calculate DASRs we used the cohort denominator at April 2001, and for the numerator the first event cancers for 7 years thereafter. We divided the result by 7 to get an annual rate. We had no information on emigration to recalculate denominators over time. Non-cancer outcomes were not available because of concerns over disclosure (see ethics and disclosure). We did not adjust the denominator to remove 50% of the people who developed cancer because the outcome is rare. For example, for all cancer in the White Scottish population the adjusted denominator would be 1 433 584−(0.5×71 094)=1 398 037, which is 97.5%. (It is standard practice to remove half of the numerator from the denominator when readjusting denominators in these circumstances.32) The recalculated directly standardised rate is 726.5 compared with our reported figure of 708.5, a 2.5% difference, for our commonest outcome. The difference would be much smaller for the specific cancers. The effect on rate ratio and RRs would be very small, and less than this. Our approach has the merit of simplicity and is standard in descriptive epidemiology for rare outcomes32 and has been adopted across SHELS analyses. The approach here—modelling cumulative incidence (risks) rather than person–time incidence—is appropriate when the numbers no longer at risk at the end of the observation period is not high (as here), when the period of observation is not highly variable (as here) and when the main comparisons are with a general population (as here). Szklo and Nieto's32 established textbook notes that the cumulative incidence approach we have used leads to a lower absolute value for the incidence than with a person–time rate but when events are rare (as here) the discrepancy is small.
We constructed Poisson models with age only and then included variables where we had a specific hypothesis; so there was no unspecified exploration (fishing), and no modelling with forward or backward selection to include as many significant cofactors as possible.
With robust variance we mean the empirical (robust) estimator of the covariance matrix. It has the property of being a consistent estimator of the covariance matrix, even if the working correlation matrix is misspecified. Some relevant papers are:
Zeger SL, Liang KY, Albert PS. Models for longitudinal data: a generalized estimating equation approach. Biometrics 1988;44: 1049–60.
Royall RM. Model robust inference using maximum likelihood estimators. Int Statist Rev 1986;54:221–6.
White H. Maximum likelihood estimation of misspecified models. Econometrica 1982;50: 1–25.
We used SAS for our statistical analysis and the user documentation advises that if you include the statement ‘REPEATED SUBJECT=…/TYPE=unstr;’ that empirical (or robust) estimators are produced, even if you have only one observation per subject. The subject identifier needs also be put in the CLASS statement. We can supply the full computer code to interested readers.
Appendix 3 moving average analysis of all-cancer over time to check for effects of changing denominators
For text interpreting the results in table A2 see: Results section. All cancers without non-melanoma skin cancer and discussion (strengths and weaknesses).
Number of cases and age-adjusted risk ratios (RR) for five overlapping time periods for all cancers (except for non-melanoma skin cancer) by ethnic group
Appendix 4 Assessing the potential to adjust for putative confounding variables
The data in table A3(A) for men and table A3(B) for women show that none of the eight variables were consistently associated with cancer, that is, in the same direction of association. Mostly the variables were associated as expected (though not always with linear effects) in the White groups but less so in the non-White ethnic groups. For example, in men and SIMD (Scottish Index of Multiple Deprivation) the association varied widely across ethnic groups, from a decrease in cancer with increase in deprivation (−2.2%) to an increase in most groups, for example, 5.5% in White Scottish. In addition, SIMD did not show a linear increase in cancer with each category change in score (indicated by asterisk).
Age-adjusted relative increase (%) in risk of cancer (and 95%CI) for each category increase in the variable for census-derived socio-economic variables
Table A4 shows that for no variable was the direction of association the same in all ethnic groups. SIMD was closest (10/11 times in men and 8/11 in women). However, our prior agreed definition for a valid confounding variable for the purposes of our analysis was that the direction of association should be the same in all ethnic groups. The alternative would have been to exclude some populations from adjustment for confounders. However, there are two good reasons for not doing this (1) it would be against the general approach of examining across groups and would go counter to our prior analysis strategy, (2) the scientific literature generally shows that area-based measures are not consistent confounders across ethnic groups. We concluded, therefore, that adjusting using these variables would be open to criticism.
Summary of performance of the eight measures of socio-economic position as potential confounding factors
References
Supplementary materials
Supplementary Data
This web only file has been produced by the BMJ Publishing Group from an electronic file supplied by the author(s) and has not been edited for content.
Files in this Data Supplement:
- Data supplement 1 - Online appendix
Footnotes
-
Funding The researchers acted independently of the funding body and the study sponsor (the University of Edinburgh) at all stages of the work.
-
Contributors RSB was the PI and lead writer. DHB was a co-investigator and Chair of Cancer subgroup of SHELS. NB was the research fellow and co-ordinator of the study. MS was researcher and primary analyst. All authors helped plan the study, evolve analysis plans, interpret data and critically revise successive drafts of the manuscript.
-
Competing interests None.
-
Provenance and peer review Not commissioned; externally peer reviewed.
-
Data sharing statement The data are only available in a data safe haven with restricted access at National Records Scotland, and governed by strict ethical and other restrictions on access. Individual consent for linking these records was not sought. The analysts did not have access to identifiable data.